
|
|||||
|
 | |
| |
| |
| |
| |
| |
|
Gene: TAF1L |
Gene summary for TAF1L |
| Gene information | Species | Human | Gene symbol | TAF1L | Gene ID | 138474 |
| Gene name | TATA-box binding protein associated factor 1 like | |
| Gene Alias | TAF(II)210 | |
| Cytomap | 9p21.1 | |
| Gene Type | protein-coding | GO ID | GO:0000003 | UniProtAcc | Q8IZX4 |
Top |
Malignant transformation analysis |
| Identification of the aberrant gene expression in precancerous and cancerous lesions by comparing the gene expression of stem-like cells in diseased tissues with normal stem cells |
| Entrez ID | Symbol | Replicates | Species | Organ | Tissue | Adj P-value | Log2FC | Malignancy |
| 138474 | TAF1L | HCC1 | Human | Liver | HCC | 5.09e-08 | 8.39e-01 | 0.5336 |
| 138474 | TAF1L | HCC2 | Human | Liver | HCC | 1.60e-10 | 7.88e-01 | 0.5341 |
| 138474 | TAF1L | HCC5 | Human | Liver | HCC | 2.42e-07 | 4.26e-01 | 0.4932 |
| Page: 1 |
| Tissue | Expression Dynamics | Abbreviation |
| Liver | 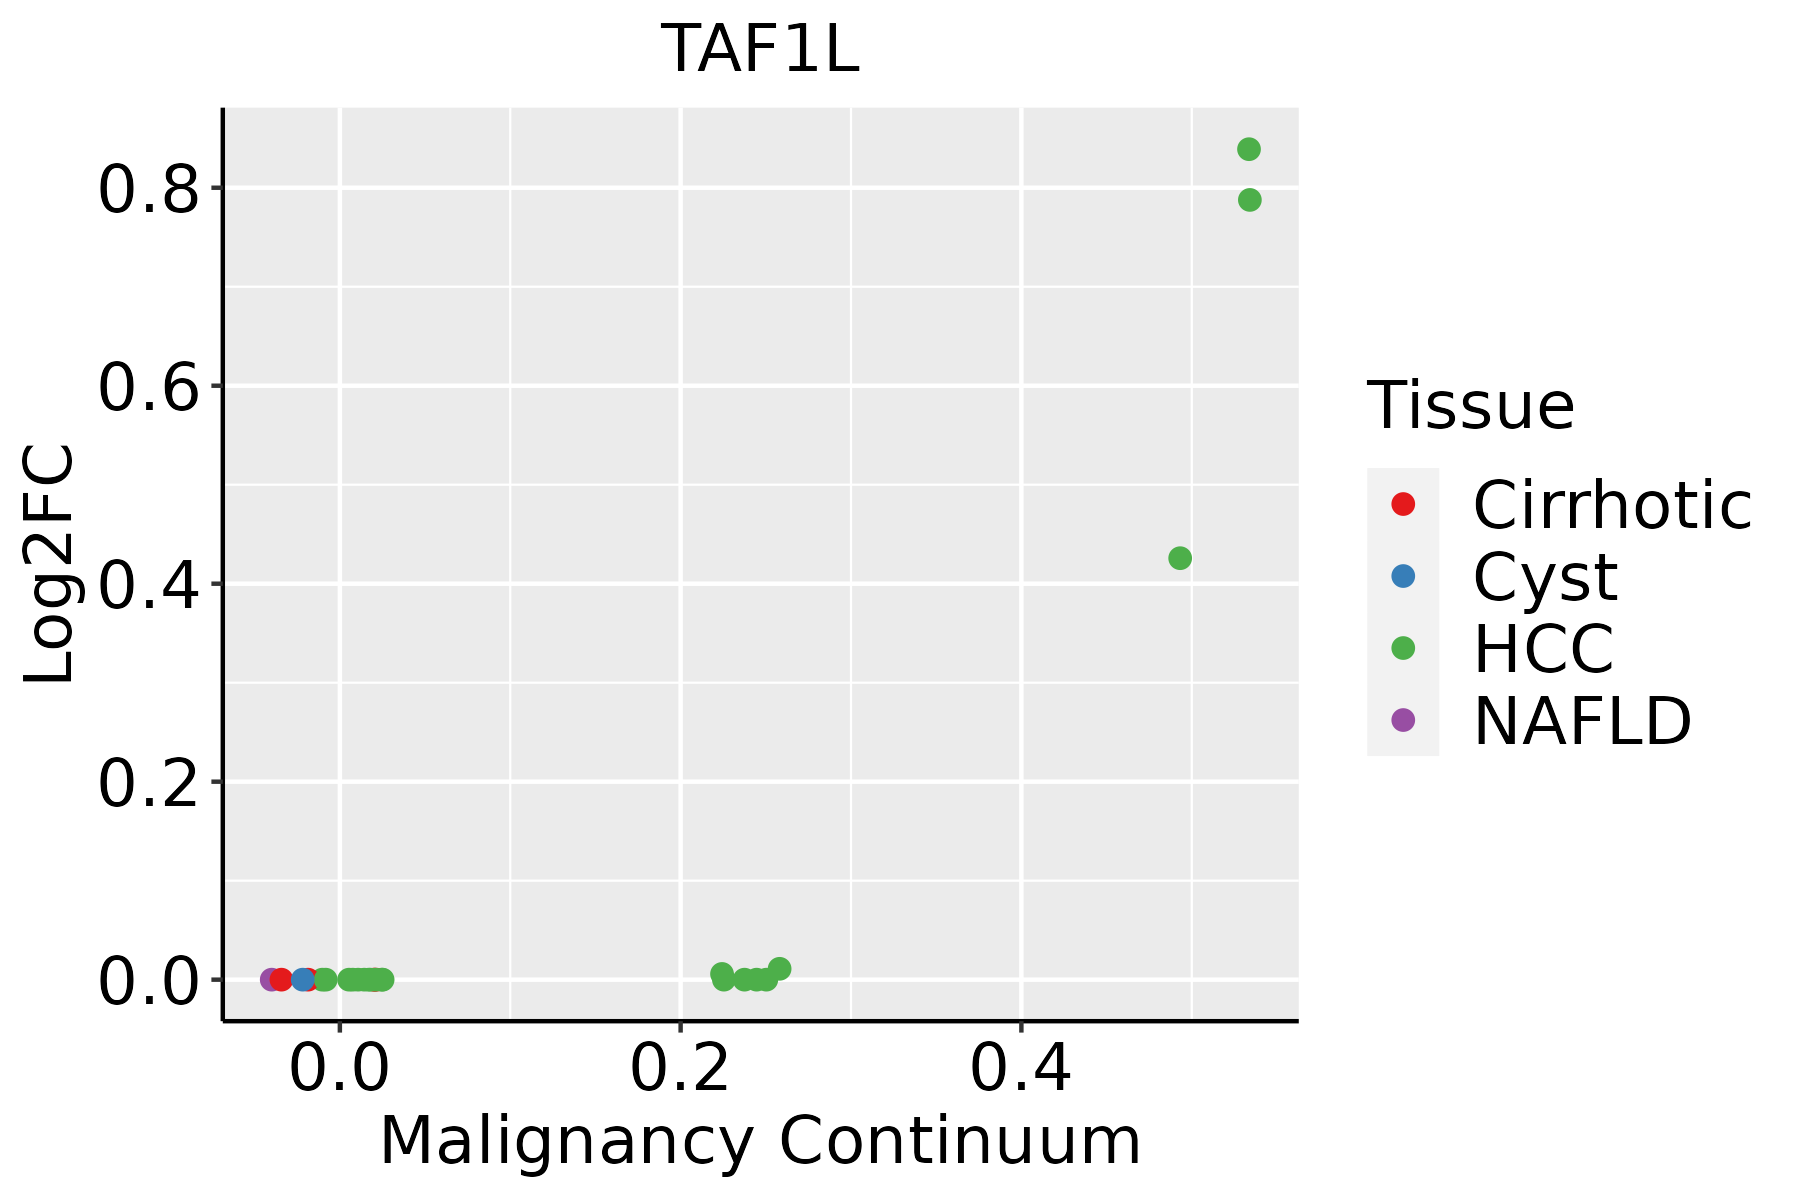 | HCC: Hepatocellular carcinoma |
| NAFLD: Non-alcoholic fatty liver disease |
| ∗log2FC in expression of this searched gene in stem-like cells from each diseased tissue sample relative to stem-like cells in normal samples in each tissue plotted against the malignancy continuum. Samples are colored based on if they are from different disease stage. |
Top |
Malignant transformation related pathway analysis |
| Find out the enriched GO biological processes and KEGG pathways involved in transition from healthy to precancer to cancer |
| Tissue | Disease Stage | Enriched GO biological Processes |
| Colorectum | AD |  |
| Colorectum | SER |  |
| Colorectum | MSS |  |
| Colorectum | MSI-H |  |
| Colorectum | FAP |  |
| ∗Top 15 enriched GO BP terms are showed in the bar plot of each disease state in each tissue. Each row represents a significant GO biological process which is colored according to the -log10(p.adjust). |
| Page: 1 2 3 4 5 6 7 8 9 |
| GO ID | Tissue | Disease Stage | Description | Gene Ratio | Bg Ratio | pvalue | p.adjust | Count |
| GO:001657021 | Liver | HCC | histone modification | 283/7958 | 463/18723 | 2.68e-16 | 2.33e-14 | 283 |
| GO:00182052 | Liver | HCC | peptidyl-lysine modification | 230/7958 | 376/18723 | 1.51e-13 | 8.32e-12 | 230 |
| GO:00064732 | Liver | HCC | protein acetylation | 135/7958 | 201/18723 | 1.20e-12 | 5.92e-11 | 135 |
| GO:00435432 | Liver | HCC | protein acylation | 157/7958 | 243/18723 | 2.40e-12 | 1.12e-10 | 157 |
| GO:00183942 | Liver | HCC | peptidyl-lysine acetylation | 116/7958 | 169/18723 | 5.11e-12 | 2.23e-10 | 116 |
| GO:00064752 | Liver | HCC | internal protein amino acid acetylation | 107/7958 | 160/18723 | 3.77e-10 | 1.23e-08 | 107 |
| GO:00183932 | Liver | HCC | internal peptidyl-lysine acetylation | 105/7958 | 158/18723 | 9.48e-10 | 2.90e-08 | 105 |
| GO:00165732 | Liver | HCC | histone acetylation | 101/7958 | 152/18723 | 1.99e-09 | 5.63e-08 | 101 |
| GO:00063671 | Liver | HCC | transcription initiation from RNA polymerase II promoter | 52/7958 | 77/18723 | 7.87e-06 | 9.27e-05 | 52 |
| GO:0048285 | Liver | HCC | organelle fission | 254/7958 | 488/18723 | 1.07e-05 | 1.23e-04 | 254 |
| GO:0006352 | Liver | HCC | DNA-templated transcription, initiation | 78/7958 | 130/18723 | 4.19e-05 | 4.11e-04 | 78 |
| GO:0000280 | Liver | HCC | nuclear division | 220/7958 | 439/18723 | 6.90e-04 | 4.25e-03 | 220 |
| GO:00708971 | Liver | HCC | transcription preinitiation complex assembly | 25/7958 | 36/18723 | 9.87e-04 | 5.71e-03 | 25 |
| GO:00511231 | Liver | HCC | RNA polymerase II preinitiation complex assembly | 17/7958 | 24/18723 | 4.72e-03 | 2.02e-02 | 17 |
| Page: 1 |
| Pathway ID | Tissue | Disease Stage | Description | Gene Ratio | Bg Ratio | pvalue | p.adjust | qvalue | Count |
| Page: 1 |
Top |
Cell-cell communication analysis |
| Identification of potential cell-cell interactions between two cell types and their ligand-receptor pairs for different disease states |
| Ligand | Receptor | LRpair | Pathway | Tissue | Disease Stage |
| Page: 1 |
Top |
Single-cell gene regulatory network inference analysis |
| Find out the significant the regulons (TFs) and the target genes of each regulon across cell types for different disease states |
| TF | Cell Type | Tissue | Disease Stage | Target Gene | RSS | Regulon Activity |
| ∗The dot plots of a searched regulon are shown for all cell subpopulations in each disease state of each tissue based on the regulon specific score inferred using pySCENIC and by calculating the average expression. |
| Page: 1 |
Top |
Somatic mutation of malignant transformation related genes |
| Annotation of somatic variants for genes involved in malignant transformation |
| Hugo Symbol | Variant Class | Variant Classification | dbSNP RS | HGVSc | HGVSp | HGVSp Short | SWISSPROT | BIOTYPE | SIFT | PolyPhen | Tumor Sample Barcode | Tissue | Histology | Sex | Age | Stage | Therapy Types | Drugs | Outcome |
| TAF1L | SNV | Missense_Mutation | novel | c.4252N>T | p.Leu1418Phe | p.L1418F | Q8IZX4 | protein_coding | deleterious(0.02) | benign(0.269) | TCGA-3C-AALI-01 | Breast | breast invasive carcinoma | Female | <65 | I/II | Unspecific | Poly E | Complete Response |
| TAF1L | SNV | Missense_Mutation | c.3403C>G | p.Gln1135Glu | p.Q1135E | Q8IZX4 | protein_coding | tolerated(0.14) | benign(0.017) | TCGA-A1-A0SI-01 | Breast | breast invasive carcinoma | Female | <65 | I/II | Unknown | Unknown | SD | |
| TAF1L | SNV | Missense_Mutation | c.692N>C | p.Leu231Ser | p.L231S | Q8IZX4 | protein_coding | deleterious(0) | benign(0.394) | TCGA-A2-A04W-01 | Breast | breast invasive carcinoma | Female | <65 | I/II | Chemotherapy | cytoxan | SD | |
| TAF1L | SNV | Missense_Mutation | c.1660N>G | p.Leu554Val | p.L554V | Q8IZX4 | protein_coding | tolerated(1) | benign(0.007) | TCGA-A2-A0SY-01 | Breast | breast invasive carcinoma | Female | <65 | III/IV | Hormone Therapy | arimidex | SD | |
| TAF1L | SNV | Missense_Mutation | c.2495N>A | p.Arg832His | p.R832H | Q8IZX4 | protein_coding | deleterious(0) | probably_damaging(1) | TCGA-A8-A08O-01 | Breast | breast invasive carcinoma | Female | <65 | III/IV | Chemotherapy | docetaxel | PD | |
| TAF1L | SNV | Missense_Mutation | novel | c.3533N>T | p.Ser1178Phe | p.S1178F | Q8IZX4 | protein_coding | tolerated(0.13) | possibly_damaging(0.498) | TCGA-AC-A3BB-01 | Breast | breast invasive carcinoma | Female | <65 | III/IV | Chemotherapy | cytoxan | CR |
| TAF1L | SNV | Missense_Mutation | novel | c.3412N>T | p.Arg1138Cys | p.R1138C | Q8IZX4 | protein_coding | tolerated(0.15) | possibly_damaging(0.582) | TCGA-AN-A046-01 | Breast | breast invasive carcinoma | Female | >=65 | I/II | Unknown | Unknown | SD |
| TAF1L | SNV | Missense_Mutation | novel | c.1996G>A | p.Ala666Thr | p.A666T | Q8IZX4 | protein_coding | deleterious(0.01) | possibly_damaging(0.794) | TCGA-AN-A0AK-01 | Breast | breast invasive carcinoma | Female | >=65 | I/II | Unknown | Unknown | SD |
| TAF1L | SNV | Missense_Mutation | c.4249G>A | p.Asp1417Asn | p.D1417N | Q8IZX4 | protein_coding | tolerated(0.09) | benign(0.007) | TCGA-AN-A0FK-01 | Breast | breast invasive carcinoma | Female | >=65 | III/IV | Unknown | Unknown | SD | |
| TAF1L | SNV | Missense_Mutation | novel | c.4909N>G | p.Ile1637Val | p.I1637V | Q8IZX4 | protein_coding | deleterious(0) | possibly_damaging(0.722) | TCGA-AN-A0FN-01 | Breast | breast invasive carcinoma | Female | <65 | I/II | Unknown | Unknown | SD |
| Page: 1 2 3 4 5 6 7 8 9 10 11 12 13 14 15 16 17 18 19 20 21 22 23 24 25 26 27 28 29 30 31 32 33 34 35 36 37 38 39 40 |
Top |
Related drugs of malignant transformation related genes |
| Identification of chemicals and drugs interact with genes involved in malignant transfromation |
| (DGIdb 4.0) |
| Entrez ID | Symbol | Category | Interaction Types | Drug Claim Name | Drug Name | PMIDs |
| Page: 1 |

Copyright 2023-Present -The University of Texas Health Science Center at Houston |