
|
|||||
|
 | |
| |
| |
| |
| |
| |
|
Gene: TAF1D |
Gene summary for TAF1D |
| Gene information | Species | Human | Gene symbol | TAF1D | Gene ID | 79101 |
| Gene name | TATA-box binding protein associated factor, RNA polymerase I subunit D | |
| Gene Alias | JOSD3 | |
| Cytomap | 11q21 | |
| Gene Type | protein-coding | GO ID | GO:0006139 | UniProtAcc | A0A024R3A9 |
Top |
Malignant transformation analysis |
| Identification of the aberrant gene expression in precancerous and cancerous lesions by comparing the gene expression of stem-like cells in diseased tissues with normal stem cells |
| Entrez ID | Symbol | Replicates | Species | Organ | Tissue | Adj P-value | Log2FC | Malignancy |
| 79101 | TAF1D | GSM4909286 | Human | Breast | IDC | 5.31e-05 | 7.65e-02 | 0.1081 |
| 79101 | TAF1D | GSM4909293 | Human | Breast | IDC | 1.09e-02 | -1.07e-01 | 0.1581 |
| 79101 | TAF1D | GSM4909294 | Human | Breast | IDC | 2.82e-10 | -3.28e-01 | 0.2022 |
| 79101 | TAF1D | GSM4909296 | Human | Breast | IDC | 6.89e-13 | -4.14e-01 | 0.1524 |
| 79101 | TAF1D | GSM4909297 | Human | Breast | IDC | 4.02e-17 | -4.78e-01 | 0.1517 |
| 79101 | TAF1D | GSM4909298 | Human | Breast | IDC | 8.87e-04 | -3.07e-01 | 0.1551 |
| 79101 | TAF1D | GSM4909301 | Human | Breast | IDC | 1.56e-03 | -2.95e-01 | 0.1577 |
| 79101 | TAF1D | GSM4909306 | Human | Breast | IDC | 1.04e-02 | -3.67e-01 | 0.1564 |
| 79101 | TAF1D | GSM4909307 | Human | Breast | IDC | 1.41e-05 | -3.71e-01 | 0.1569 |
| 79101 | TAF1D | GSM4909308 | Human | Breast | IDC | 1.83e-06 | -4.02e-01 | 0.158 |
| 79101 | TAF1D | GSM4909311 | Human | Breast | IDC | 2.31e-37 | -6.01e-01 | 0.1534 |
| 79101 | TAF1D | GSM4909312 | Human | Breast | IDC | 8.05e-23 | -5.42e-01 | 0.1552 |
| 79101 | TAF1D | GSM4909313 | Human | Breast | IDC | 2.74e-06 | -4.13e-01 | 0.0391 |
| 79101 | TAF1D | GSM4909316 | Human | Breast | IDC | 7.91e-04 | -5.22e-01 | 0.21 |
| 79101 | TAF1D | GSM4909319 | Human | Breast | IDC | 1.54e-40 | -5.86e-01 | 0.1563 |
| 79101 | TAF1D | GSM4909320 | Human | Breast | IDC | 1.63e-08 | 5.73e-01 | 0.1575 |
| 79101 | TAF1D | GSM4909321 | Human | Breast | IDC | 1.68e-30 | 5.15e-01 | 0.1559 |
| 79101 | TAF1D | brca2 | Human | Breast | Precancer | 2.32e-02 | -2.23e-01 | -0.024 |
| 79101 | TAF1D | NCCBC14 | Human | Breast | DCIS | 2.40e-09 | -3.89e-01 | 0.2021 |
| 79101 | TAF1D | NCCBC5 | Human | Breast | DCIS | 1.09e-08 | -3.68e-01 | 0.2046 |
| Page: 1 2 3 4 5 6 7 8 9 10 11 12 |
| Tissue | Expression Dynamics | Abbreviation |
| Breast | 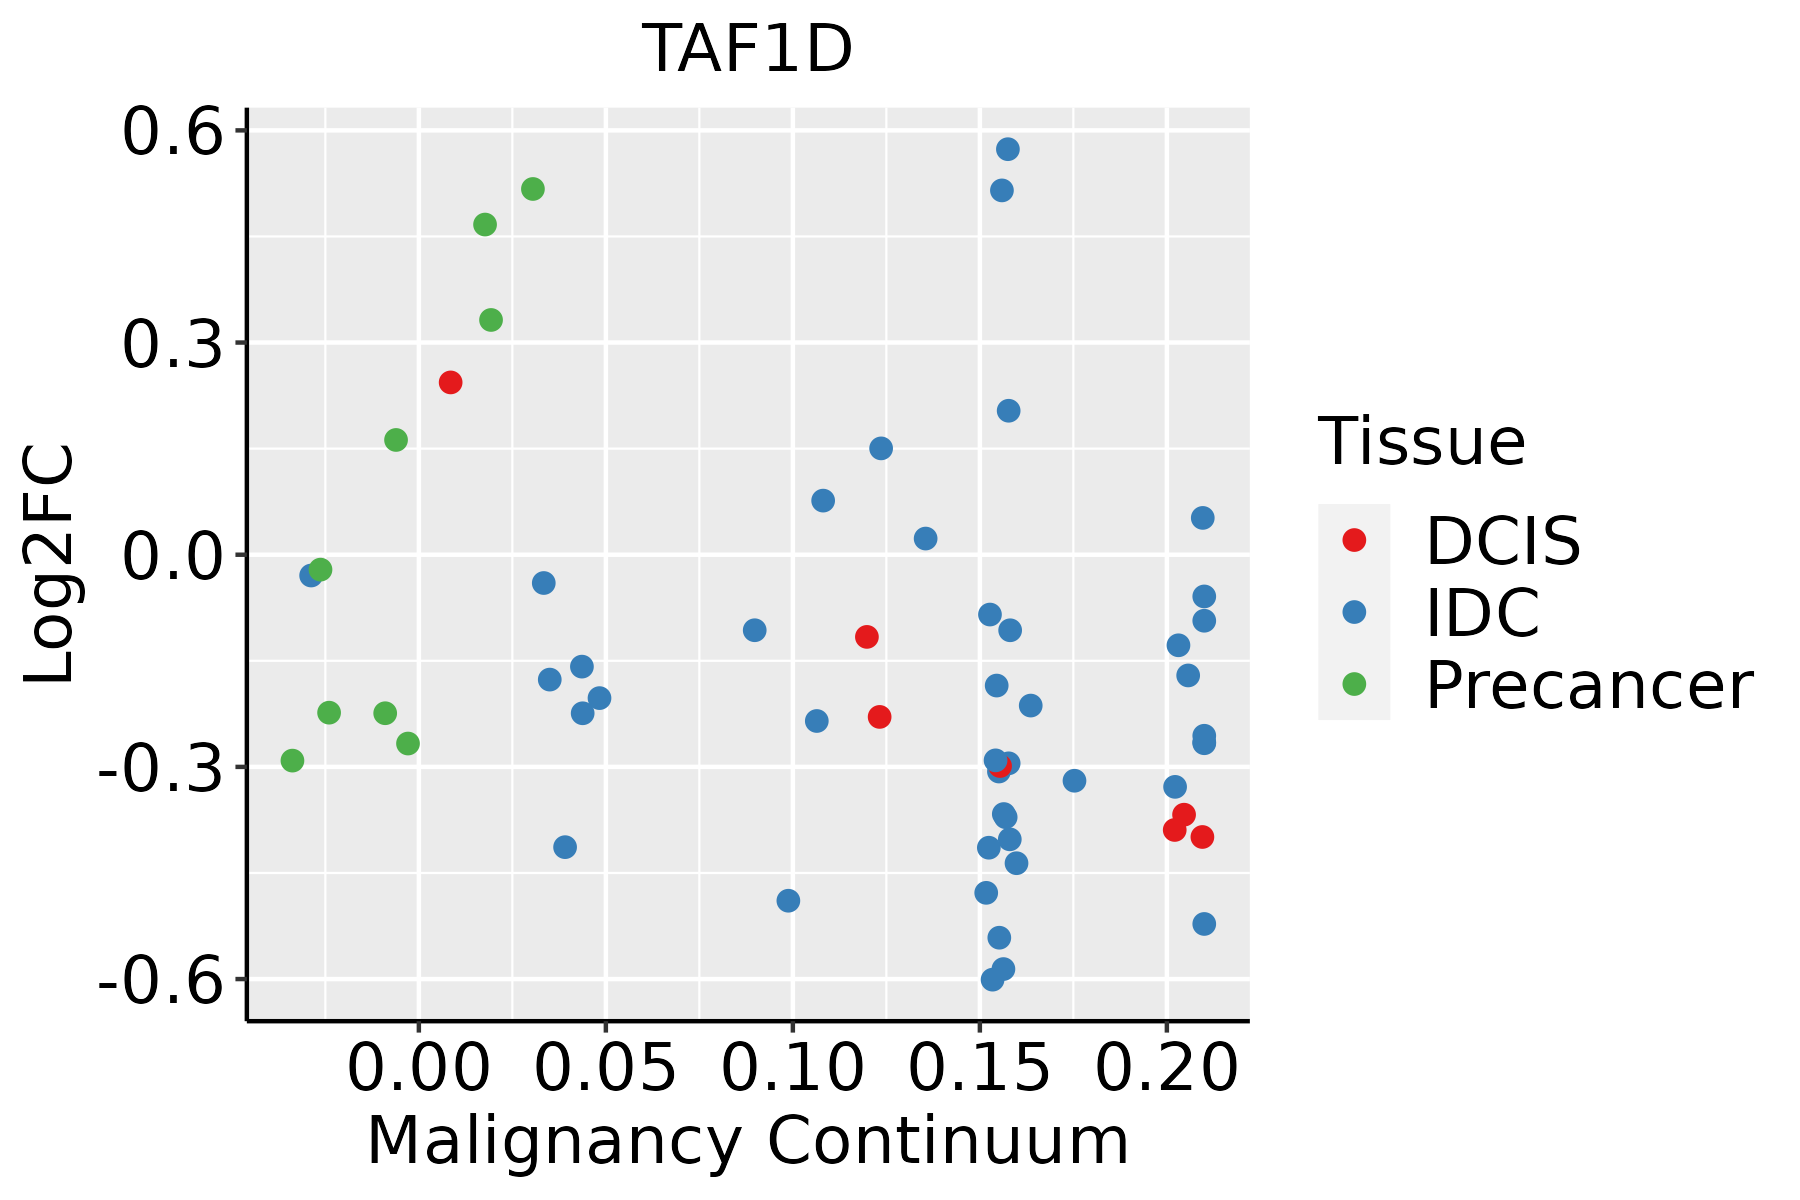 | IDC: Invasive ductal carcinoma |
| DCIS: Ductal carcinoma in situ | ||
| Precancer(BRCA1-mut): Precancerous lesion from BRCA1 mutation carriers | ||
| Colorectum (GSE201348) |  | FAP: Familial adenomatous polyposis |
| CRC: Colorectal cancer | ||
| Colorectum (HTA11) | 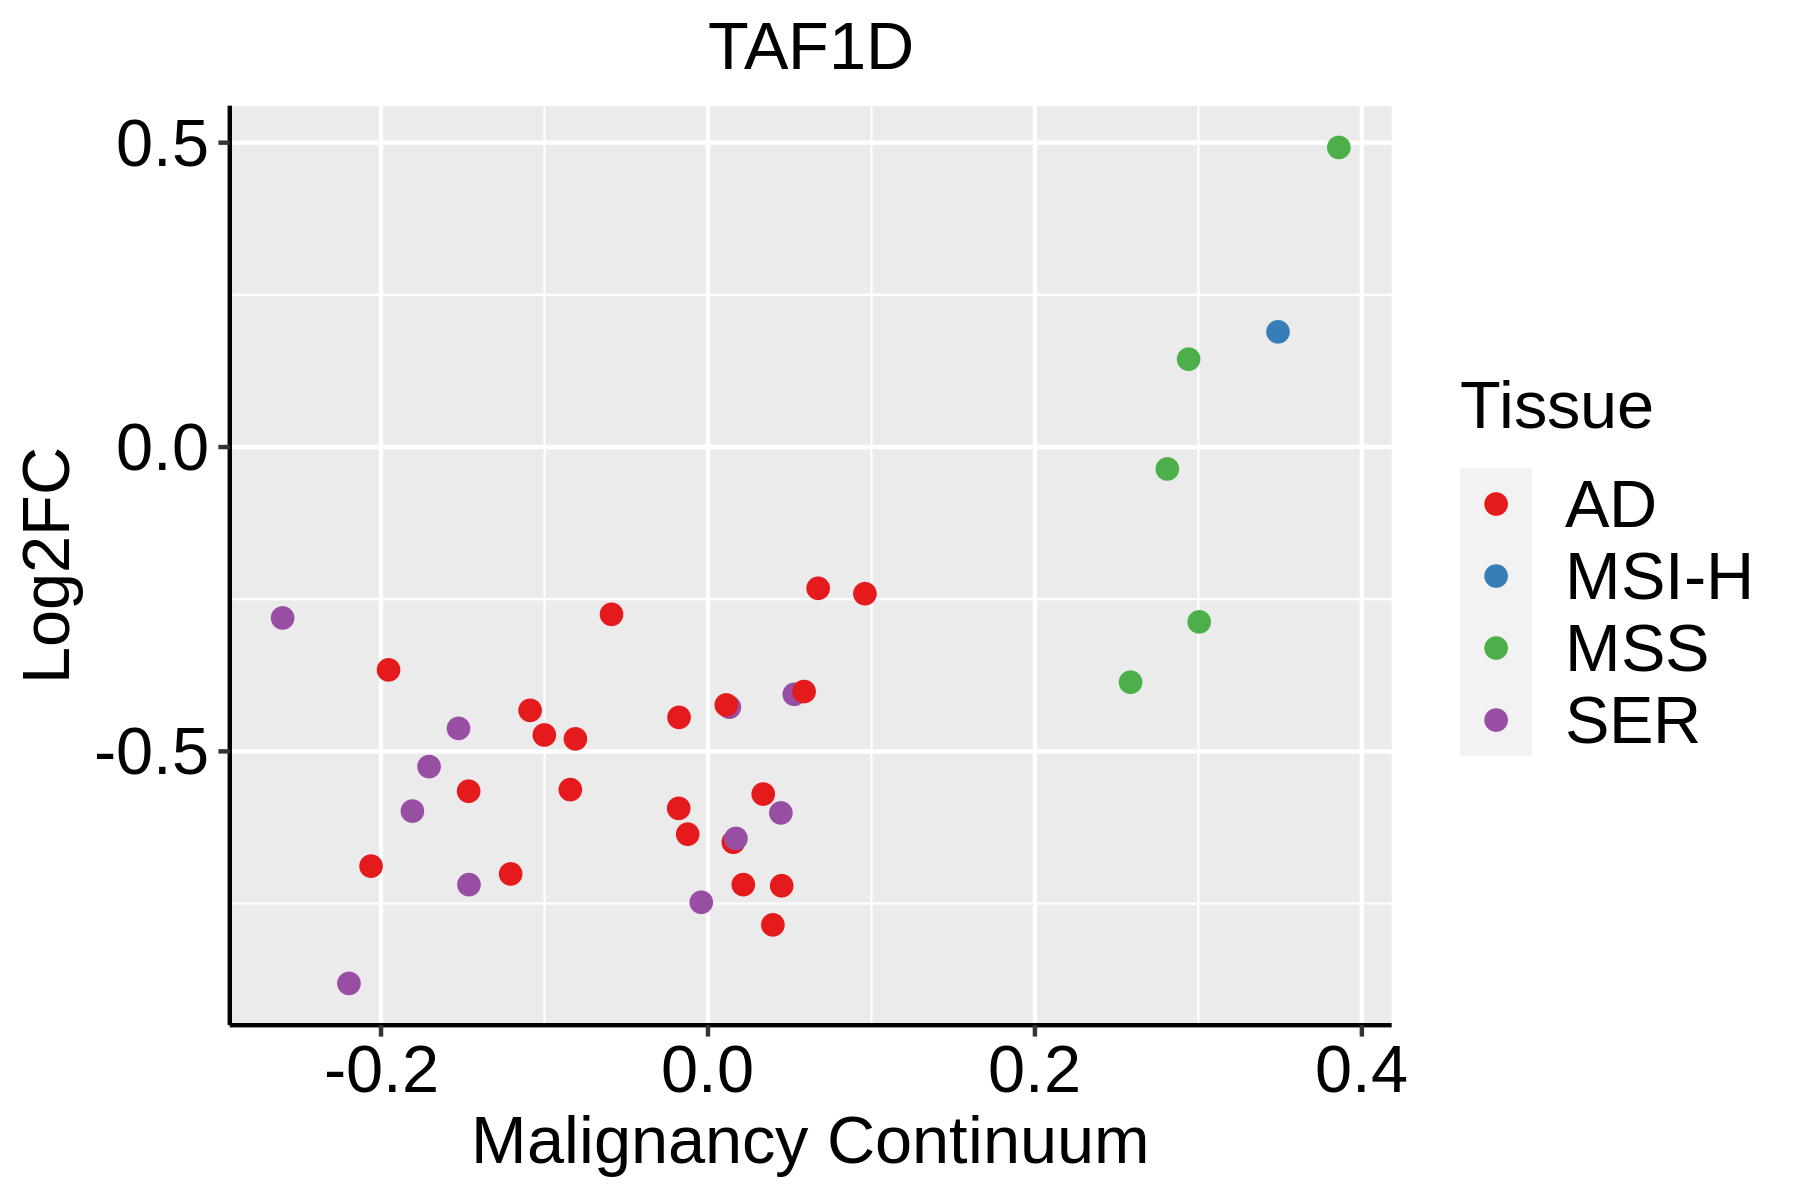 | AD: Adenomas |
| SER: Sessile serrated lesions | ||
| MSI-H: Microsatellite-high colorectal cancer | ||
| MSS: Microsatellite stable colorectal cancer | ||
| Endometrium | 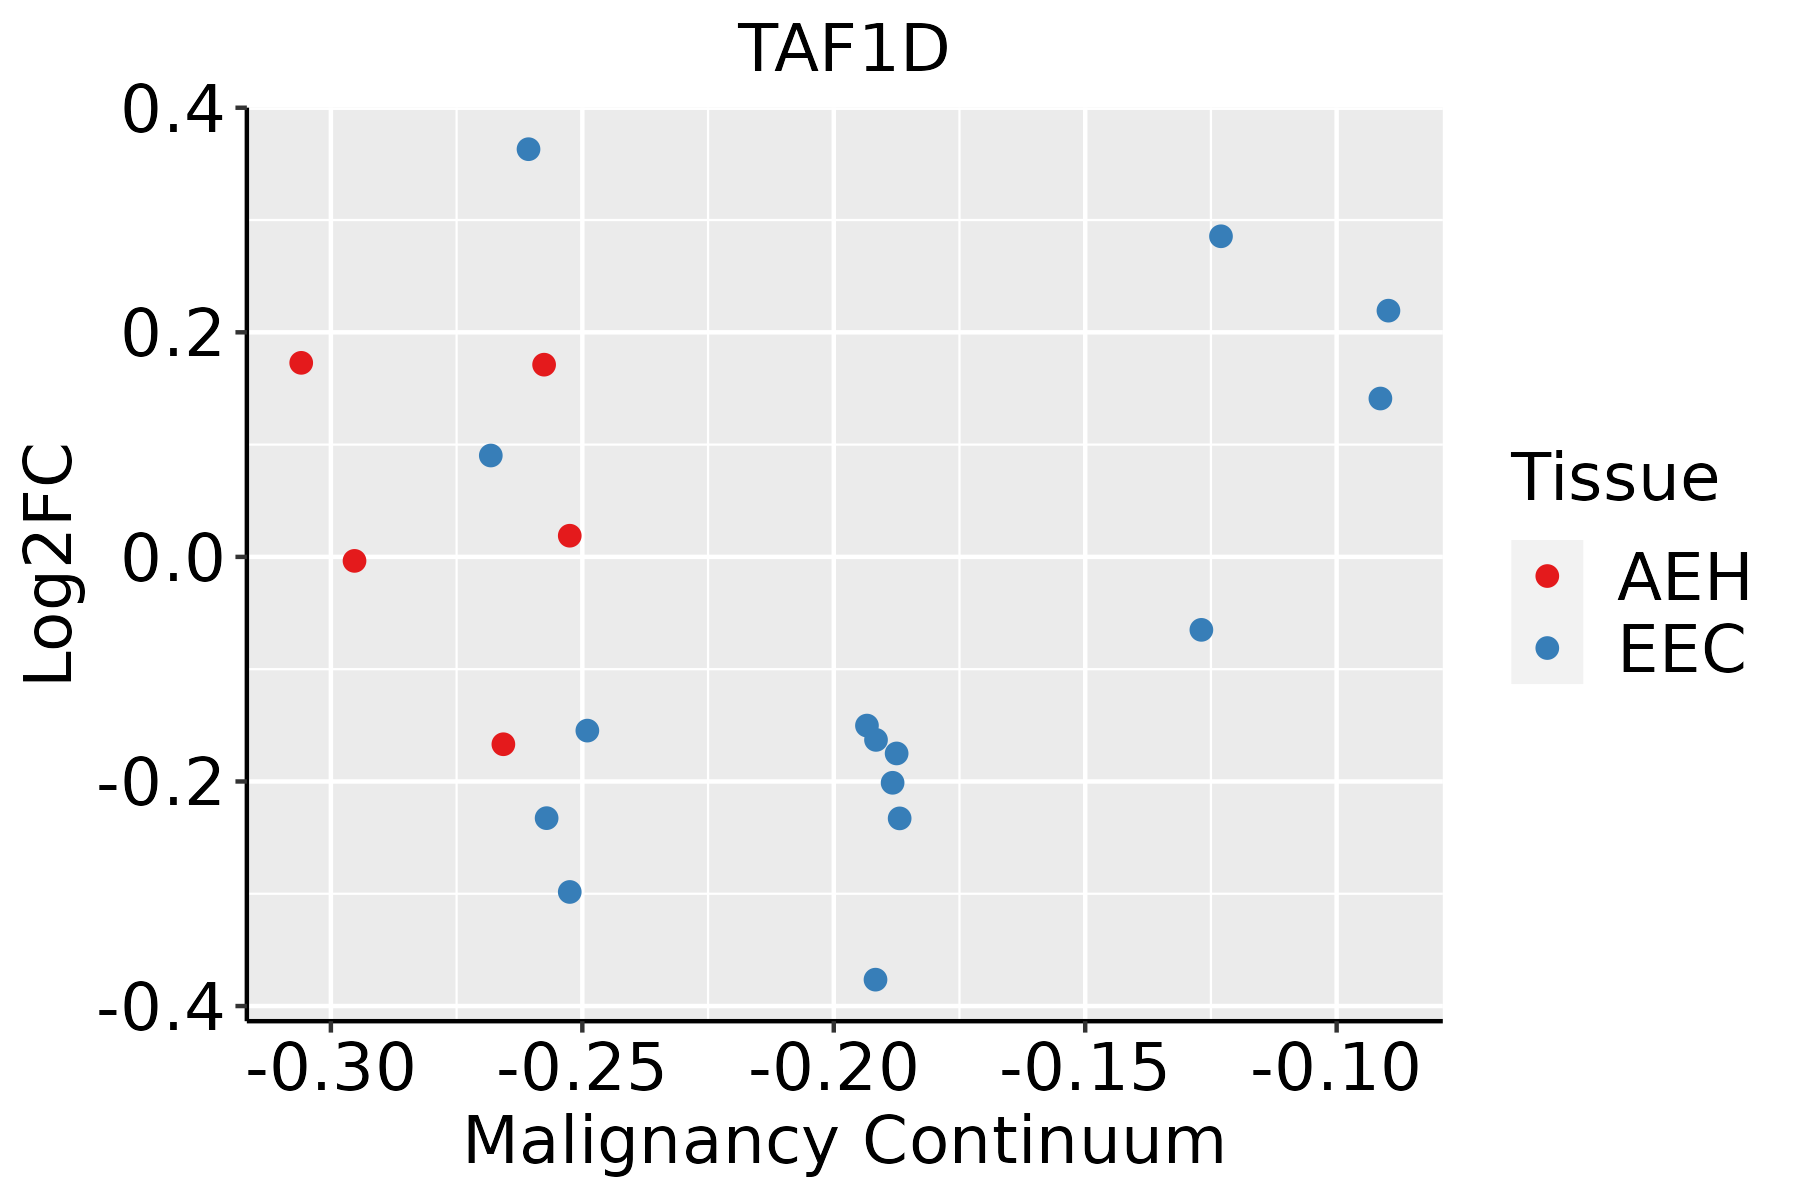 | AEH: Atypical endometrial hyperplasia |
| EEC: Endometrioid Cancer | ||
| Esophagus | 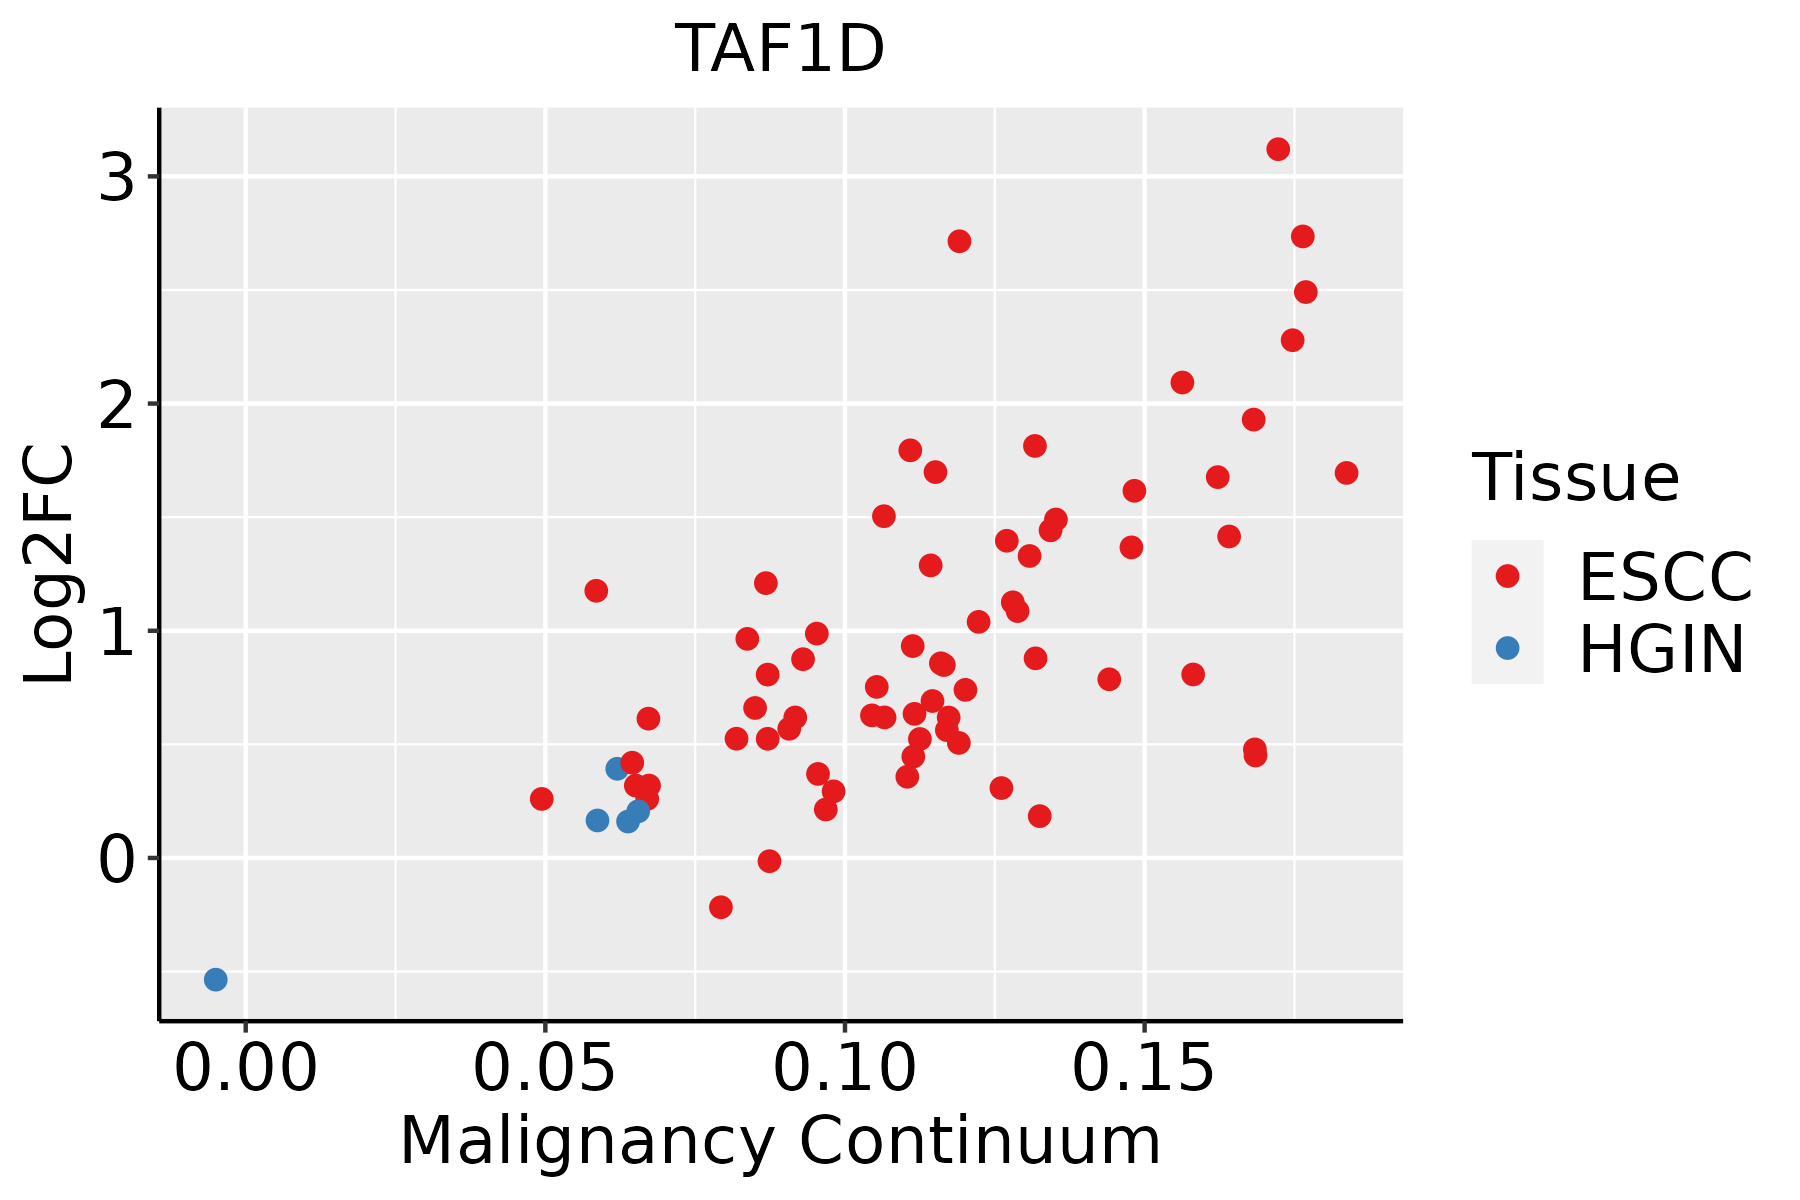 | ESCC: Esophageal squamous cell carcinoma |
| HGIN: High-grade intraepithelial neoplasias | ||
| LGIN: Low-grade intraepithelial neoplasias | ||
| Liver | 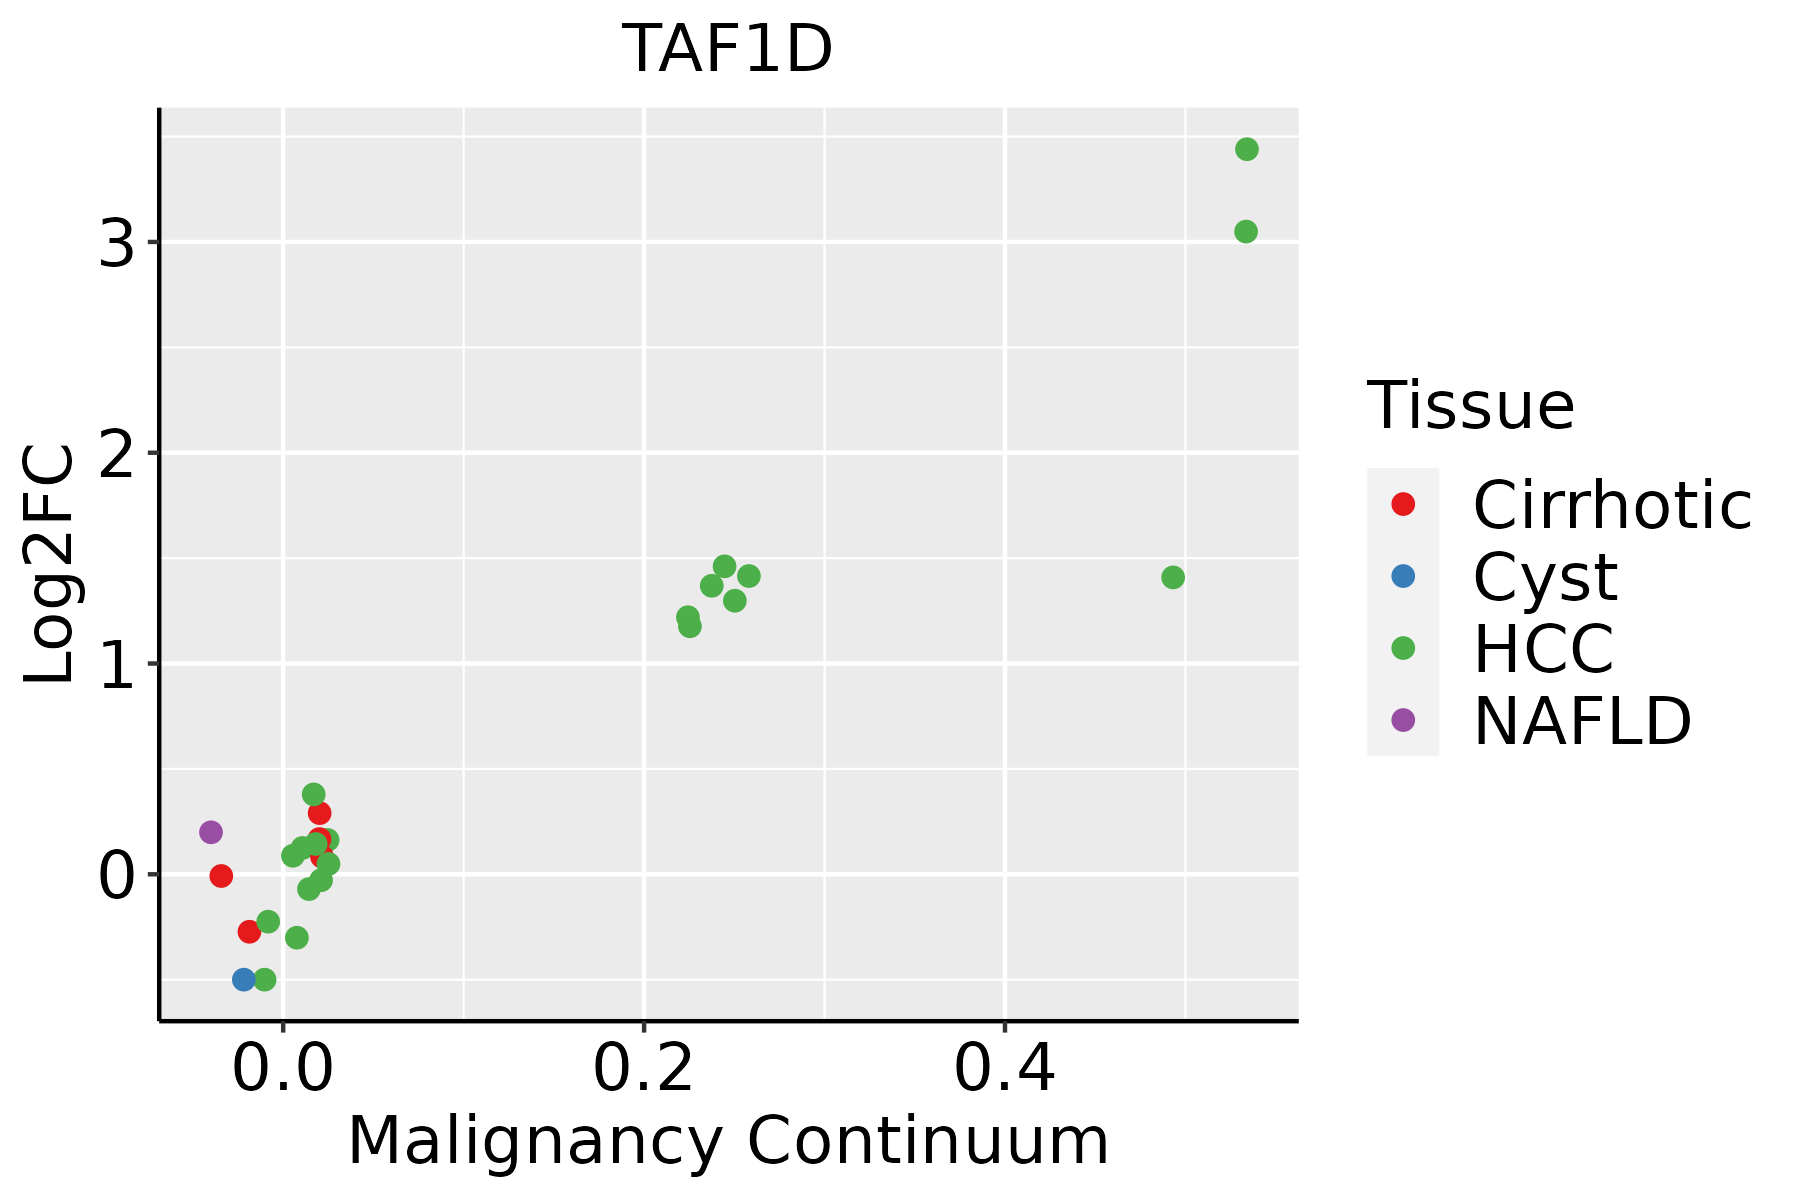 | HCC: Hepatocellular carcinoma |
| NAFLD: Non-alcoholic fatty liver disease | ||
| Oral Cavity | 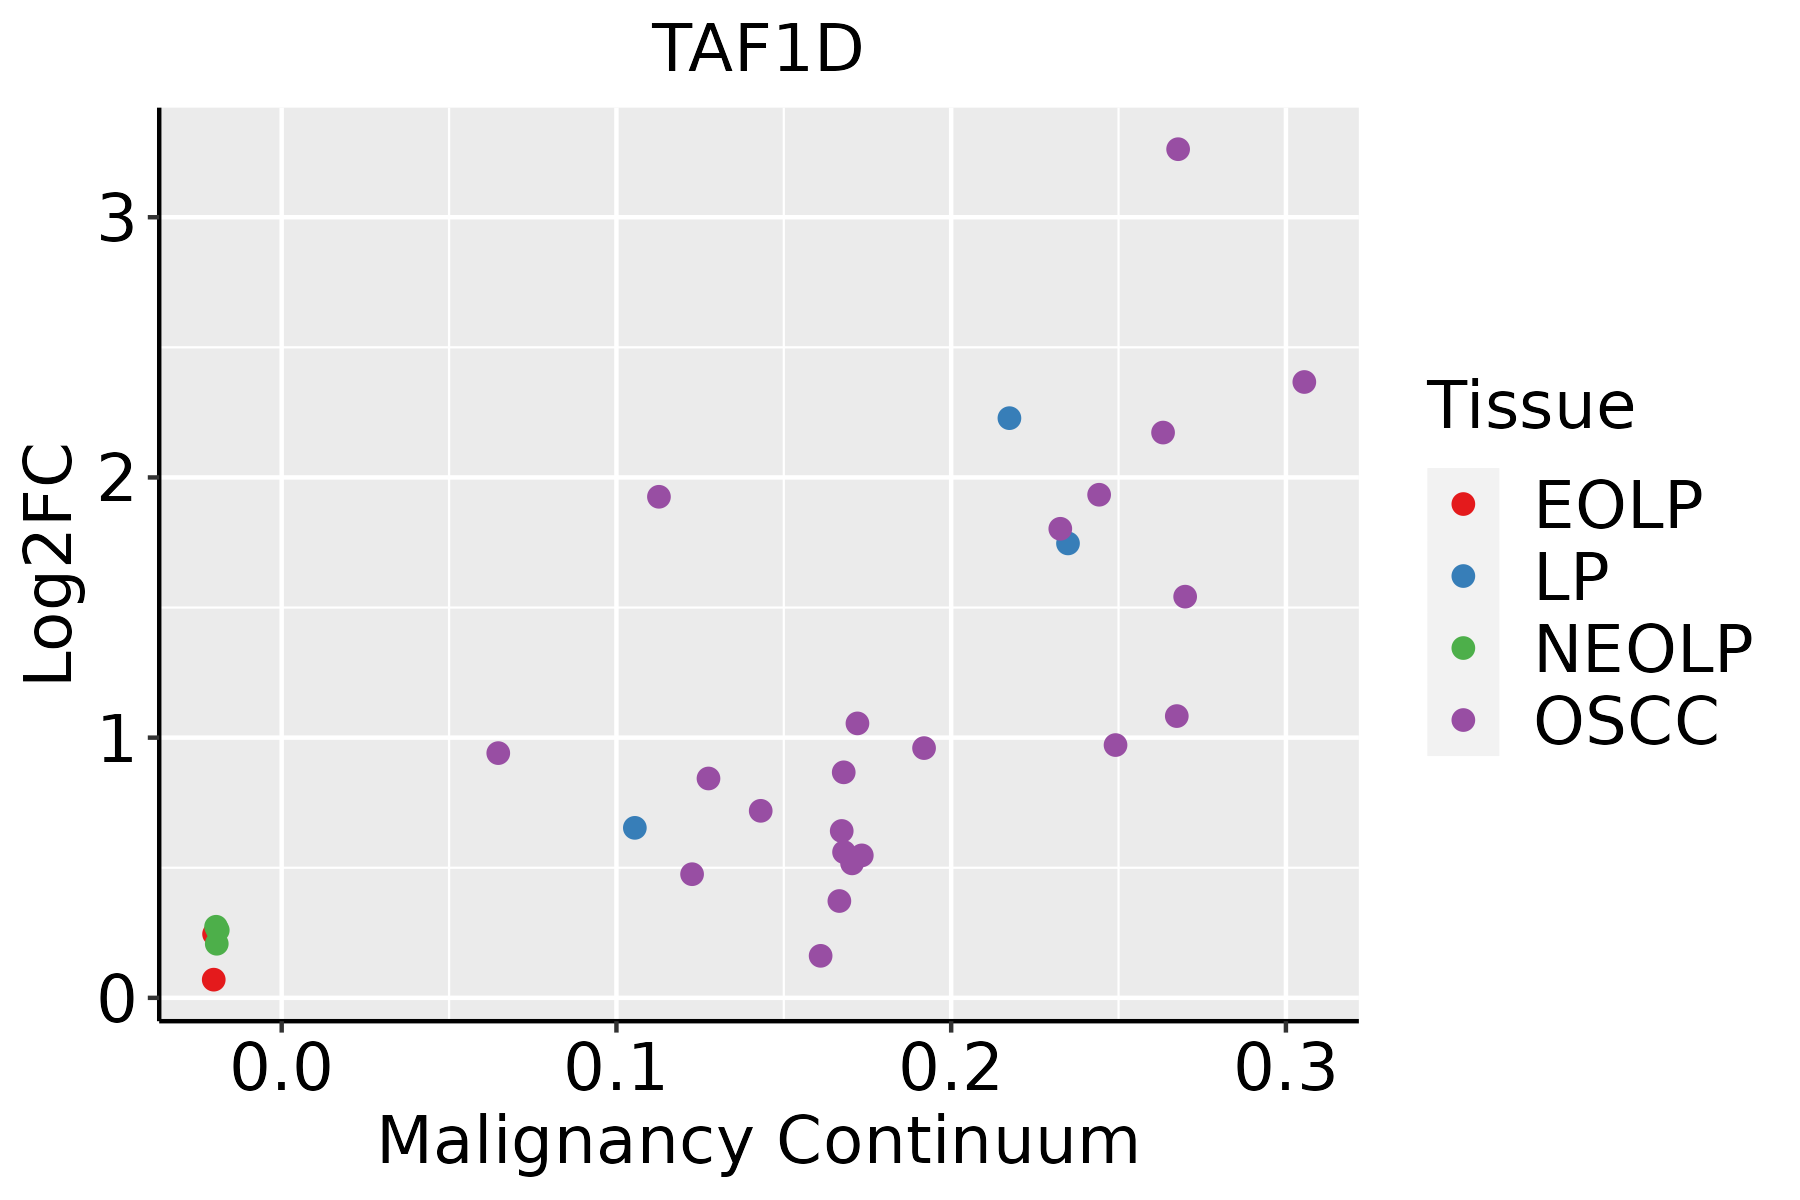 | EOLP: Erosive Oral lichen planus |
| LP: leukoplakia | ||
| NEOLP: Non-erosive oral lichen planus | ||
| OSCC: Oral squamous cell carcinoma | ||
| Prostate | 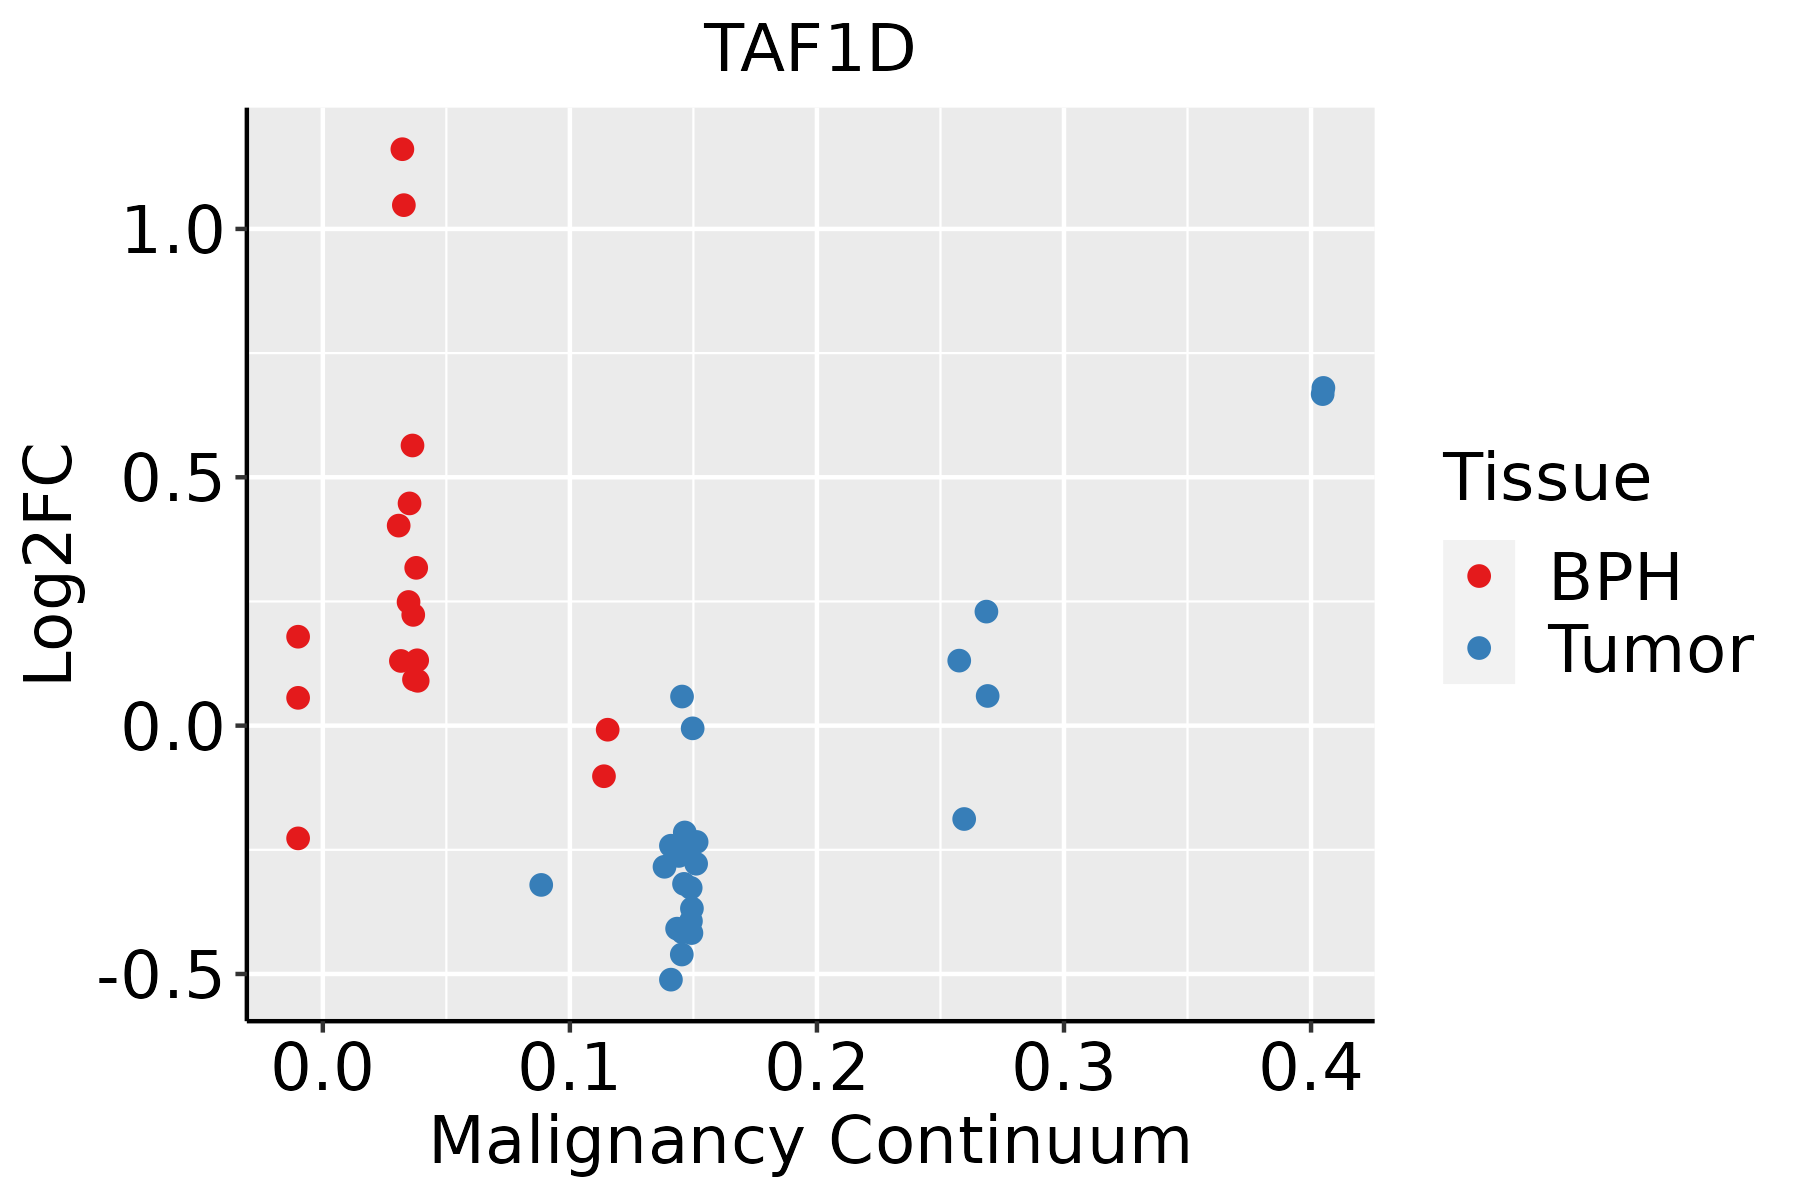 | BPH: Benign Prostatic Hyperplasia |
| Skin |  | AK: Actinic keratosis |
| cSCC: Cutaneous squamous cell carcinoma | ||
| SCCIS:squamous cell carcinoma in situ | ||
| Thyroid | 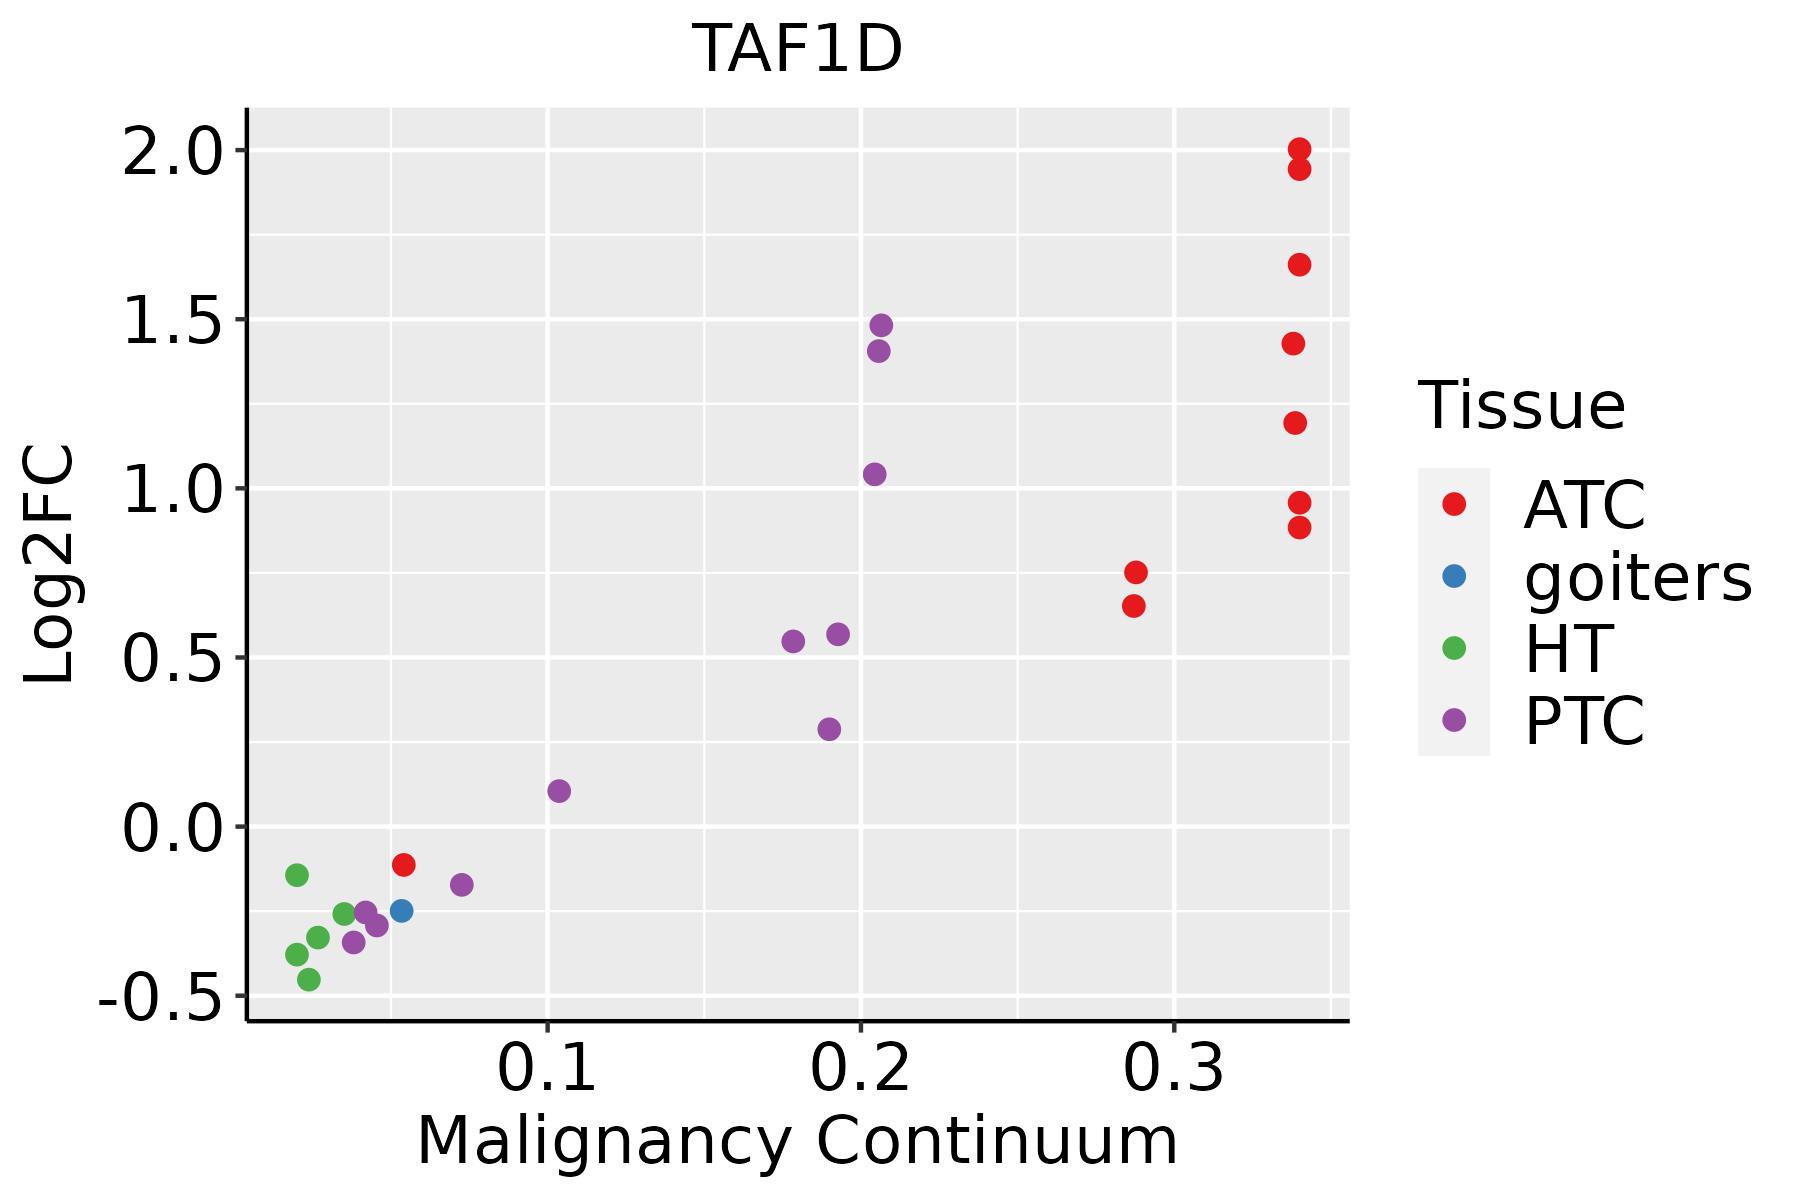 | ATC: Anaplastic thyroid cancer |
| HT: Hashimoto's thyroiditis | ||
| PTC: Papillary thyroid cancer |
| ∗log2FC in expression of this searched gene in stem-like cells from each diseased tissue sample relative to stem-like cells in normal samples in each tissue plotted against the malignancy continuum. Samples are colored based on if they are from different disease stage. |
Top |
Malignant transformation related pathway analysis |
| Find out the enriched GO biological processes and KEGG pathways involved in transition from healthy to precancer to cancer |
| Tissue | Disease Stage | Enriched GO biological Processes |
| Colorectum | AD |  |
| Colorectum | SER |  |
| Colorectum | MSS |  |
| Colorectum | MSI-H |  |
| Colorectum | FAP |  |
| ∗Top 15 enriched GO BP terms are showed in the bar plot of each disease state in each tissue. Each row represents a significant GO biological process which is colored according to the -log10(p.adjust). |
| Page: 1 2 3 4 5 6 7 8 9 |
| GO ID | Tissue | Disease Stage | Description | Gene Ratio | Bg Ratio | pvalue | p.adjust | Count |
| Page: 1 |
| Pathway ID | Tissue | Disease Stage | Description | Gene Ratio | Bg Ratio | pvalue | p.adjust | qvalue | Count |
| Page: 1 |
Top |
Cell-cell communication analysis |
| Identification of potential cell-cell interactions between two cell types and their ligand-receptor pairs for different disease states |
| Ligand | Receptor | LRpair | Pathway | Tissue | Disease Stage |
| Page: 1 |
Top |
Single-cell gene regulatory network inference analysis |
| Find out the significant the regulons (TFs) and the target genes of each regulon across cell types for different disease states |
| TF | Cell Type | Tissue | Disease Stage | Target Gene | RSS | Regulon Activity |
| ∗The dot plots of a searched regulon are shown for all cell subpopulations in each disease state of each tissue based on the regulon specific score inferred using pySCENIC and by calculating the average expression. |
| Page: 1 |
Top |
Somatic mutation of malignant transformation related genes |
| Annotation of somatic variants for genes involved in malignant transformation |
| Hugo Symbol | Variant Class | Variant Classification | dbSNP RS | HGVSc | HGVSp | HGVSp Short | SWISSPROT | BIOTYPE | SIFT | PolyPhen | Tumor Sample Barcode | Tissue | Histology | Sex | Age | Stage | Therapy Types | Drugs | Outcome |
| TAF1D | SNV | Missense_Mutation | novel | c.756N>T | p.Glu252Asp | p.E252D | Q9H5J8 | protein_coding | tolerated_low_confidence(0.07) | benign(0.275) | TCGA-2W-A8YY-01 | Cervix | cervical & endocervical cancer | Female | <65 | I/II | Chemotherapy | cisplatin | CR |
| TAF1D | SNV | Missense_Mutation | novel | c.339N>C | p.Arg113Ser | p.R113S | Q9H5J8 | protein_coding | deleterious(0.01) | benign(0.163) | TCGA-2W-A8YY-01 | Cervix | cervical & endocervical cancer | Female | <65 | I/II | Chemotherapy | cisplatin | CR |
| TAF1D | SNV | Missense_Mutation | rs200414618 | c.430G>A | p.Ala144Thr | p.A144T | Q9H5J8 | protein_coding | deleterious(0.03) | benign(0.003) | TCGA-ZJ-AB0I-01 | Cervix | cervical & endocervical cancer | Female | <65 | I/II | Unknown | Unknown | SD |
| TAF1D | SNV | Missense_Mutation | novel | c.445A>T | p.Ile149Phe | p.I149F | Q9H5J8 | protein_coding | deleterious(0) | probably_damaging(0.974) | TCGA-AA-3811-01 | Colorectum | colon adenocarcinoma | Female | >=65 | III/IV | Unknown | Unknown | PD |
| TAF1D | SNV | Missense_Mutation | c.369G>T | p.Lys123Asn | p.K123N | Q9H5J8 | protein_coding | deleterious(0.03) | possibly_damaging(0.812) | TCGA-AA-A00N-01 | Colorectum | colon adenocarcinoma | Male | >=65 | I/II | Unknown | Unknown | PD | |
| TAF1D | SNV | Missense_Mutation | novel | c.643N>T | p.Asp215Tyr | p.D215Y | Q9H5J8 | protein_coding | deleterious(0) | benign(0.243) | TCGA-A5-A0G2-01 | Endometrium | uterine corpus endometrioid carcinoma | Female | <65 | III/IV | Unknown | Unknown | SD |
| TAF1D | SNV | Missense_Mutation | c.34N>A | p.Val12Met | p.V12M | Q9H5J8 | protein_coding | tolerated(0.53) | benign(0.386) | TCGA-AP-A059-01 | Endometrium | uterine corpus endometrioid carcinoma | Female | >=65 | I/II | Unknown | Unknown | SD | |
| TAF1D | SNV | Missense_Mutation | novel | c.54A>C | p.Glu18Asp | p.E18D | Q9H5J8 | protein_coding | tolerated(0.39) | benign(0.015) | TCGA-AX-A06F-01 | Endometrium | uterine corpus endometrioid carcinoma | Female | <65 | III/IV | Chemotherapy | carboplatin | SD |
| TAF1D | SNV | Missense_Mutation | c.269G>T | p.Arg90Ile | p.R90I | Q9H5J8 | protein_coding | deleterious(0) | benign(0.061) | TCGA-B5-A0JY-01 | Endometrium | uterine corpus endometrioid carcinoma | Female | <65 | III/IV | Chemotherapy | doxorubicin | SD | |
| TAF1D | SNV | Missense_Mutation | novel | c.823N>T | p.Gly275Cys | p.G275C | Q9H5J8 | protein_coding | deleterious_low_confidence(0.03) | possibly_damaging(0.821) | TCGA-B5-A11E-01 | Endometrium | uterine corpus endometrioid carcinoma | Female | <65 | I/II | Unknown | Unknown | SD |
| Page: 1 2 3 4 |
Top |
Related drugs of malignant transformation related genes |
| Identification of chemicals and drugs interact with genes involved in malignant transfromation |
| (DGIdb 4.0) |
| Entrez ID | Symbol | Category | Interaction Types | Drug Claim Name | Drug Name | PMIDs |
| Page: 1 |

Copyright 2023-Present -The University of Texas Health Science Center at Houston |