
|
|||||
|
 | |
| |
| |
| |
| |
| |
|
Gene: TAF1C |
Gene summary for TAF1C |
| Gene information | Species | Human | Gene symbol | TAF1C | Gene ID | 9013 |
| Gene name | TATA-box binding protein associated factor, RNA polymerase I subunit C | |
| Gene Alias | MGC:39976 | |
| Cytomap | 16q24.1 | |
| Gene Type | protein-coding | GO ID | GO:0001188 | UniProtAcc | Q15572 |
Top |
Malignant transformation analysis |
| Identification of the aberrant gene expression in precancerous and cancerous lesions by comparing the gene expression of stem-like cells in diseased tissues with normal stem cells |
| Entrez ID | Symbol | Replicates | Species | Organ | Tissue | Adj P-value | Log2FC | Malignancy |
| 9013 | TAF1C | LZE4T | Human | Esophagus | ESCC | 2.73e-03 | 8.48e-02 | 0.0811 |
| 9013 | TAF1C | LZE7T | Human | Esophagus | ESCC | 1.49e-09 | 5.42e-01 | 0.0667 |
| 9013 | TAF1C | LZE8T | Human | Esophagus | ESCC | 8.33e-05 | 1.20e-01 | 0.067 |
| 9013 | TAF1C | LZE21D1 | Human | Esophagus | HGIN | 5.36e-04 | 3.89e-01 | 0.0632 |
| 9013 | TAF1C | LZE24T | Human | Esophagus | ESCC | 5.13e-09 | 1.97e-01 | 0.0596 |
| 9013 | TAF1C | LZE21T | Human | Esophagus | ESCC | 3.21e-03 | 1.71e-01 | 0.0655 |
| 9013 | TAF1C | P1T-E | Human | Esophagus | ESCC | 1.30e-11 | 4.27e-01 | 0.0875 |
| 9013 | TAF1C | P2T-E | Human | Esophagus | ESCC | 1.10e-03 | 9.57e-02 | 0.1177 |
| 9013 | TAF1C | P4T-E | Human | Esophagus | ESCC | 2.20e-03 | 1.07e-01 | 0.1323 |
| 9013 | TAF1C | P5T-E | Human | Esophagus | ESCC | 9.13e-04 | 5.76e-02 | 0.1327 |
| 9013 | TAF1C | P8T-E | Human | Esophagus | ESCC | 7.31e-19 | 2.41e-01 | 0.0889 |
| 9013 | TAF1C | P9T-E | Human | Esophagus | ESCC | 1.91e-05 | 6.51e-02 | 0.1131 |
| 9013 | TAF1C | P10T-E | Human | Esophagus | ESCC | 2.71e-09 | 1.32e-01 | 0.116 |
| 9013 | TAF1C | P11T-E | Human | Esophagus | ESCC | 7.53e-06 | 3.27e-01 | 0.1426 |
| 9013 | TAF1C | P12T-E | Human | Esophagus | ESCC | 3.48e-15 | 1.54e-01 | 0.1122 |
| 9013 | TAF1C | P15T-E | Human | Esophagus | ESCC | 8.31e-19 | 1.56e-01 | 0.1149 |
| 9013 | TAF1C | P16T-E | Human | Esophagus | ESCC | 5.05e-06 | 1.27e-01 | 0.1153 |
| 9013 | TAF1C | P20T-E | Human | Esophagus | ESCC | 1.95e-08 | 1.60e-01 | 0.1124 |
| 9013 | TAF1C | P21T-E | Human | Esophagus | ESCC | 2.25e-13 | 1.37e-01 | 0.1617 |
| 9013 | TAF1C | P22T-E | Human | Esophagus | ESCC | 1.99e-10 | 1.62e-01 | 0.1236 |
| Page: 1 2 3 |
| Tissue | Expression Dynamics | Abbreviation |
| Esophagus | 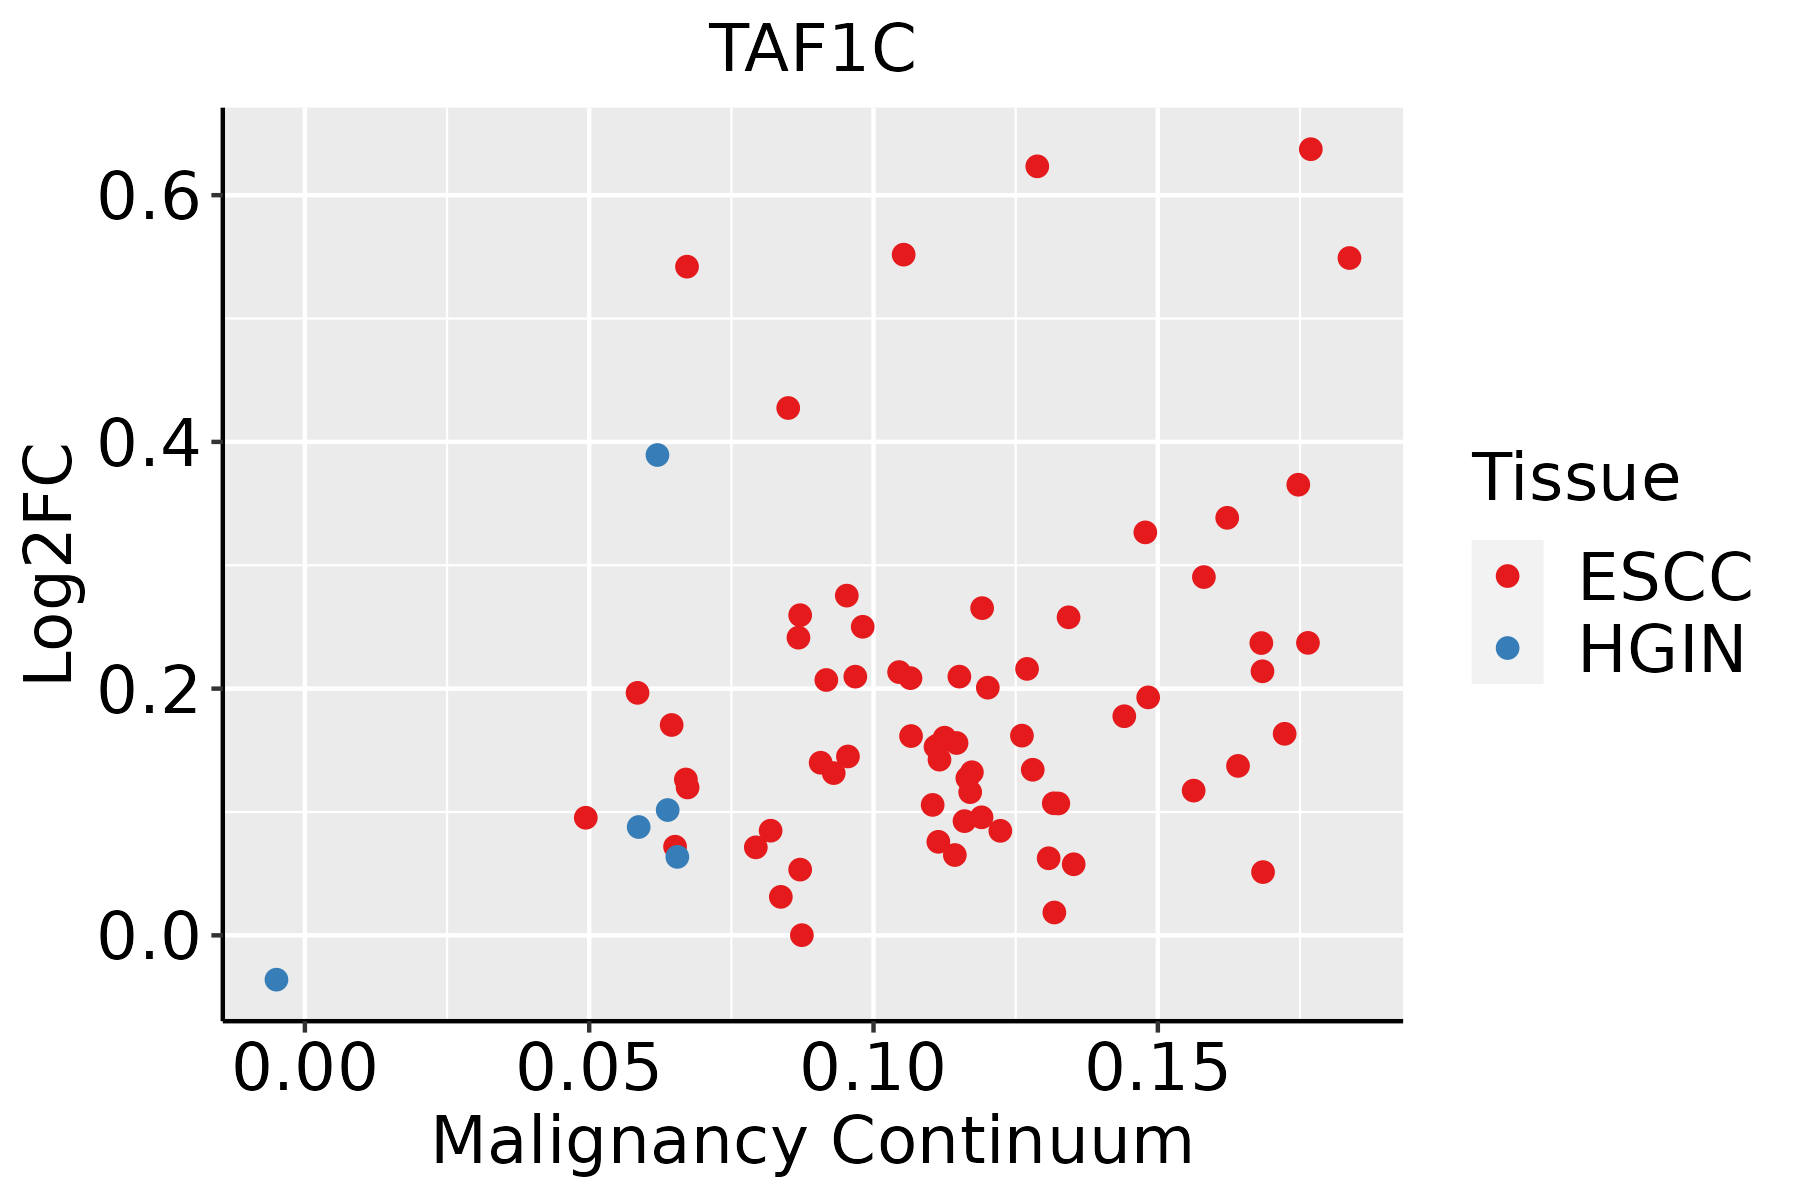 | ESCC: Esophageal squamous cell carcinoma |
| HGIN: High-grade intraepithelial neoplasias | ||
| LGIN: Low-grade intraepithelial neoplasias |
| ∗log2FC in expression of this searched gene in stem-like cells from each diseased tissue sample relative to stem-like cells in normal samples in each tissue plotted against the malignancy continuum. Samples are colored based on if they are from different disease stage. |
Top |
Malignant transformation related pathway analysis |
| Find out the enriched GO biological processes and KEGG pathways involved in transition from healthy to precancer to cancer |
| Tissue | Disease Stage | Enriched GO biological Processes |
| Colorectum | AD |  |
| Colorectum | SER |  |
| Colorectum | MSS |  |
| Colorectum | MSI-H |  |
| Colorectum | FAP |  |
| ∗Top 15 enriched GO BP terms are showed in the bar plot of each disease state in each tissue. Each row represents a significant GO biological process which is colored according to the -log10(p.adjust). |
| Page: 1 2 3 4 5 6 7 8 9 |
| GO ID | Tissue | Disease Stage | Description | Gene Ratio | Bg Ratio | pvalue | p.adjust | Count |
| GO:00063523 | Esophagus | HGIN | DNA-templated transcription, initiation | 30/2587 | 130/18723 | 2.86e-03 | 2.79e-02 | 30 |
| GO:000635211 | Esophagus | ESCC | DNA-templated transcription, initiation | 86/8552 | 130/18723 | 1.88e-06 | 2.19e-05 | 86 |
| GO:00063602 | Esophagus | ESCC | transcription by RNA polymerase I | 42/8552 | 55/18723 | 3.41e-06 | 3.78e-05 | 42 |
| GO:00708973 | Esophagus | ESCC | transcription preinitiation complex assembly | 30/8552 | 36/18723 | 3.60e-06 | 3.95e-05 | 30 |
| GO:00063611 | Esophagus | ESCC | transcription initiation from RNA polymerase I promoter | 11/8552 | 13/18723 | 4.76e-03 | 1.85e-02 | 11 |
| Page: 1 |
| Pathway ID | Tissue | Disease Stage | Description | Gene Ratio | Bg Ratio | pvalue | p.adjust | qvalue | Count |
| Page: 1 |
Top |
Cell-cell communication analysis |
| Identification of potential cell-cell interactions between two cell types and their ligand-receptor pairs for different disease states |
| Ligand | Receptor | LRpair | Pathway | Tissue | Disease Stage |
| Page: 1 |
Top |
Single-cell gene regulatory network inference analysis |
| Find out the significant the regulons (TFs) and the target genes of each regulon across cell types for different disease states |
| TF | Cell Type | Tissue | Disease Stage | Target Gene | RSS | Regulon Activity |
| ∗The dot plots of a searched regulon are shown for all cell subpopulations in each disease state of each tissue based on the regulon specific score inferred using pySCENIC and by calculating the average expression. |
| Page: 1 |
Top |
Somatic mutation of malignant transformation related genes |
| Annotation of somatic variants for genes involved in malignant transformation |
| Hugo Symbol | Variant Class | Variant Classification | dbSNP RS | HGVSc | HGVSp | HGVSp Short | SWISSPROT | BIOTYPE | SIFT | PolyPhen | Tumor Sample Barcode | Tissue | Histology | Sex | Age | Stage | Therapy Types | Drugs | Outcome |
| TAF1C | SNV | Missense_Mutation | c.454C>A | p.Gln152Lys | p.Q152K | Q15572 | protein_coding | tolerated(0.12) | benign(0.121) | TCGA-A2-A25A-01 | Breast | breast invasive carcinoma | Female | <65 | I/II | Unspecific | Cytoxan | SD | |
| TAF1C | SNV | Missense_Mutation | c.1486N>T | p.Pro496Ser | p.P496S | Q15572 | protein_coding | tolerated(0.14) | benign(0.359) | TCGA-AC-A23H-01 | Breast | breast invasive carcinoma | Female | >=65 | I/II | Unknown | Unknown | PD | |
| TAF1C | SNV | Missense_Mutation | rs567236392 | c.275N>A | p.Arg92Gln | p.R92Q | Q15572 | protein_coding | tolerated(0.33) | benign(0.003) | TCGA-AR-A0TY-01 | Breast | breast invasive carcinoma | Female | <65 | I/II | Unspecific | Paclitaxel | PD |
| TAF1C | SNV | Missense_Mutation | novel | c.1246N>T | p.Pro416Ser | p.P416S | Q15572 | protein_coding | deleterious(0.03) | probably_damaging(0.913) | TCGA-B6-A400-01 | Breast | breast invasive carcinoma | Female | <65 | III/IV | Unknown | Unknown | SD |
| TAF1C | SNV | Missense_Mutation | rs751167821 | c.1204N>A | p.Val402Met | p.V402M | Q15572 | protein_coding | deleterious(0.01) | possibly_damaging(0.557) | TCGA-E2-A9RU-01 | Breast | breast invasive carcinoma | Female | >=65 | III/IV | Hormone Therapy | arimidex | SD |
| TAF1C | SNV | Missense_Mutation | novel | c.149T>C | p.Leu50Pro | p.L50P | Q15572 | protein_coding | tolerated(0.36) | benign(0.003) | TCGA-2W-A8YY-01 | Cervix | cervical & endocervical cancer | Female | <65 | I/II | Chemotherapy | cisplatin | CR |
| TAF1C | SNV | Missense_Mutation | rs200602141 | c.554N>T | p.Ser185Leu | p.S185L | Q15572 | protein_coding | tolerated(0.62) | possibly_damaging(0.56) | TCGA-EA-A3HS-01 | Cervix | cervical & endocervical cancer | Female | <65 | I/II | Unknown | Unknown | SD |
| TAF1C | SNV | Missense_Mutation | rs371382879 | c.1766N>T | p.Ser589Leu | p.S589L | Q15572 | protein_coding | deleterious(0) | probably_damaging(0.996) | TCGA-EA-A6QX-01 | Cervix | cervical & endocervical cancer | Female | <65 | III/IV | Unknown | Unknown | SD |
| TAF1C | SNV | Missense_Mutation | novel | c.2512T>C | p.Ser838Pro | p.S838P | Q15572 | protein_coding | deleterious(0.01) | probably_damaging(0.997) | TCGA-MA-AA42-01 | Cervix | cervical & endocervical cancer | Female | >=65 | I/II | Unknown | Unknown | SD |
| TAF1C | SNV | Missense_Mutation | novel | c.1340N>T | p.Ser447Phe | p.S447F | Q15572 | protein_coding | tolerated(0.07) | benign(0.242) | TCGA-VS-A8EL-01 | Cervix | cervical & endocervical cancer | Female | <65 | I/II | Chemotherapy | cisplatin | CR |
| Page: 1 2 3 4 5 6 7 8 9 |
Top |
Related drugs of malignant transformation related genes |
| Identification of chemicals and drugs interact with genes involved in malignant transfromation |
| (DGIdb 4.0) |
| Entrez ID | Symbol | Category | Interaction Types | Drug Claim Name | Drug Name | PMIDs |
| Page: 1 |

Copyright 2023-Present -The University of Texas Health Science Center at Houston |