| Tissue | Expression Dynamics | Abbreviation |
| Cervix | 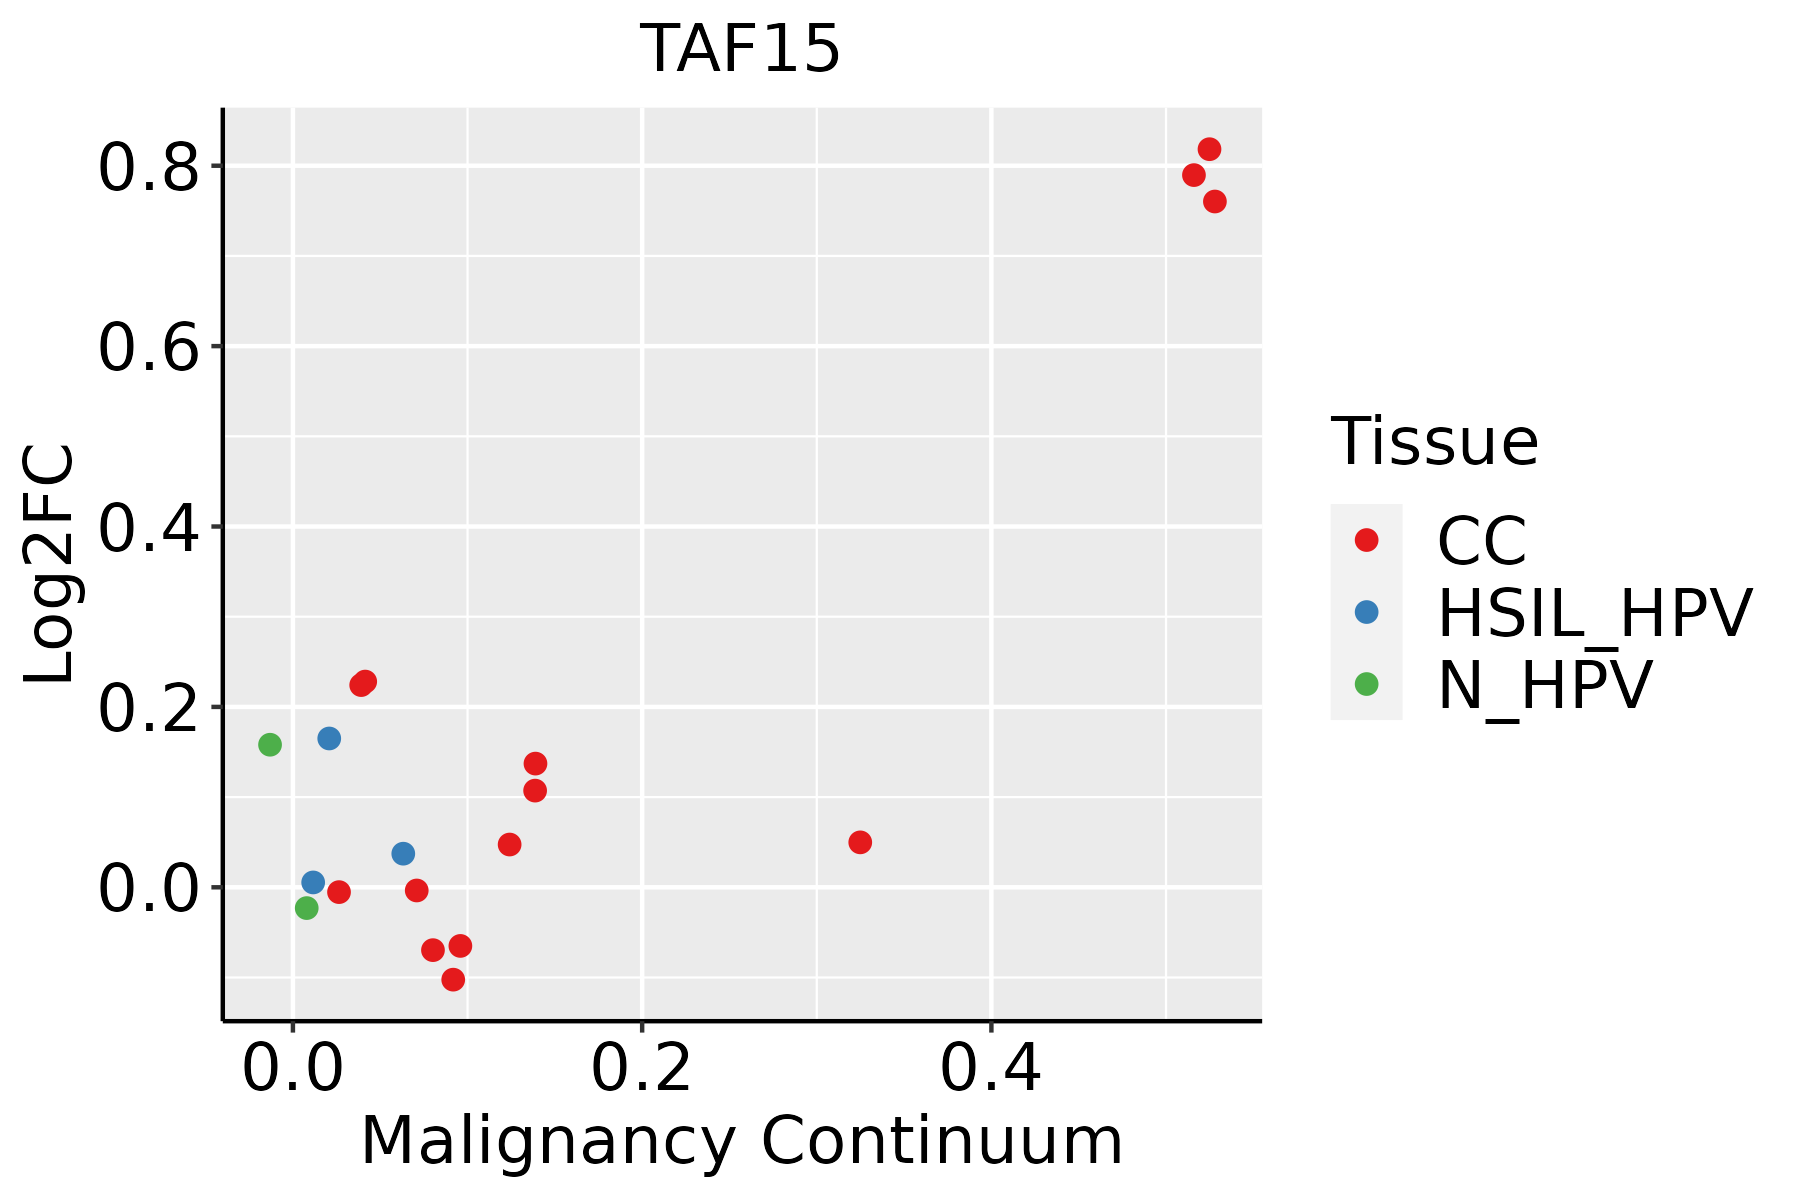 | CC: Cervix cancer |
| HSIL_HPV: HPV-infected high-grade squamous intraepithelial lesions |
| N_HPV: HPV-infected normal cervix |
| Colorectum (GSE201348) |  | FAP: Familial adenomatous polyposis |
| CRC: Colorectal cancer |
| Colorectum (HTA11) |  | AD: Adenomas |
| SER: Sessile serrated lesions |
| MSI-H: Microsatellite-high colorectal cancer |
| MSS: Microsatellite stable colorectal cancer |
| Esophagus | 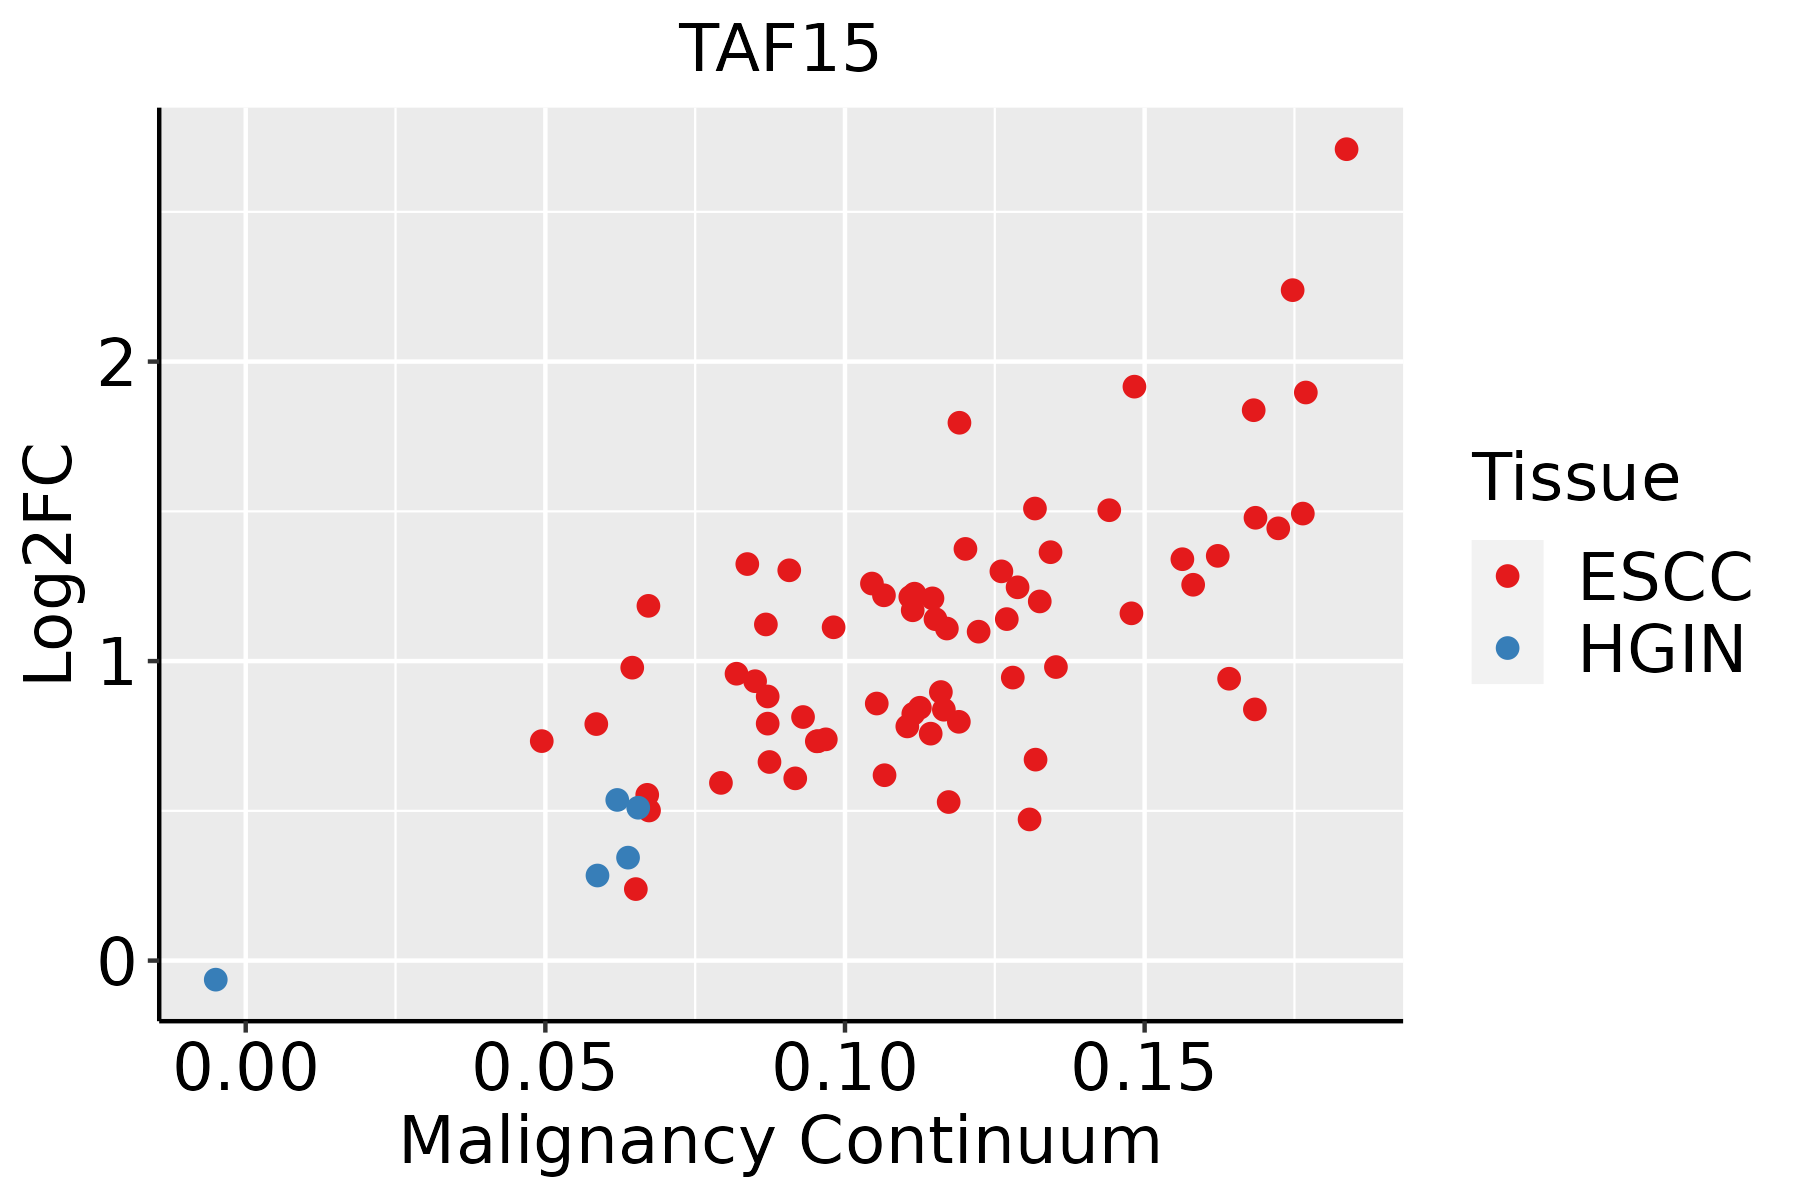 | ESCC: Esophageal squamous cell carcinoma |
| HGIN: High-grade intraepithelial neoplasias |
| LGIN: Low-grade intraepithelial neoplasias |
| Liver |  | HCC: Hepatocellular carcinoma |
| NAFLD: Non-alcoholic fatty liver disease |
| Lung | 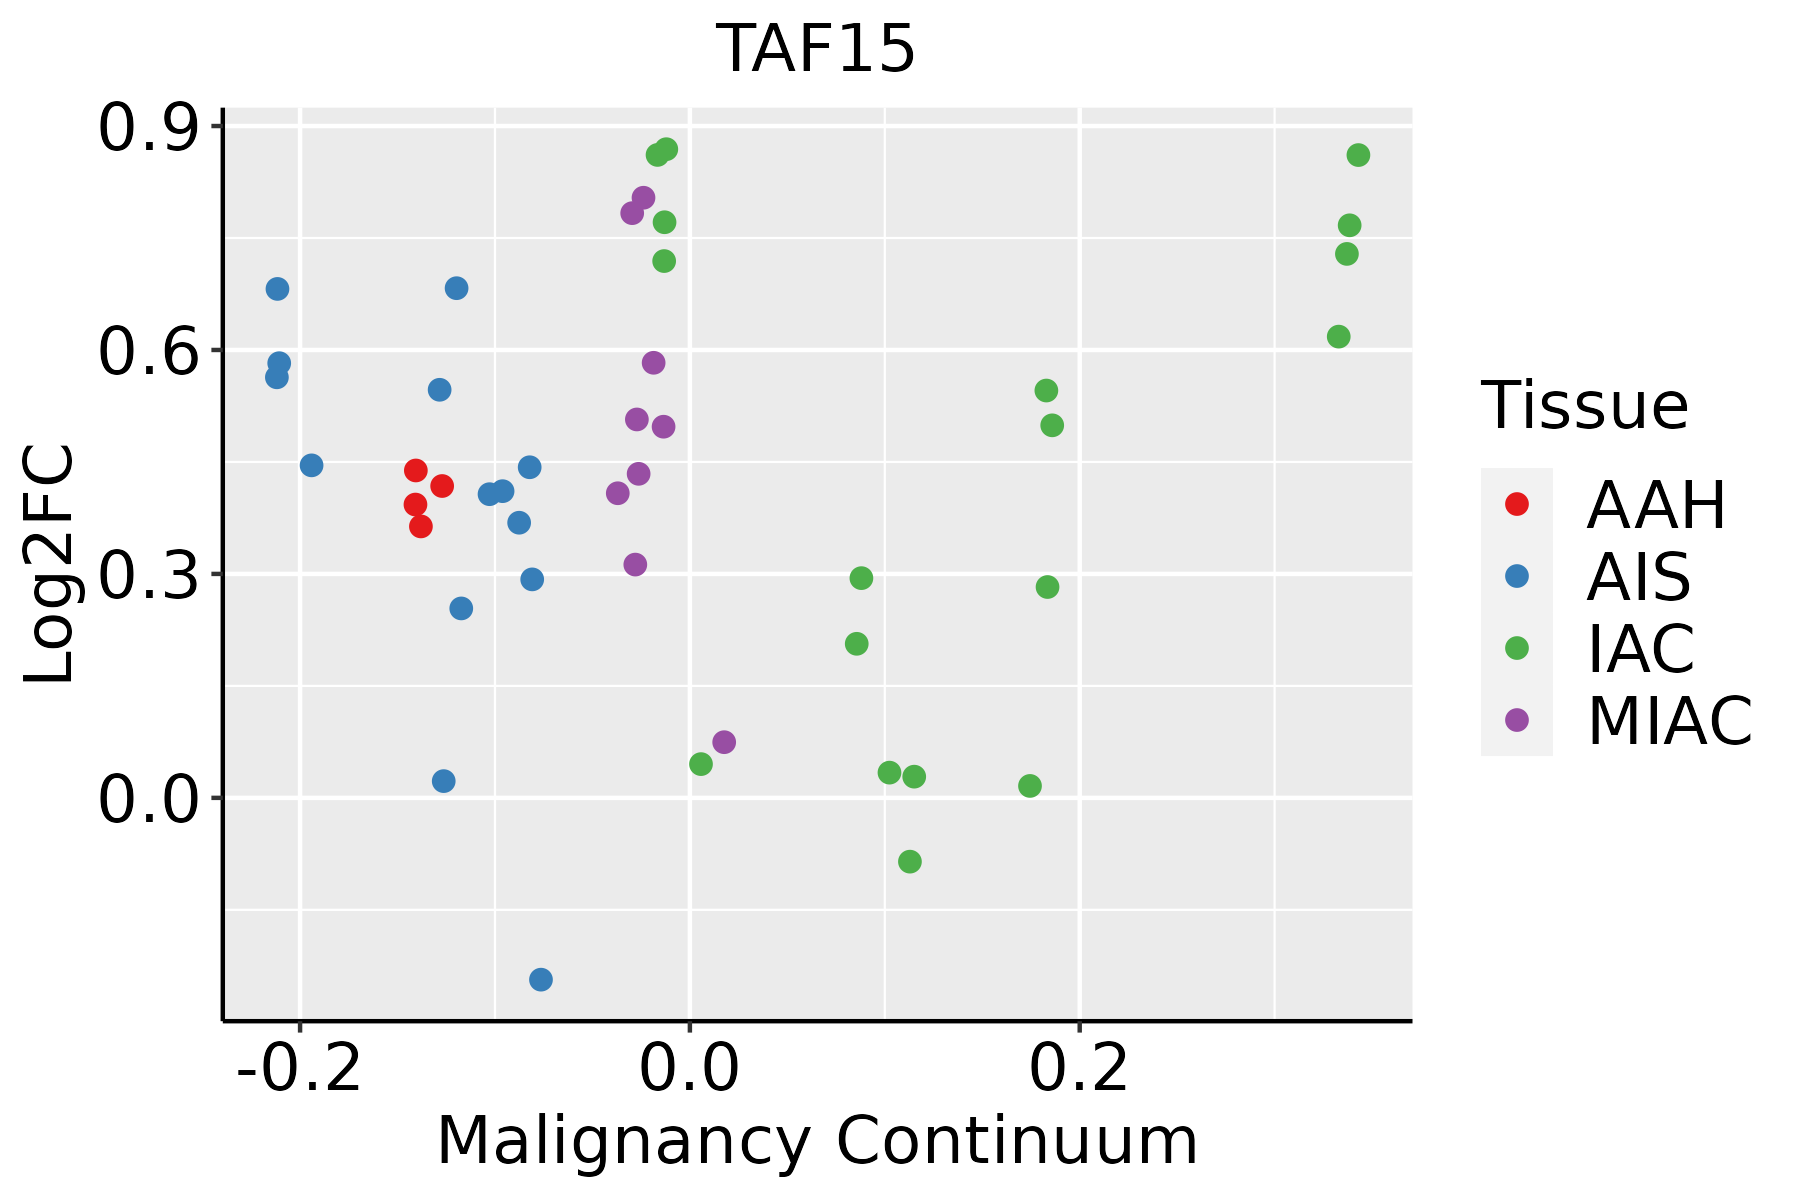 | AAH: Atypical adenomatous hyperplasia |
| AIS: Adenocarcinoma in situ |
| IAC: Invasive lung adenocarcinoma |
| MIA: Minimally invasive adenocarcinoma |
| Oral Cavity | 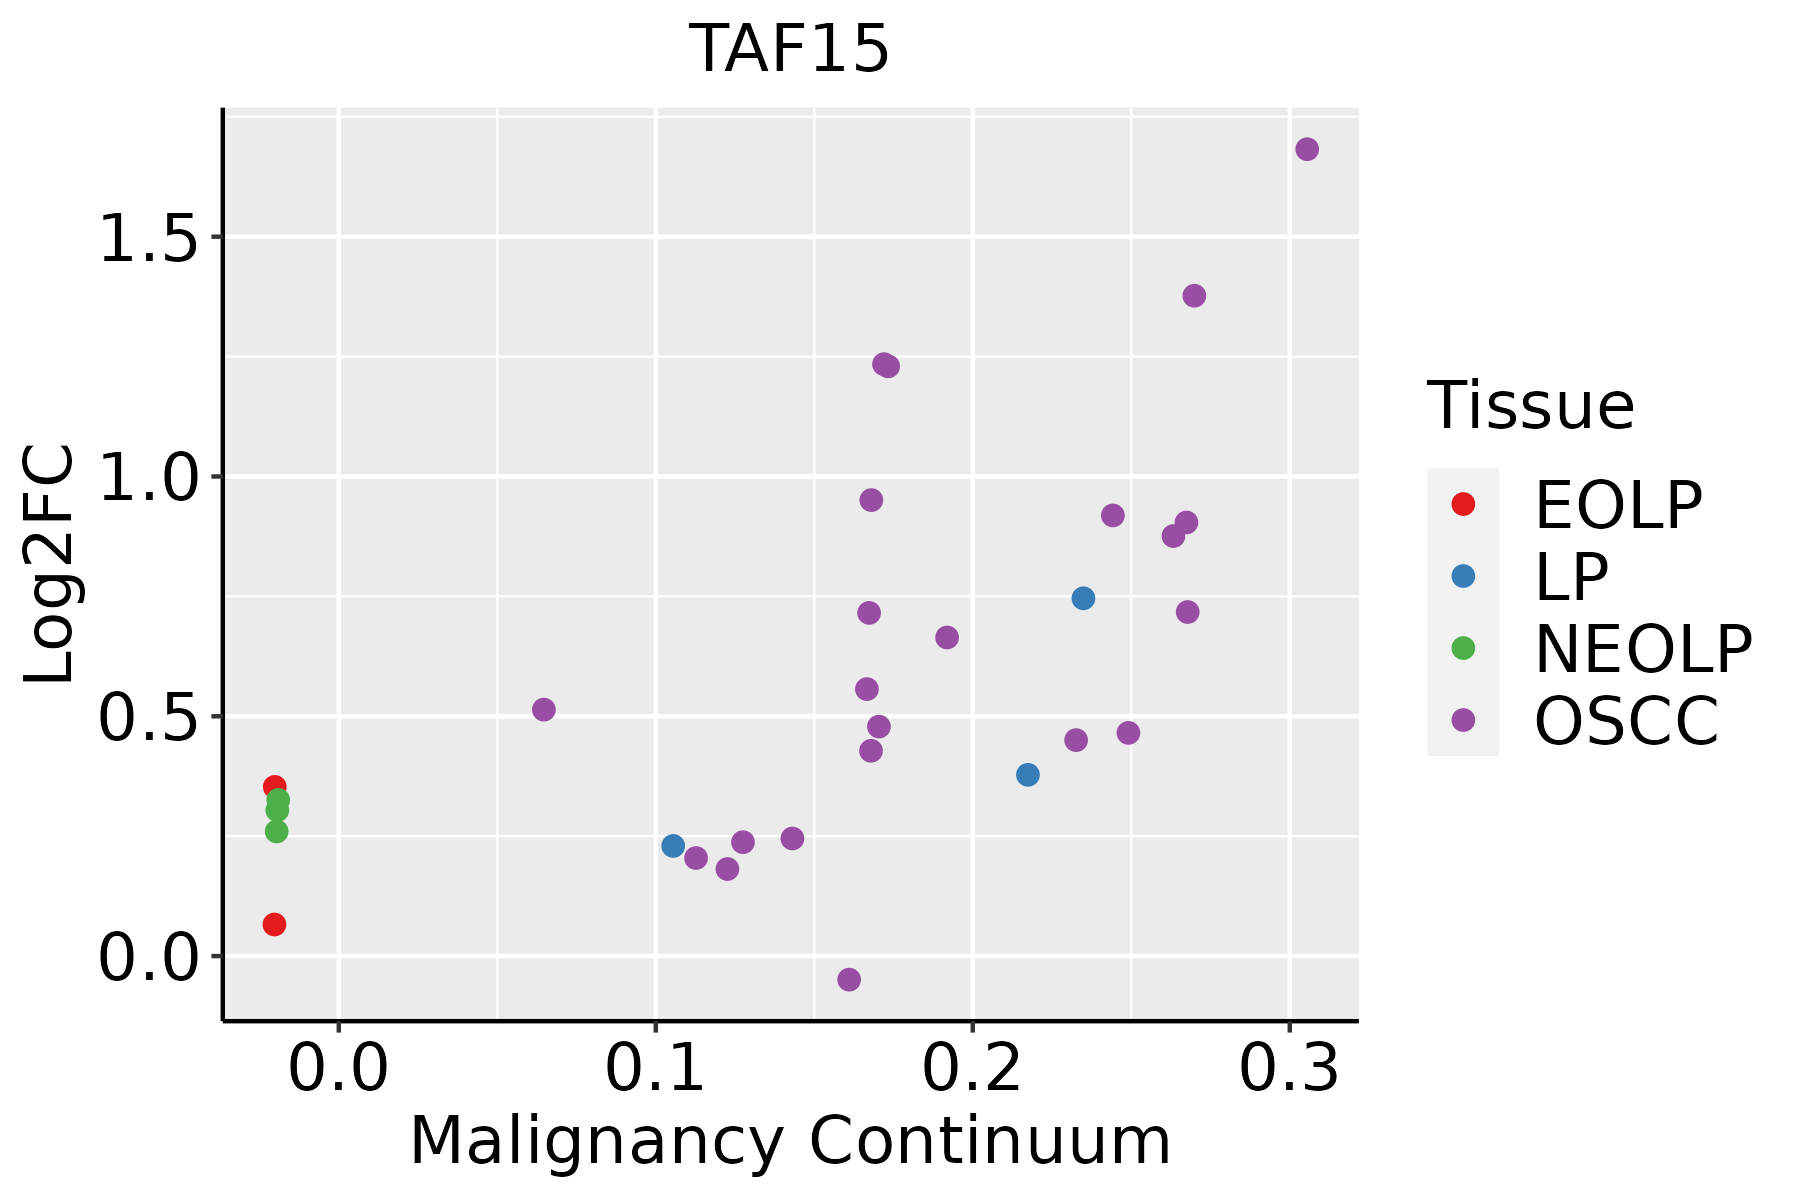 | EOLP: Erosive Oral lichen planus |
| LP: leukoplakia |
| NEOLP: Non-erosive oral lichen planus |
| OSCC: Oral squamous cell carcinoma |
| Prostate | 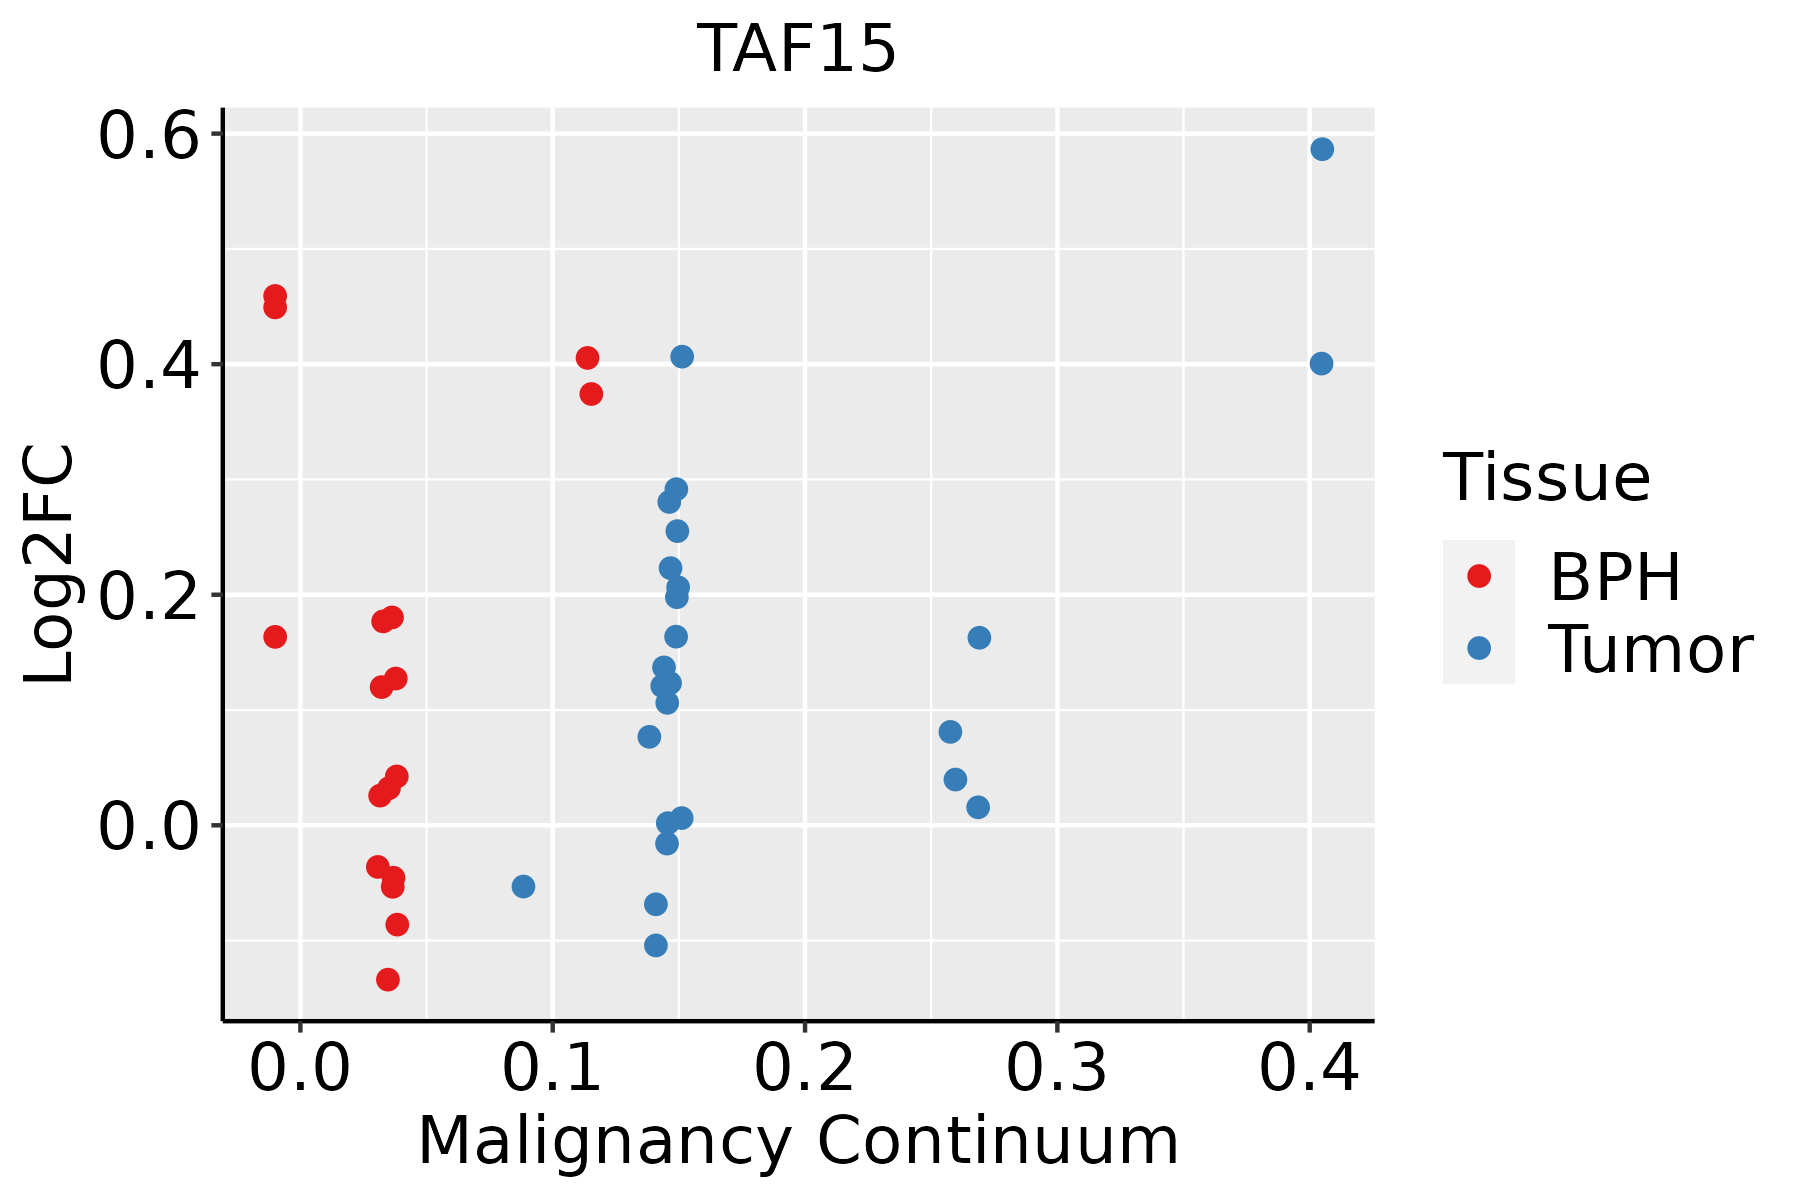 | BPH: Benign Prostatic Hyperplasia |
| Skin | 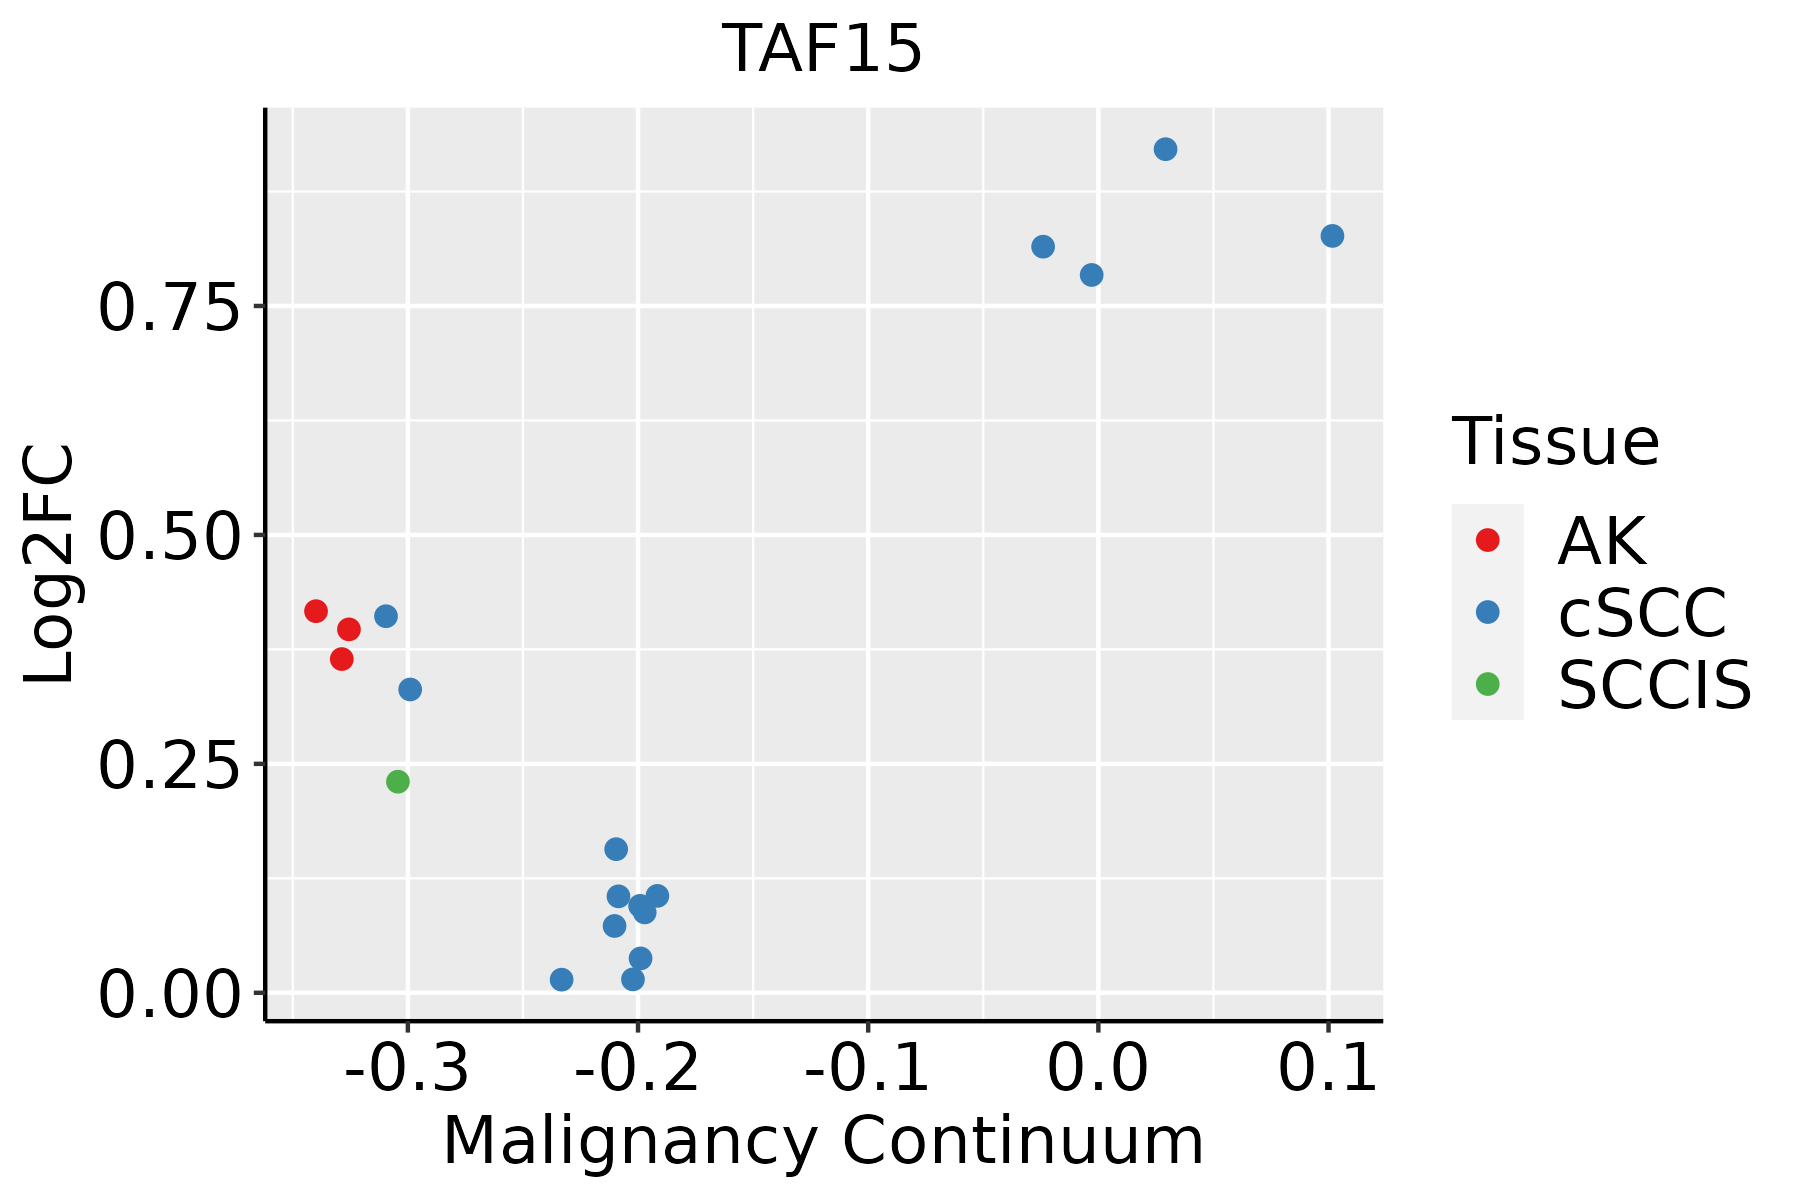 | AK: Actinic keratosis |
| cSCC: Cutaneous squamous cell carcinoma |
| SCCIS:squamous cell carcinoma in situ |
| Thyroid | 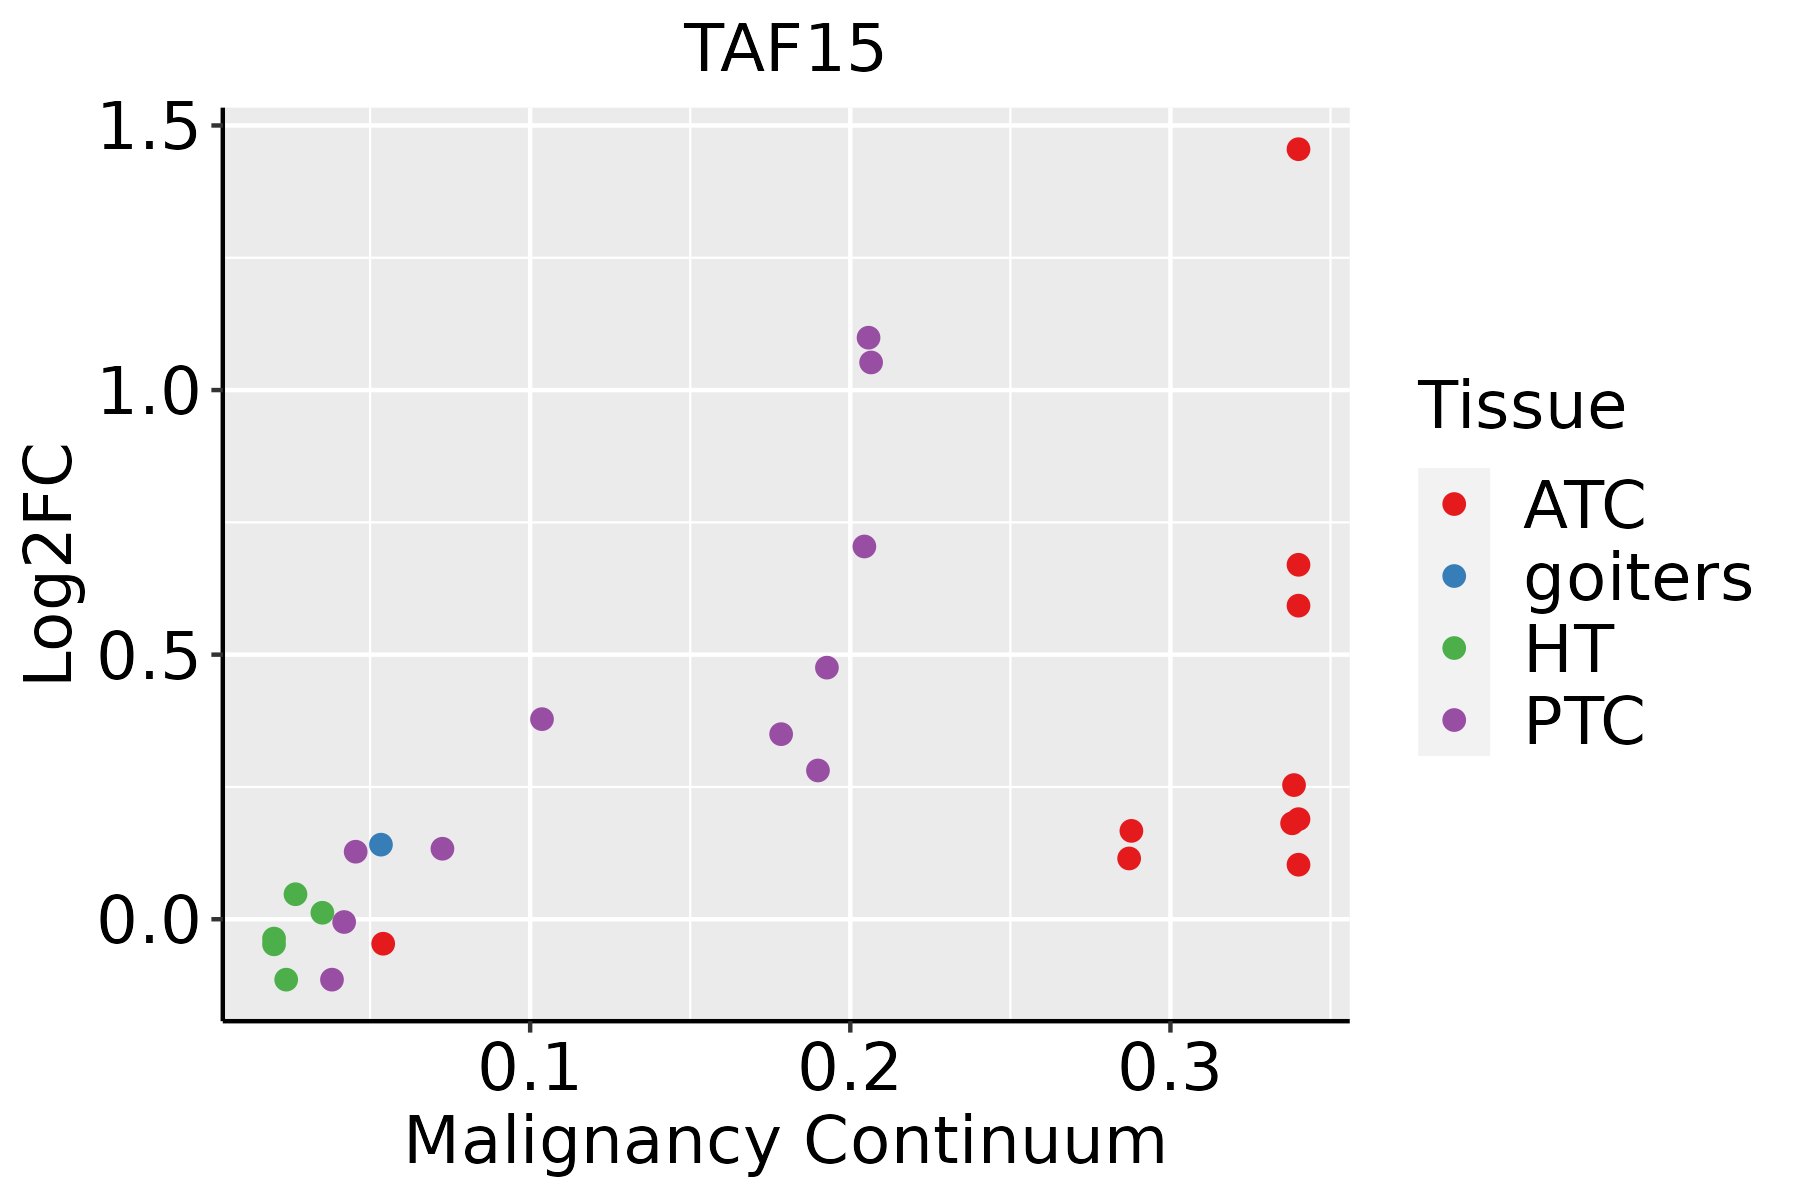 | ATC: Anaplastic thyroid cancer |
| HT: Hashimoto's thyroiditis |
| PTC: Papillary thyroid cancer |
| GO ID | Tissue | Disease Stage | Description | Gene Ratio | Bg Ratio | pvalue | p.adjust | Count |
| GO:003133010 | Cervix | CC | negative regulation of cellular catabolic process | 63/2311 | 262/18723 | 1.10e-07 | 5.68e-06 | 63 |
| GO:00064029 | Cervix | CC | mRNA catabolic process | 56/2311 | 232/18723 | 4.81e-07 | 1.83e-05 | 56 |
| GO:19033119 | Cervix | CC | regulation of mRNA metabolic process | 64/2311 | 288/18723 | 1.71e-06 | 5.64e-05 | 64 |
| GO:000989510 | Cervix | CC | negative regulation of catabolic process | 69/2311 | 320/18723 | 2.15e-06 | 6.55e-05 | 69 |
| GO:00064019 | Cervix | CC | RNA catabolic process | 62/2311 | 278/18723 | 2.18e-06 | 6.56e-05 | 62 |
| GO:00610139 | Cervix | CC | regulation of mRNA catabolic process | 38/2311 | 166/18723 | 1.07e-04 | 1.36e-03 | 38 |
| GO:190331210 | Cervix | CC | negative regulation of mRNA metabolic process | 24/2311 | 92/18723 | 2.49e-04 | 2.77e-03 | 24 |
| GO:00467008 | Cervix | CC | heterocycle catabolic process | 80/2311 | 445/18723 | 3.23e-04 | 3.42e-03 | 80 |
| GO:00346559 | Cervix | CC | nucleobase-containing compound catabolic process | 74/2311 | 407/18723 | 3.77e-04 | 3.88e-03 | 74 |
| GO:00434889 | Cervix | CC | regulation of mRNA stability | 35/2311 | 158/18723 | 3.80e-04 | 3.89e-03 | 35 |
| GO:00434879 | Cervix | CC | regulation of RNA stability | 36/2311 | 170/18723 | 7.72e-04 | 6.86e-03 | 36 |
| GO:00442709 | Cervix | CC | cellular nitrogen compound catabolic process | 79/2311 | 451/18723 | 7.80e-04 | 6.91e-03 | 79 |
| GO:19023698 | Cervix | CC | negative regulation of RNA catabolic process | 19/2311 | 75/18723 | 1.54e-03 | 1.19e-02 | 19 |
| GO:00194398 | Cervix | CC | aromatic compound catabolic process | 79/2311 | 467/18723 | 2.14e-03 | 1.54e-02 | 79 |
| GO:19013618 | Cervix | CC | organic cyclic compound catabolic process | 80/2311 | 495/18723 | 6.77e-03 | 3.72e-02 | 80 |
| GO:19023738 | Cervix | CC | negative regulation of mRNA catabolic process | 15/2311 | 63/18723 | 8.52e-03 | 4.40e-02 | 15 |
| GO:1903311 | Colorectum | AD | regulation of mRNA metabolic process | 117/3918 | 288/18723 | 1.69e-14 | 4.23e-12 | 117 |
| GO:0009895 | Colorectum | AD | negative regulation of catabolic process | 124/3918 | 320/18723 | 1.66e-13 | 3.35e-11 | 124 |
| GO:0031330 | Colorectum | AD | negative regulation of cellular catabolic process | 104/3918 | 262/18723 | 2.66e-12 | 3.96e-10 | 104 |
| GO:0006401 | Colorectum | AD | RNA catabolic process | 102/3918 | 278/18723 | 8.64e-10 | 6.76e-08 | 102 |
| Pathway ID | Tissue | Disease Stage | Description | Gene Ratio | Bg Ratio | pvalue | p.adjust | qvalue | Count |
| hsa05202 | Colorectum | FAP | Transcriptional misregulation in cancer | 45/1404 | 193/8465 | 9.19e-03 | 3.33e-02 | 2.03e-02 | 45 |
| hsa052021 | Colorectum | FAP | Transcriptional misregulation in cancer | 45/1404 | 193/8465 | 9.19e-03 | 3.33e-02 | 2.03e-02 | 45 |
| hsa030222 | Esophagus | ESCC | Basal transcription factors | 35/4205 | 45/8465 | 1.01e-04 | 4.06e-04 | 2.08e-04 | 35 |
| hsa052028 | Esophagus | ESCC | Transcriptional misregulation in cancer | 116/4205 | 193/8465 | 2.08e-03 | 5.95e-03 | 3.05e-03 | 116 |
| hsa0302211 | Esophagus | ESCC | Basal transcription factors | 35/4205 | 45/8465 | 1.01e-04 | 4.06e-04 | 2.08e-04 | 35 |
| hsa0520213 | Esophagus | ESCC | Transcriptional misregulation in cancer | 116/4205 | 193/8465 | 2.08e-03 | 5.95e-03 | 3.05e-03 | 116 |
| hsa052026 | Lung | IAC | Transcriptional misregulation in cancer | 40/1053 | 193/8465 | 6.90e-04 | 5.90e-03 | 3.92e-03 | 40 |
| hsa0520211 | Lung | IAC | Transcriptional misregulation in cancer | 40/1053 | 193/8465 | 6.90e-04 | 5.90e-03 | 3.92e-03 | 40 |
| hsa052022 | Lung | AIS | Transcriptional misregulation in cancer | 39/961 | 193/8465 | 2.15e-04 | 2.41e-03 | 1.54e-03 | 39 |
| hsa052023 | Lung | AIS | Transcriptional misregulation in cancer | 39/961 | 193/8465 | 2.15e-04 | 2.41e-03 | 1.54e-03 | 39 |
| hsa052024 | Lung | MIAC | Transcriptional misregulation in cancer | 22/507 | 193/8465 | 2.64e-03 | 2.26e-02 | 1.64e-02 | 22 |
| hsa052025 | Lung | MIAC | Transcriptional misregulation in cancer | 22/507 | 193/8465 | 2.64e-03 | 2.26e-02 | 1.64e-02 | 22 |
| hsa03022 | Oral cavity | OSCC | Basal transcription factors | 28/3704 | 45/8465 | 9.53e-03 | 2.11e-02 | 1.08e-02 | 28 |
| hsa030221 | Oral cavity | OSCC | Basal transcription factors | 28/3704 | 45/8465 | 9.53e-03 | 2.11e-02 | 1.08e-02 | 28 |
| hsa052027 | Prostate | BPH | Transcriptional misregulation in cancer | 53/1718 | 193/8465 | 9.56e-03 | 2.92e-02 | 1.81e-02 | 53 |
| hsa0520212 | Prostate | BPH | Transcriptional misregulation in cancer | 53/1718 | 193/8465 | 9.56e-03 | 2.92e-02 | 1.81e-02 | 53 |
| hsa0520221 | Prostate | Tumor | Transcriptional misregulation in cancer | 59/1791 | 193/8465 | 1.22e-03 | 5.26e-03 | 3.26e-03 | 59 |
| hsa0520231 | Prostate | Tumor | Transcriptional misregulation in cancer | 59/1791 | 193/8465 | 1.22e-03 | 5.26e-03 | 3.26e-03 | 59 |
| Hugo Symbol | Variant Class | Variant Classification | dbSNP RS | HGVSc | HGVSp | HGVSp Short | SWISSPROT | BIOTYPE | SIFT | PolyPhen | Tumor Sample Barcode | Tissue | Histology | Sex | Age | Stage | Therapy Types | Drugs | Outcome |
| TAF15 | SNV | Missense_Mutation | novel | c.1270N>T | p.Gly424Trp | p.G424W | Q92804 | protein_coding | deleterious_low_confidence(0.04) | possibly_damaging(0.525) | TCGA-A7-A0DB-01 | Breast | breast invasive carcinoma | Female | <65 | I/II | Hormone Therapy | arimidex | SD |
| TAF15 | insertion | Frame_Shift_Ins | novel | c.566_567insACTCAGCTCTTGTGGCATGTTTATTAAAGAGTCAGAC | p.Tyr190LeufsTer14 | p.Y190Lfs*14 | Q92804 | protein_coding | | | TCGA-A8-A08H-01 | Breast | breast invasive carcinoma | Female | >=65 | I/II | Unknown | Unknown | SD |
| TAF15 | insertion | Frame_Shift_Ins | rs770087298 | c.1582_1583insG | p.Tyr531LeufsTer56 | p.Y531Lfs*56 | Q92804 | protein_coding | | | TCGA-BH-A1FD-01 | Breast | breast invasive carcinoma | Female | >=65 | I/II | Unknown | Unknown | PD |
| TAF15 | SNV | Missense_Mutation | rs746865431 | c.1246N>A | p.Gly416Ser | p.G416S | Q92804 | protein_coding | deleterious_low_confidence(0.05) | benign(0.183) | TCGA-2W-A8YY-01 | Cervix | cervical & endocervical cancer | Female | <65 | I/II | Chemotherapy | cisplatin | CR |
| TAF15 | SNV | Missense_Mutation | novel | c.962N>T | p.Arg321Ile | p.R321I | Q92804 | protein_coding | deleterious_low_confidence(0) | probably_damaging(0.967) | TCGA-JX-A3Q8-01 | Cervix | cervical & endocervical cancer | Female | <65 | I/II | Unknown | Unknown | SD |
| TAF15 | SNV | Missense_Mutation | novel | c.1510G>C | p.Asp504His | p.D504H | Q92804 | protein_coding | deleterious_low_confidence(0) | possibly_damaging(0.907) | TCGA-LP-A5U2-01 | Cervix | cervical & endocervical cancer | Female | <65 | III/IV | Unknown | Unknown | SD |
| TAF15 | SNV | Missense_Mutation | novel | c.1752N>T | p.Arg584Ser | p.R584S | Q92804 | protein_coding | deleterious_low_confidence(0) | probably_damaging(0.95) | TCGA-UC-A7PF-01 | Cervix | cervical & endocervical cancer | Female | <65 | I/II | Unknown | Unknown | SD |
| TAF15 | SNV | Missense_Mutation | rs780771102 | c.535N>A | p.Gly179Arg | p.G179R | Q92804 | protein_coding | tolerated_low_confidence(0.06) | probably_damaging(0.999) | TCGA-A6-6781-01 | Colorectum | colon adenocarcinoma | Male | <65 | III/IV | Chemotherapy | oxaliplatin | SD |
| TAF15 | SNV | Missense_Mutation | novel | c.1469G>A | p.Arg490Gln | p.R490Q | Q92804 | protein_coding | | benign(0.003) | TCGA-AA-A01K-01 | Colorectum | colon adenocarcinoma | Female | >=65 | III/IV | Chemotherapy | folinic | CR |
| TAF15 | SNV | Missense_Mutation | rs770549195 | c.1358N>A | p.Gly453Asp | p.G453D | Q92804 | protein_coding | deleterious_low_confidence(0.01) | benign(0.205) | TCGA-AZ-6598-01 | Colorectum | colon adenocarcinoma | Female | >=65 | I/II | Unknown | Unknown | SD |


