
|
|||||
|
 | |
| |
| |
| |
| |
| |
|
Gene: TAF13 |
Gene summary for TAF13 |
| Gene information | Species | Human | Gene symbol | TAF13 | Gene ID | 6884 |
| Gene name | TATA-box binding protein associated factor 13 | |
| Gene Alias | MRT60 | |
| Cytomap | 1p13.3 | |
| Gene Type | protein-coding | GO ID | GO:0006139 | UniProtAcc | A0A024R089 |
Top |
Malignant transformation analysis |
| Identification of the aberrant gene expression in precancerous and cancerous lesions by comparing the gene expression of stem-like cells in diseased tissues with normal stem cells |
| Entrez ID | Symbol | Replicates | Species | Organ | Tissue | Adj P-value | Log2FC | Malignancy |
| 6884 | TAF13 | HCC1_Meng | Human | Liver | HCC | 8.04e-46 | -3.32e-03 | 0.0246 |
| 6884 | TAF13 | HCC2_Meng | Human | Liver | HCC | 7.62e-24 | 9.46e-02 | 0.0107 |
| 6884 | TAF13 | Pt13.b | Human | Liver | HCC | 1.58e-02 | 1.45e-02 | 0.0251 |
| 6884 | TAF13 | S014 | Human | Liver | HCC | 1.49e-03 | 1.49e-01 | 0.2254 |
| 6884 | TAF13 | S015 | Human | Liver | HCC | 2.91e-06 | 3.35e-01 | 0.2375 |
| 6884 | TAF13 | S027 | Human | Liver | HCC | 4.70e-04 | 4.28e-01 | 0.2446 |
| 6884 | TAF13 | S028 | Human | Liver | HCC | 8.18e-13 | 5.52e-01 | 0.2503 |
| 6884 | TAF13 | S029 | Human | Liver | HCC | 1.12e-09 | 6.37e-01 | 0.2581 |
| 6884 | TAF13 | C04 | Human | Oral cavity | OSCC | 9.78e-03 | 4.18e-01 | 0.2633 |
| 6884 | TAF13 | C21 | Human | Oral cavity | OSCC | 1.76e-18 | 7.06e-01 | 0.2678 |
| 6884 | TAF13 | C30 | Human | Oral cavity | OSCC | 1.08e-31 | 1.41e+00 | 0.3055 |
| 6884 | TAF13 | C43 | Human | Oral cavity | OSCC | 1.69e-08 | 2.86e-01 | 0.1704 |
| 6884 | TAF13 | C51 | Human | Oral cavity | OSCC | 1.58e-14 | 8.76e-01 | 0.2674 |
| 6884 | TAF13 | C57 | Human | Oral cavity | OSCC | 2.74e-05 | 3.40e-01 | 0.1679 |
| 6884 | TAF13 | C06 | Human | Oral cavity | OSCC | 2.18e-04 | 1.03e+00 | 0.2699 |
| 6884 | TAF13 | C09 | Human | Oral cavity | OSCC | 4.33e-04 | 1.57e-01 | 0.1431 |
| 6884 | TAF13 | SYSMH2 | Human | Oral cavity | OSCC | 1.24e-04 | 1.86e-01 | 0.2326 |
| 6884 | TAF13 | SYSMH3 | Human | Oral cavity | OSCC | 7.11e-19 | 5.70e-01 | 0.2442 |
| 6884 | TAF13 | male-WTA | Human | Thyroid | PTC | 2.38e-24 | 3.99e-02 | 0.1037 |
| 6884 | TAF13 | PTC04 | Human | Thyroid | PTC | 2.85e-04 | -2.86e-03 | 0.1927 |
| Page: 1 2 |
| Tissue | Expression Dynamics | Abbreviation |
| Liver | 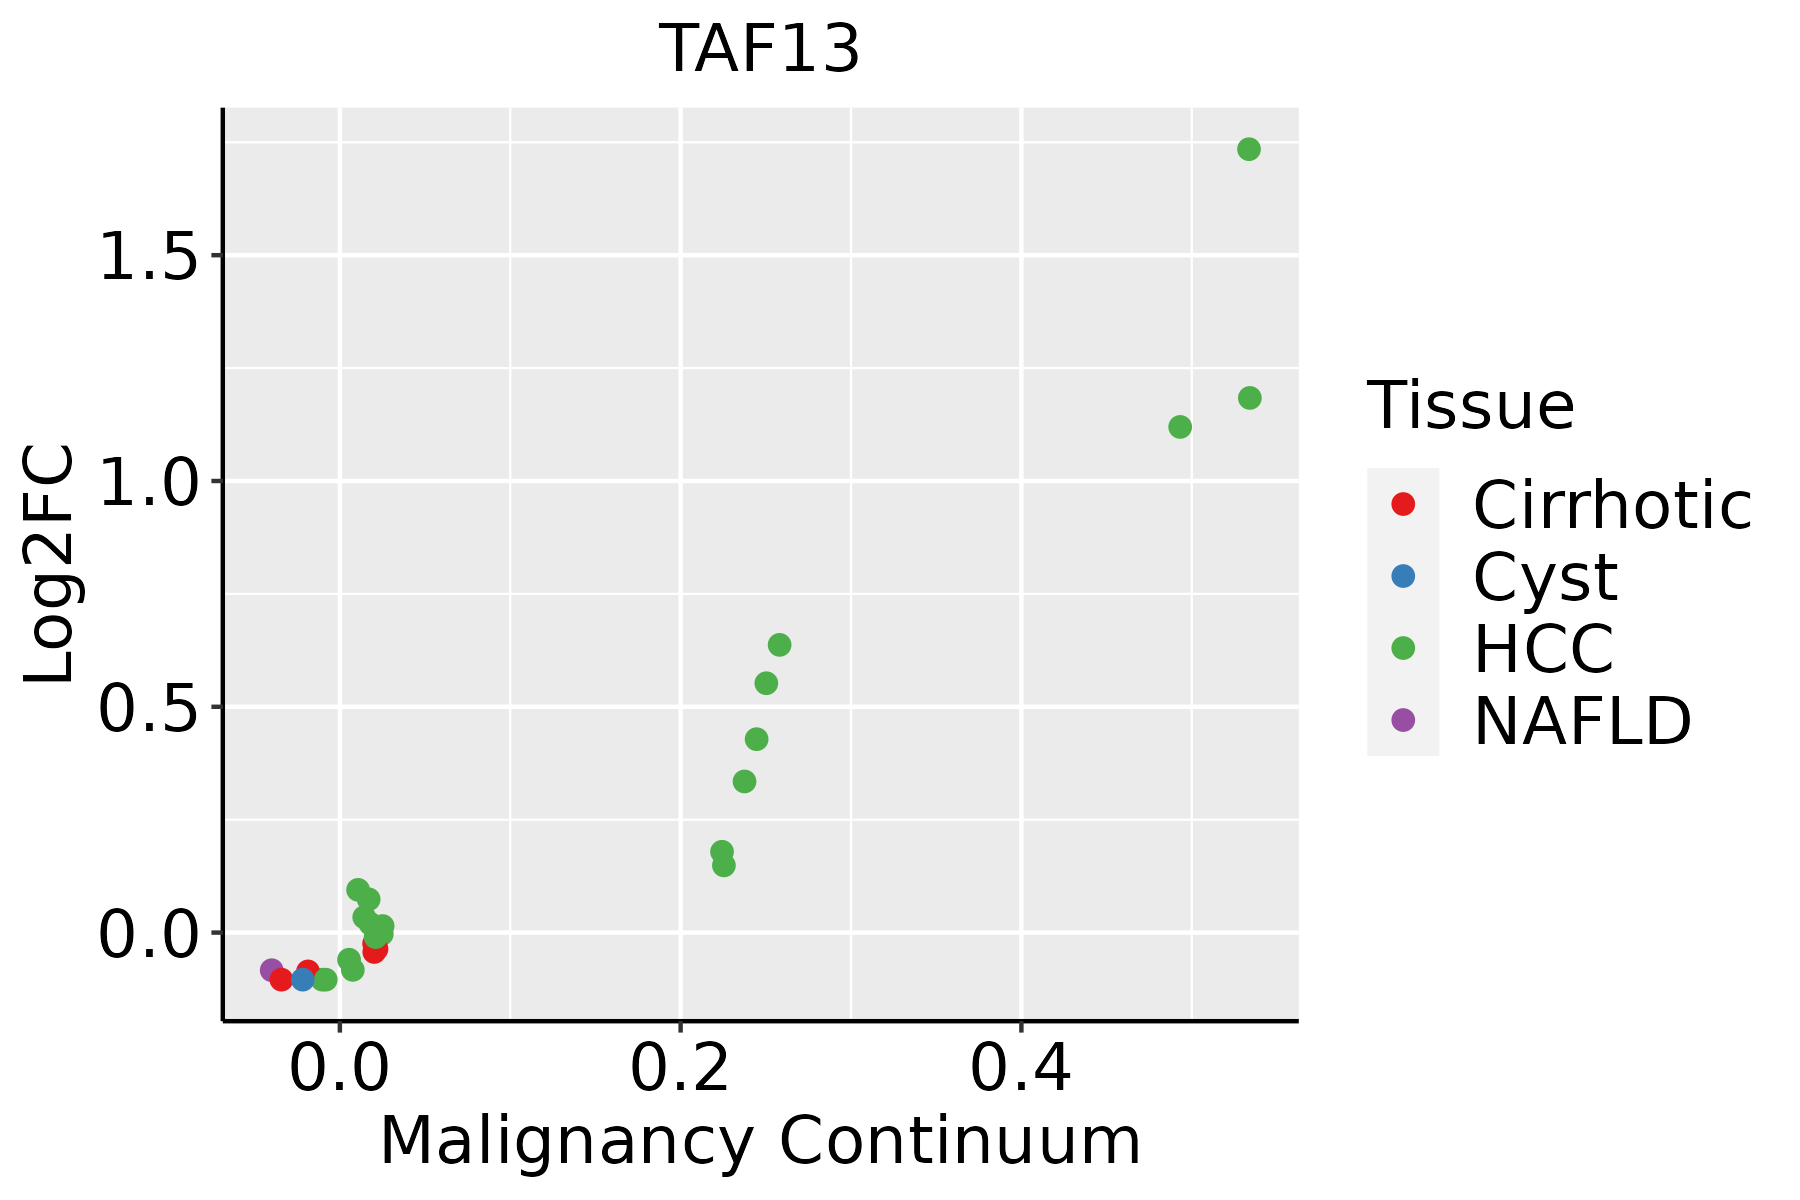 | HCC: Hepatocellular carcinoma |
| NAFLD: Non-alcoholic fatty liver disease | ||
| Oral Cavity |  | EOLP: Erosive Oral lichen planus |
| LP: leukoplakia | ||
| NEOLP: Non-erosive oral lichen planus | ||
| OSCC: Oral squamous cell carcinoma | ||
| Thyroid |  | ATC: Anaplastic thyroid cancer |
| HT: Hashimoto's thyroiditis | ||
| PTC: Papillary thyroid cancer |
| ∗log2FC in expression of this searched gene in stem-like cells from each diseased tissue sample relative to stem-like cells in normal samples in each tissue plotted against the malignancy continuum. Samples are colored based on if they are from different disease stage. |
Top |
Malignant transformation related pathway analysis |
| Find out the enriched GO biological processes and KEGG pathways involved in transition from healthy to precancer to cancer |
| Tissue | Disease Stage | Enriched GO biological Processes |
| Colorectum | AD |  |
| Colorectum | SER |  |
| Colorectum | MSS |  |
| Colorectum | MSI-H |  |
| Colorectum | FAP |  |
| ∗Top 15 enriched GO BP terms are showed in the bar plot of each disease state in each tissue. Each row represents a significant GO biological process which is colored according to the -log10(p.adjust). |
| Page: 1 2 3 4 5 6 7 8 9 |
| GO ID | Tissue | Disease Stage | Description | Gene Ratio | Bg Ratio | pvalue | p.adjust | Count |
| GO:00063671 | Liver | HCC | transcription initiation from RNA polymerase II promoter | 52/7958 | 77/18723 | 7.87e-06 | 9.27e-05 | 52 |
| GO:0006352 | Liver | HCC | DNA-templated transcription, initiation | 78/7958 | 130/18723 | 4.19e-05 | 4.11e-04 | 78 |
| GO:00063522 | Oral cavity | OSCC | DNA-templated transcription, initiation | 74/7305 | 130/18723 | 2.56e-05 | 2.39e-04 | 74 |
| GO:00063672 | Oral cavity | OSCC | transcription initiation from RNA polymerase II promoter | 46/7305 | 77/18723 | 1.82e-04 | 1.24e-03 | 46 |
| GO:00063675 | Thyroid | PTC | transcription initiation from RNA polymerase II promoter | 44/5968 | 77/18723 | 4.04e-06 | 5.05e-05 | 44 |
| GO:00063525 | Thyroid | PTC | DNA-templated transcription, initiation | 63/5968 | 130/18723 | 5.72e-05 | 5.05e-04 | 63 |
| GO:000636712 | Thyroid | ATC | transcription initiation from RNA polymerase II promoter | 44/6293 | 77/18723 | 1.86e-05 | 1.70e-04 | 44 |
| GO:000635213 | Thyroid | ATC | DNA-templated transcription, initiation | 64/6293 | 130/18723 | 1.60e-04 | 1.10e-03 | 64 |
| Page: 1 |
| Pathway ID | Tissue | Disease Stage | Description | Gene Ratio | Bg Ratio | pvalue | p.adjust | qvalue | Count |
| hsa03022 | Oral cavity | OSCC | Basal transcription factors | 28/3704 | 45/8465 | 9.53e-03 | 2.11e-02 | 1.08e-02 | 28 |
| hsa030221 | Oral cavity | OSCC | Basal transcription factors | 28/3704 | 45/8465 | 9.53e-03 | 2.11e-02 | 1.08e-02 | 28 |
| Page: 1 |
Top |
Cell-cell communication analysis |
| Identification of potential cell-cell interactions between two cell types and their ligand-receptor pairs for different disease states |
| Ligand | Receptor | LRpair | Pathway | Tissue | Disease Stage |
| Page: 1 |
Top |
Single-cell gene regulatory network inference analysis |
| Find out the significant the regulons (TFs) and the target genes of each regulon across cell types for different disease states |
| TF | Cell Type | Tissue | Disease Stage | Target Gene | RSS | Regulon Activity |
| ∗The dot plots of a searched regulon are shown for all cell subpopulations in each disease state of each tissue based on the regulon specific score inferred using pySCENIC and by calculating the average expression. |
| Page: 1 |
Top |
Somatic mutation of malignant transformation related genes |
| Annotation of somatic variants for genes involved in malignant transformation |
| Hugo Symbol | Variant Class | Variant Classification | dbSNP RS | HGVSc | HGVSp | HGVSp Short | SWISSPROT | BIOTYPE | SIFT | PolyPhen | Tumor Sample Barcode | Tissue | Histology | Sex | Age | Stage | Therapy Types | Drugs | Outcome |
| TAF13 | SNV | Missense_Mutation | c.83N>T | p.Arg28Ile | p.R28I | Q15543 | protein_coding | deleterious(0) | probably_damaging(0.961) | TCGA-E9-A1R7-01 | Breast | breast invasive carcinoma | Female | <65 | I/II | Hormone Therapy | fareston | SD | |
| TAF13 | SNV | Missense_Mutation | c.89N>T | p.Arg30Ile | p.R30I | Q15543 | protein_coding | tolerated(0.08) | possibly_damaging(0.908) | TCGA-A6-6141-01 | Colorectum | colon adenocarcinoma | Male | <65 | I/II | Chemotherapy | 5-fu | SD | |
| TAF13 | SNV | Missense_Mutation | c.89G>A | p.Arg30Lys | p.R30K | Q15543 | protein_coding | tolerated(0.08) | benign(0.173) | TCGA-AZ-4315-01 | Colorectum | colon adenocarcinoma | Male | <65 | I/II | Unknown | Unknown | SD | |
| TAF13 | SNV | Missense_Mutation | rs771211231 | c.113G>A | p.Cys38Tyr | p.C38Y | Q15543 | protein_coding | tolerated(1) | benign(0.115) | TCGA-AZ-4614-01 | Colorectum | colon adenocarcinoma | Female | >=65 | I/II | Unknown | Unknown | PD |
| TAF13 | SNV | Missense_Mutation | rs553663890 | c.215C>T | p.Ala72Val | p.A72V | Q15543 | protein_coding | deleterious(0) | probably_damaging(0.982) | TCGA-AJ-A3EK-01 | Endometrium | uterine corpus endometrioid carcinoma | Female | <65 | I/II | Chemotherapy | carboplatin | CR |
| TAF13 | SNV | Missense_Mutation | novel | c.48A>C | p.Glu16Asp | p.E16D | Q15543 | protein_coding | tolerated(0.48) | benign(0.217) | TCGA-AJ-A3EK-01 | Endometrium | uterine corpus endometrioid carcinoma | Female | <65 | I/II | Chemotherapy | carboplatin | CR |
| TAF13 | SNV | Missense_Mutation | novel | c.20A>G | p.Asp7Gly | p.D7G | Q15543 | protein_coding | tolerated(0.16) | benign(0.036) | TCGA-AX-A1CE-01 | Endometrium | uterine corpus endometrioid carcinoma | Female | <65 | I/II | Unspecific | Paclitaxel | SD |
| TAF13 | SNV | Missense_Mutation | novel | c.254N>G | p.Asp85Gly | p.D85G | Q15543 | protein_coding | deleterious(0.03) | probably_damaging(0.997) | TCGA-F7-A61W-01 | Oral cavity | head & neck squamous cell carcinoma | Male | <65 | I/II | Unknown | Unknown | SD |
| TAF13 | SNV | Missense_Mutation | novel | c.164A>G | p.Asp55Gly | p.D55G | Q15543 | protein_coding | tolerated(0.05) | possibly_damaging(0.626) | TCGA-XJ-A9DI-01 | Prostate | prostate adenocarcinoma | Male | <65 | 9 | Hormone Therapy | lupron | SD |
| TAF13 | SNV | Missense_Mutation | rs746539257 | c.259N>A | p.Val87Ile | p.V87I | Q15543 | protein_coding | tolerated(0.58) | benign(0.036) | TCGA-CG-5721-01 | Stomach | stomach adenocarcinoma | Male | <65 | III/IV | Unknown | Unknown | SD |
| Page: 1 |
Top |
Related drugs of malignant transformation related genes |
| Identification of chemicals and drugs interact with genes involved in malignant transfromation |
| (DGIdb 4.0) |
| Entrez ID | Symbol | Category | Interaction Types | Drug Claim Name | Drug Name | PMIDs |
| Page: 1 |

Copyright 2023-Present -The University of Texas Health Science Center at Houston |