
|
|||||
|
 | |
| |
| |
| |
| |
| |
|
Gene: TAF12 |
Gene summary for TAF12 |
| Gene information | Species | Human | Gene symbol | TAF12 | Gene ID | 6883 |
| Gene name | TATA-box binding protein associated factor 12 | |
| Gene Alias | TAF2J | |
| Cytomap | 1p35.3 | |
| Gene Type | protein-coding | GO ID | GO:0006139 | UniProtAcc | Q16514 |
Top |
Malignant transformation analysis |
| Identification of the aberrant gene expression in precancerous and cancerous lesions by comparing the gene expression of stem-like cells in diseased tissues with normal stem cells |
| Entrez ID | Symbol | Replicates | Species | Organ | Tissue | Adj P-value | Log2FC | Malignancy |
| 6883 | TAF12 | LZE2T | Human | Esophagus | ESCC | 1.22e-03 | 3.31e-01 | 0.082 |
| 6883 | TAF12 | LZE4T | Human | Esophagus | ESCC | 7.90e-06 | 2.52e-01 | 0.0811 |
| 6883 | TAF12 | LZE5T | Human | Esophagus | ESCC | 7.31e-03 | 3.31e-01 | 0.0514 |
| 6883 | TAF12 | LZE7T | Human | Esophagus | ESCC | 8.48e-06 | 3.00e-01 | 0.0667 |
| 6883 | TAF12 | LZE8T | Human | Esophagus | ESCC | 4.17e-06 | 2.33e-01 | 0.067 |
| 6883 | TAF12 | LZE20T | Human | Esophagus | ESCC | 2.95e-06 | 2.38e-01 | 0.0662 |
| 6883 | TAF12 | LZE22T | Human | Esophagus | ESCC | 4.83e-06 | 6.74e-01 | 0.068 |
| 6883 | TAF12 | LZE24T | Human | Esophagus | ESCC | 2.79e-27 | 6.20e-01 | 0.0596 |
| 6883 | TAF12 | LZE21T | Human | Esophagus | ESCC | 2.88e-03 | 3.86e-01 | 0.0655 |
| 6883 | TAF12 | LZE6T | Human | Esophagus | ESCC | 5.22e-10 | 4.45e-01 | 0.0845 |
| 6883 | TAF12 | P1T-E | Human | Esophagus | ESCC | 8.38e-09 | 3.31e-01 | 0.0875 |
| 6883 | TAF12 | P2T-E | Human | Esophagus | ESCC | 1.21e-29 | 6.48e-01 | 0.1177 |
| 6883 | TAF12 | P4T-E | Human | Esophagus | ESCC | 1.56e-22 | 5.46e-01 | 0.1323 |
| 6883 | TAF12 | P5T-E | Human | Esophagus | ESCC | 7.01e-15 | 2.64e-01 | 0.1327 |
| 6883 | TAF12 | P8T-E | Human | Esophagus | ESCC | 6.59e-18 | 3.54e-01 | 0.0889 |
| 6883 | TAF12 | P9T-E | Human | Esophagus | ESCC | 6.00e-19 | 4.68e-01 | 0.1131 |
| 6883 | TAF12 | P10T-E | Human | Esophagus | ESCC | 3.94e-30 | 5.12e-01 | 0.116 |
| 6883 | TAF12 | P11T-E | Human | Esophagus | ESCC | 3.56e-13 | 5.68e-01 | 0.1426 |
| 6883 | TAF12 | P12T-E | Human | Esophagus | ESCC | 1.07e-20 | 3.85e-01 | 0.1122 |
| 6883 | TAF12 | P15T-E | Human | Esophagus | ESCC | 1.18e-34 | 6.38e-01 | 0.1149 |
| Page: 1 2 3 4 5 6 7 |
| Tissue | Expression Dynamics | Abbreviation |
| Esophagus | 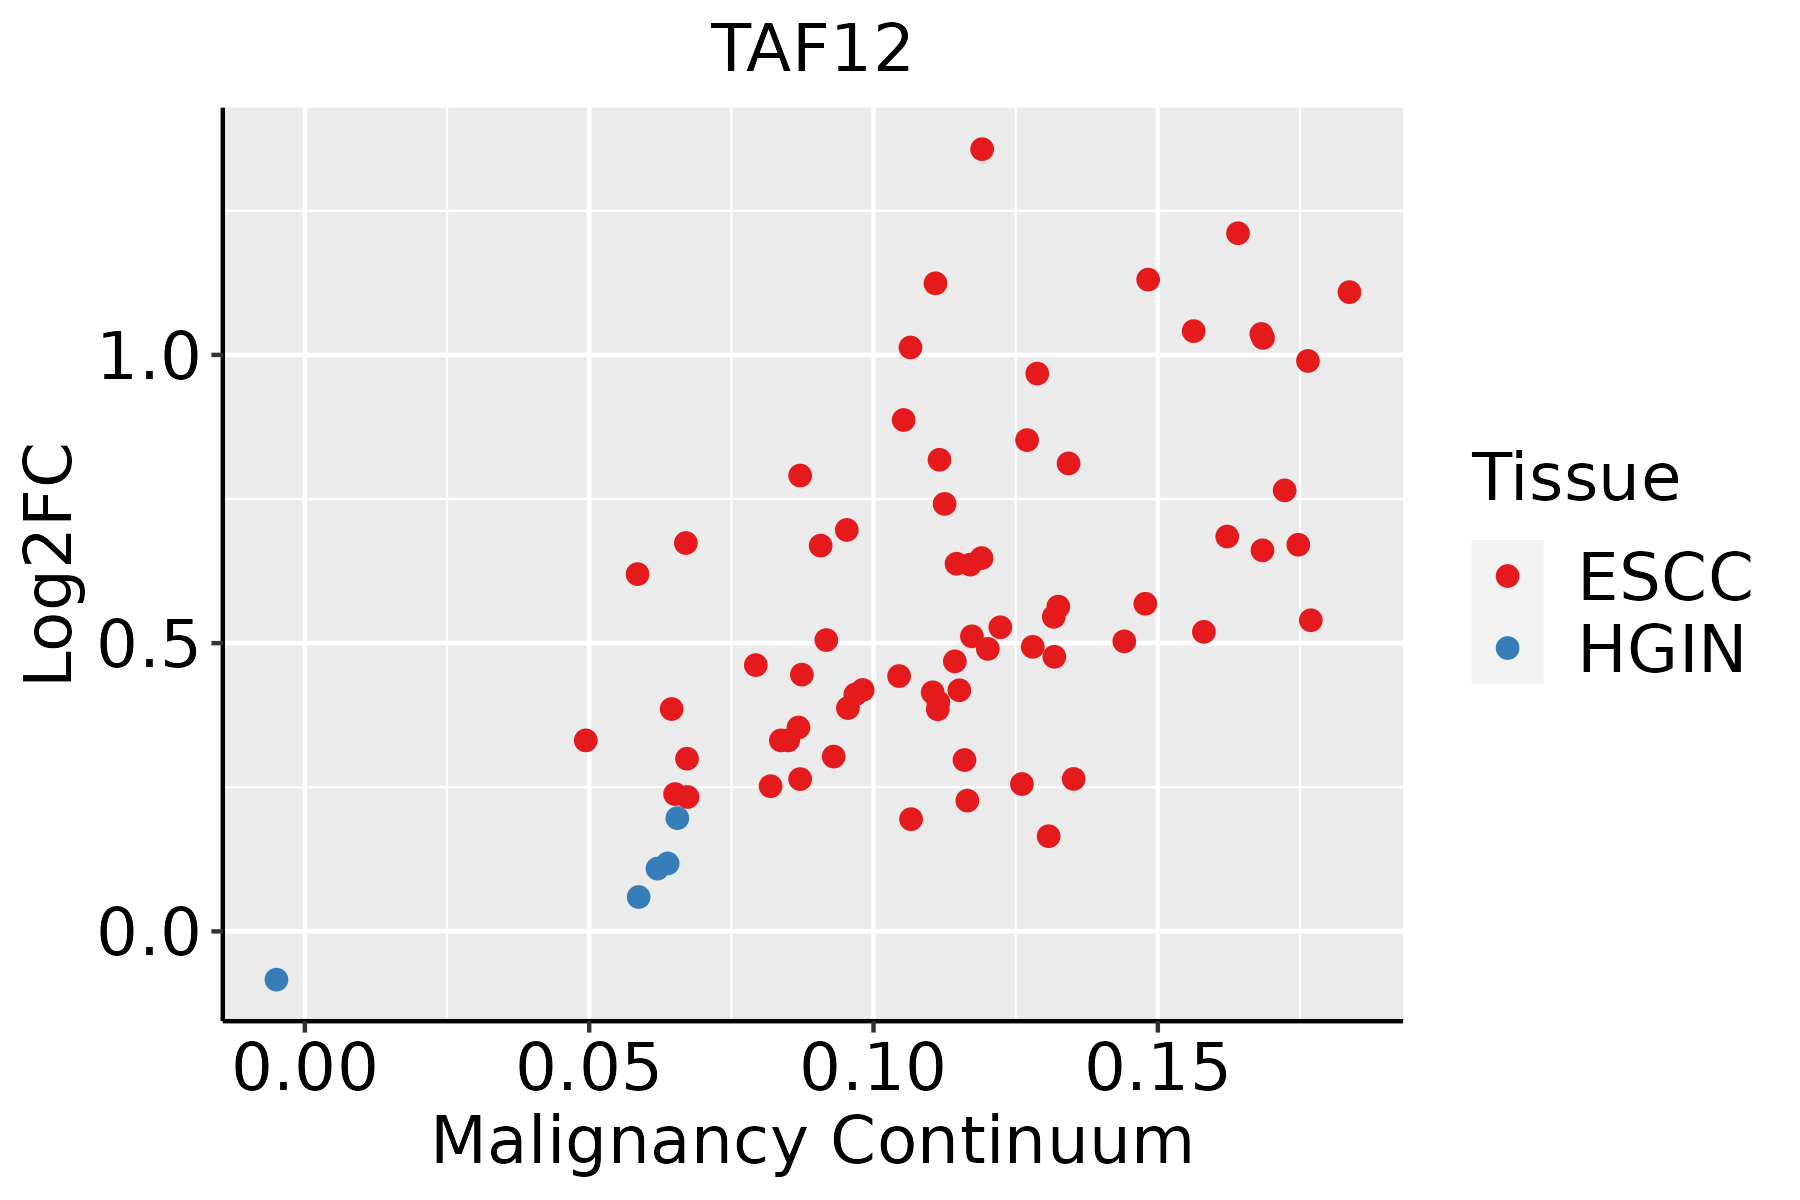 | ESCC: Esophageal squamous cell carcinoma |
| HGIN: High-grade intraepithelial neoplasias | ||
| LGIN: Low-grade intraepithelial neoplasias | ||
| Liver | 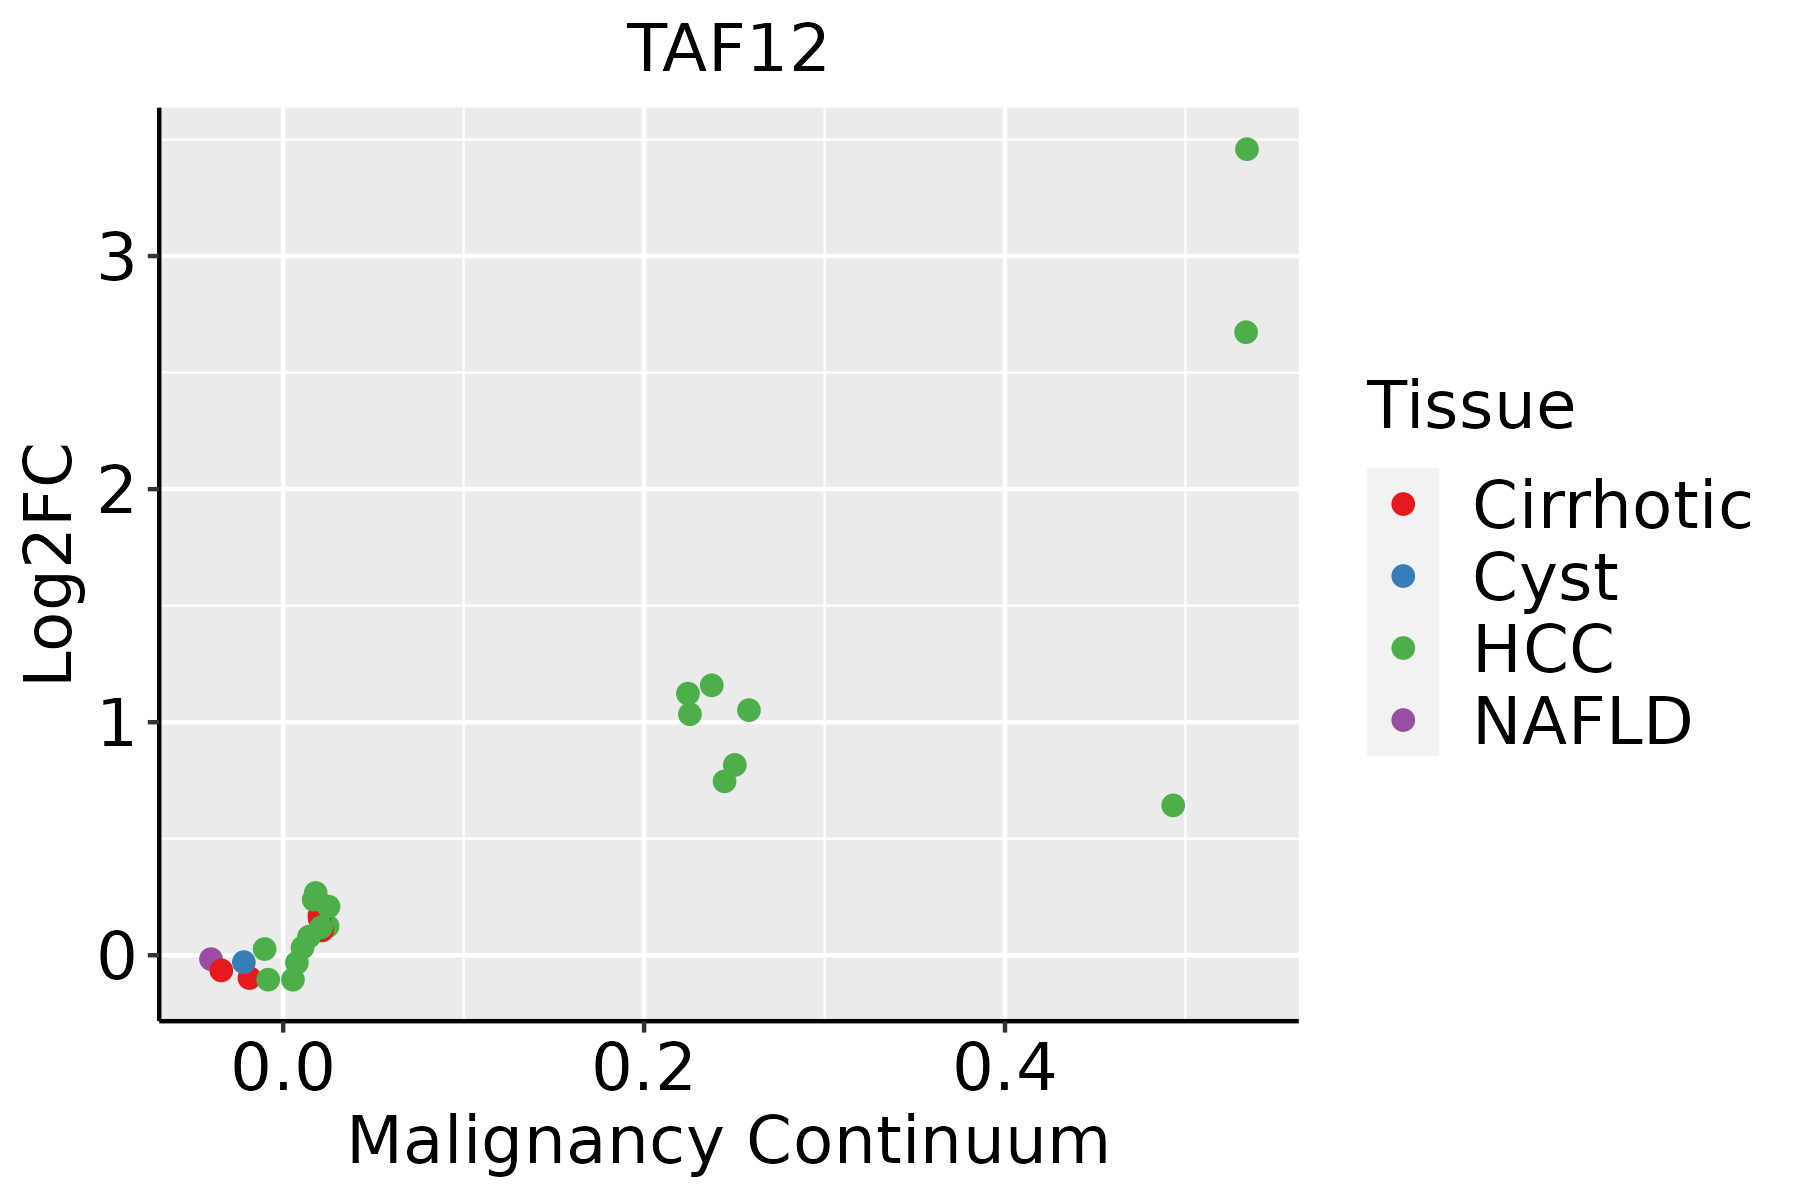 | HCC: Hepatocellular carcinoma |
| NAFLD: Non-alcoholic fatty liver disease | ||
| Oral Cavity |  | EOLP: Erosive Oral lichen planus |
| LP: leukoplakia | ||
| NEOLP: Non-erosive oral lichen planus | ||
| OSCC: Oral squamous cell carcinoma | ||
| Skin |  | AK: Actinic keratosis |
| cSCC: Cutaneous squamous cell carcinoma | ||
| SCCIS:squamous cell carcinoma in situ | ||
| Thyroid | 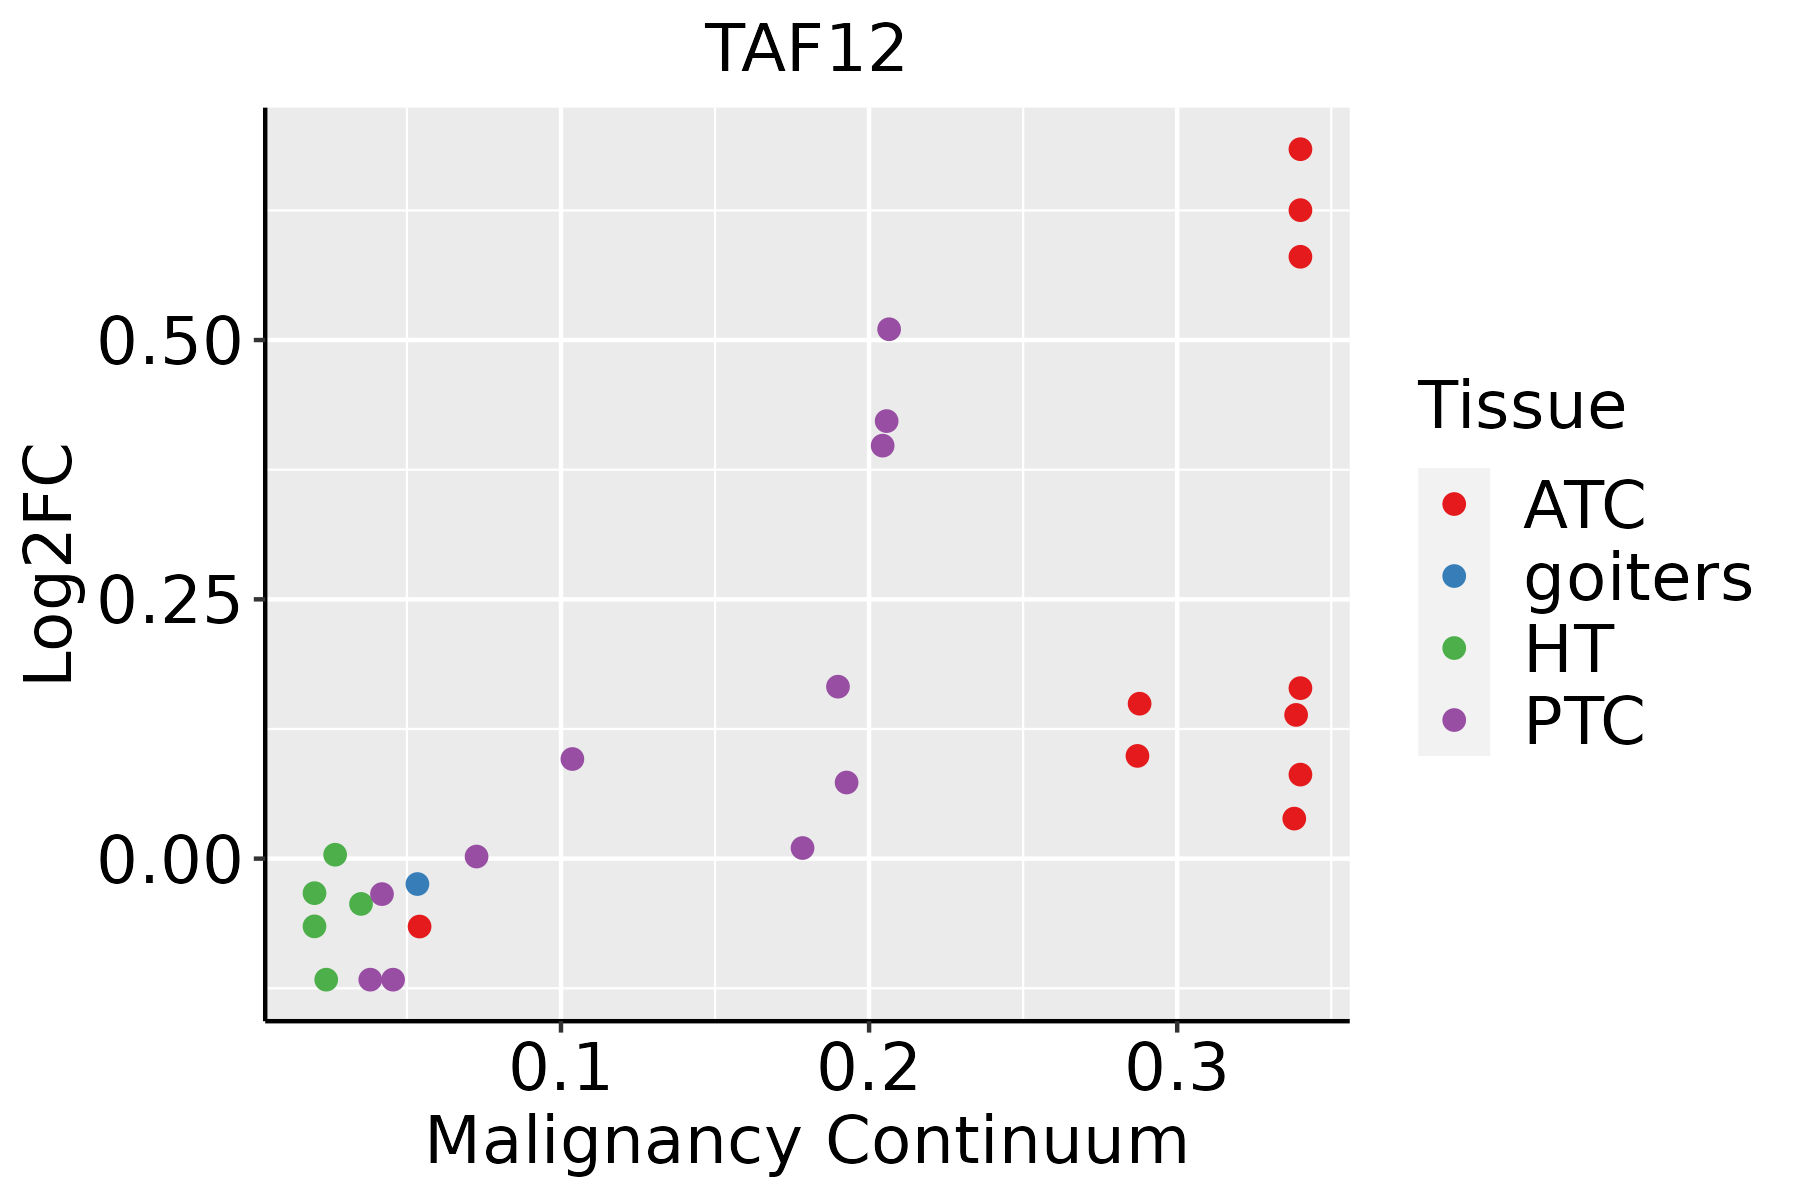 | ATC: Anaplastic thyroid cancer |
| HT: Hashimoto's thyroiditis | ||
| PTC: Papillary thyroid cancer |
| ∗log2FC in expression of this searched gene in stem-like cells from each diseased tissue sample relative to stem-like cells in normal samples in each tissue plotted against the malignancy continuum. Samples are colored based on if they are from different disease stage. |
Top |
Malignant transformation related pathway analysis |
| Find out the enriched GO biological processes and KEGG pathways involved in transition from healthy to precancer to cancer |
| Tissue | Disease Stage | Enriched GO biological Processes |
| Colorectum | AD |  |
| Colorectum | SER |  |
| Colorectum | MSS |  |
| Colorectum | MSI-H |  |
| Colorectum | FAP |  |
| ∗Top 15 enriched GO BP terms are showed in the bar plot of each disease state in each tissue. Each row represents a significant GO biological process which is colored according to the -log10(p.adjust). |
| Page: 1 2 3 4 5 6 7 8 9 |
| GO ID | Tissue | Disease Stage | Description | Gene Ratio | Bg Ratio | pvalue | p.adjust | Count |
| GO:001657015 | Esophagus | ESCC | histone modification | 323/8552 | 463/18723 | 2.61e-26 | 7.88e-24 | 323 |
| GO:001820514 | Esophagus | ESCC | peptidyl-lysine modification | 259/8552 | 376/18723 | 3.90e-20 | 5.26e-18 | 259 |
| GO:001839413 | Esophagus | ESCC | peptidyl-lysine acetylation | 123/8552 | 169/18723 | 6.58e-13 | 2.94e-11 | 123 |
| GO:004354313 | Esophagus | ESCC | protein acylation | 165/8552 | 243/18723 | 1.69e-12 | 7.14e-11 | 165 |
| GO:000647313 | Esophagus | ESCC | protein acetylation | 140/8552 | 201/18723 | 4.37e-12 | 1.69e-10 | 140 |
| GO:001839313 | Esophagus | ESCC | internal peptidyl-lysine acetylation | 114/8552 | 158/18723 | 1.16e-11 | 4.24e-10 | 114 |
| GO:000647513 | Esophagus | ESCC | internal protein amino acid acetylation | 115/8552 | 160/18723 | 1.43e-11 | 5.08e-10 | 115 |
| GO:00165735 | Esophagus | ESCC | histone acetylation | 110/8552 | 152/18723 | 1.95e-11 | 6.81e-10 | 110 |
| GO:00510908 | Esophagus | ESCC | regulation of DNA-binding transcription factor activity | 252/8552 | 440/18723 | 5.22e-07 | 6.97e-06 | 252 |
| GO:00063673 | Esophagus | ESCC | transcription initiation from RNA polymerase II promoter | 56/8552 | 77/18723 | 1.30e-06 | 1.59e-05 | 56 |
| GO:000635211 | Esophagus | ESCC | DNA-templated transcription, initiation | 86/8552 | 130/18723 | 1.88e-06 | 2.19e-05 | 86 |
| GO:00708973 | Esophagus | ESCC | transcription preinitiation complex assembly | 30/8552 | 36/18723 | 3.60e-06 | 3.95e-05 | 30 |
| GO:00510918 | Esophagus | ESCC | positive regulation of DNA-binding transcription factor activity | 155/8552 | 260/18723 | 3.83e-06 | 4.14e-05 | 155 |
| GO:00439662 | Esophagus | ESCC | histone H3 acetylation | 43/8552 | 61/18723 | 7.57e-05 | 5.67e-04 | 43 |
| GO:00511232 | Esophagus | ESCC | RNA polymerase II preinitiation complex assembly | 18/8552 | 24/18723 | 3.43e-03 | 1.41e-02 | 18 |
| GO:00064731 | Liver | Cirrhotic | protein acetylation | 84/4634 | 201/18723 | 7.50e-08 | 2.25e-06 | 84 |
| GO:00183941 | Liver | Cirrhotic | peptidyl-lysine acetylation | 73/4634 | 169/18723 | 1.08e-07 | 3.07e-06 | 73 |
| GO:00435431 | Liver | Cirrhotic | protein acylation | 95/4634 | 243/18723 | 4.73e-07 | 1.07e-05 | 95 |
| GO:00182051 | Liver | Cirrhotic | peptidyl-lysine modification | 134/4634 | 376/18723 | 1.29e-06 | 2.59e-05 | 134 |
| GO:00064751 | Liver | Cirrhotic | internal protein amino acid acetylation | 65/4634 | 160/18723 | 6.66e-06 | 1.04e-04 | 65 |
| Page: 1 2 3 4 5 6 |
| Pathway ID | Tissue | Disease Stage | Description | Gene Ratio | Bg Ratio | pvalue | p.adjust | qvalue | Count |
| hsa030222 | Esophagus | ESCC | Basal transcription factors | 35/4205 | 45/8465 | 1.01e-04 | 4.06e-04 | 2.08e-04 | 35 |
| hsa0302211 | Esophagus | ESCC | Basal transcription factors | 35/4205 | 45/8465 | 1.01e-04 | 4.06e-04 | 2.08e-04 | 35 |
| hsa03022 | Oral cavity | OSCC | Basal transcription factors | 28/3704 | 45/8465 | 9.53e-03 | 2.11e-02 | 1.08e-02 | 28 |
| hsa030221 | Oral cavity | OSCC | Basal transcription factors | 28/3704 | 45/8465 | 9.53e-03 | 2.11e-02 | 1.08e-02 | 28 |
| Page: 1 |
Top |
Cell-cell communication analysis |
| Identification of potential cell-cell interactions between two cell types and their ligand-receptor pairs for different disease states |
| Ligand | Receptor | LRpair | Pathway | Tissue | Disease Stage |
| Page: 1 |
Top |
Single-cell gene regulatory network inference analysis |
| Find out the significant the regulons (TFs) and the target genes of each regulon across cell types for different disease states |
| TF | Cell Type | Tissue | Disease Stage | Target Gene | RSS | Regulon Activity |
| ∗The dot plots of a searched regulon are shown for all cell subpopulations in each disease state of each tissue based on the regulon specific score inferred using pySCENIC and by calculating the average expression. |
| Page: 1 |
Top |
Somatic mutation of malignant transformation related genes |
| Annotation of somatic variants for genes involved in malignant transformation |
| Hugo Symbol | Variant Class | Variant Classification | dbSNP RS | HGVSc | HGVSp | HGVSp Short | SWISSPROT | BIOTYPE | SIFT | PolyPhen | Tumor Sample Barcode | Tissue | Histology | Sex | Age | Stage | Therapy Types | Drugs | Outcome |
| TAF12 | SNV | Missense_Mutation | novel | c.153C>A | p.Ser51Arg | p.S51R | Q16514 | protein_coding | deleterious(0.02) | benign(0.05) | TCGA-A2-A25A-01 | Breast | breast invasive carcinoma | Female | <65 | I/II | Unspecific | Cytoxan | SD |
| TAF12 | SNV | Missense_Mutation | rs759182275 | c.475N>G | p.Thr159Ala | p.T159A | Q16514 | protein_coding | tolerated(0.11) | benign(0) | TCGA-C5-A1MF-01 | Cervix | cervical & endocervical cancer | Female | <65 | I/II | Unknown | Unknown | SD |
| TAF12 | SNV | Missense_Mutation | novel | c.268N>T | p.Asp90Tyr | p.D90Y | Q16514 | protein_coding | deleterious(0) | probably_damaging(0.999) | TCGA-AX-A06F-01 | Endometrium | uterine corpus endometrioid carcinoma | Female | <65 | III/IV | Chemotherapy | carboplatin | SD |
| TAF12 | SNV | Missense_Mutation | novel | c.67N>A | p.Ala23Thr | p.A23T | Q16514 | protein_coding | tolerated_low_confidence(0.09) | benign(0) | TCGA-B5-A1MR-01 | Endometrium | uterine corpus endometrioid carcinoma | Female | >=65 | III/IV | Unknown | Unknown | SD |
| TAF12 | SNV | Missense_Mutation | novel | c.364C>T | p.Arg122Cys | p.R122C | Q16514 | protein_coding | deleterious(0.02) | benign(0.037) | TCGA-B5-A3FC-01 | Endometrium | uterine corpus endometrioid carcinoma | Female | <65 | I/II | Unknown | Unknown | SD |
| TAF12 | SNV | Missense_Mutation | novel | c.195N>A | p.Asp65Glu | p.D65E | Q16514 | protein_coding | tolerated(0.69) | possibly_damaging(0.487) | TCGA-EO-A3B0-01 | Endometrium | uterine corpus endometrioid carcinoma | Female | <65 | III/IV | Unknown | Unknown | SD |
| Page: 1 |
Top |
Related drugs of malignant transformation related genes |
| Identification of chemicals and drugs interact with genes involved in malignant transfromation |
| (DGIdb 4.0) |
| Entrez ID | Symbol | Category | Interaction Types | Drug Claim Name | Drug Name | PMIDs |
| Page: 1 |

Copyright 2023-Present -The University of Texas Health Science Center at Houston |