
|
|||||
|
 | |
| |
| |
| |
| |
| |
|
Gene: TAF11 |
Gene summary for TAF11 |
| Gene information | Species | Human | Gene symbol | TAF11 | Gene ID | 6882 |
| Gene name | TATA-box binding protein associated factor 11 | |
| Gene Alias | MGC:15243 | |
| Cytomap | 6p21.31 | |
| Gene Type | protein-coding | GO ID | GO:0006139 | UniProtAcc | Q15544 |
Top |
Malignant transformation analysis |
| Identification of the aberrant gene expression in precancerous and cancerous lesions by comparing the gene expression of stem-like cells in diseased tissues with normal stem cells |
| Entrez ID | Symbol | Replicates | Species | Organ | Tissue | Adj P-value | Log2FC | Malignancy |
| 6882 | TAF11 | LZE4T | Human | Esophagus | ESCC | 4.13e-05 | 2.41e-01 | 0.0811 |
| 6882 | TAF11 | LZE5T | Human | Esophagus | ESCC | 2.87e-02 | 3.77e-01 | 0.0514 |
| 6882 | TAF11 | LZE7T | Human | Esophagus | ESCC | 4.47e-05 | 5.20e-01 | 0.0667 |
| 6882 | TAF11 | LZE8T | Human | Esophagus | ESCC | 5.96e-03 | 2.24e-01 | 0.067 |
| 6882 | TAF11 | LZE20T | Human | Esophagus | ESCC | 4.87e-09 | 3.95e-01 | 0.0662 |
| 6882 | TAF11 | LZE22T | Human | Esophagus | ESCC | 2.30e-02 | 6.45e-01 | 0.068 |
| 6882 | TAF11 | LZE24T | Human | Esophagus | ESCC | 3.34e-20 | 5.91e-01 | 0.0596 |
| 6882 | TAF11 | LZE21T | Human | Esophagus | ESCC | 5.13e-07 | 3.57e-01 | 0.0655 |
| 6882 | TAF11 | LZE6T | Human | Esophagus | ESCC | 1.64e-07 | 4.41e-01 | 0.0845 |
| 6882 | TAF11 | P1T-E | Human | Esophagus | ESCC | 2.54e-12 | 7.13e-01 | 0.0875 |
| 6882 | TAF11 | P2T-E | Human | Esophagus | ESCC | 2.11e-36 | 6.85e-01 | 0.1177 |
| 6882 | TAF11 | P4T-E | Human | Esophagus | ESCC | 6.50e-21 | 5.16e-01 | 0.1323 |
| 6882 | TAF11 | P5T-E | Human | Esophagus | ESCC | 9.77e-19 | 2.96e-01 | 0.1327 |
| 6882 | TAF11 | P8T-E | Human | Esophagus | ESCC | 1.44e-26 | 5.07e-01 | 0.0889 |
| 6882 | TAF11 | P9T-E | Human | Esophagus | ESCC | 6.79e-19 | 4.19e-01 | 0.1131 |
| 6882 | TAF11 | P10T-E | Human | Esophagus | ESCC | 4.91e-48 | 7.43e-01 | 0.116 |
| 6882 | TAF11 | P11T-E | Human | Esophagus | ESCC | 5.07e-10 | 4.37e-01 | 0.1426 |
| 6882 | TAF11 | P12T-E | Human | Esophagus | ESCC | 2.71e-26 | 4.15e-01 | 0.1122 |
| 6882 | TAF11 | P15T-E | Human | Esophagus | ESCC | 1.01e-11 | 3.12e-01 | 0.1149 |
| 6882 | TAF11 | P16T-E | Human | Esophagus | ESCC | 6.10e-27 | 3.81e-01 | 0.1153 |
| Page: 1 2 3 4 5 6 7 |
| Tissue | Expression Dynamics | Abbreviation |
| Esophagus | 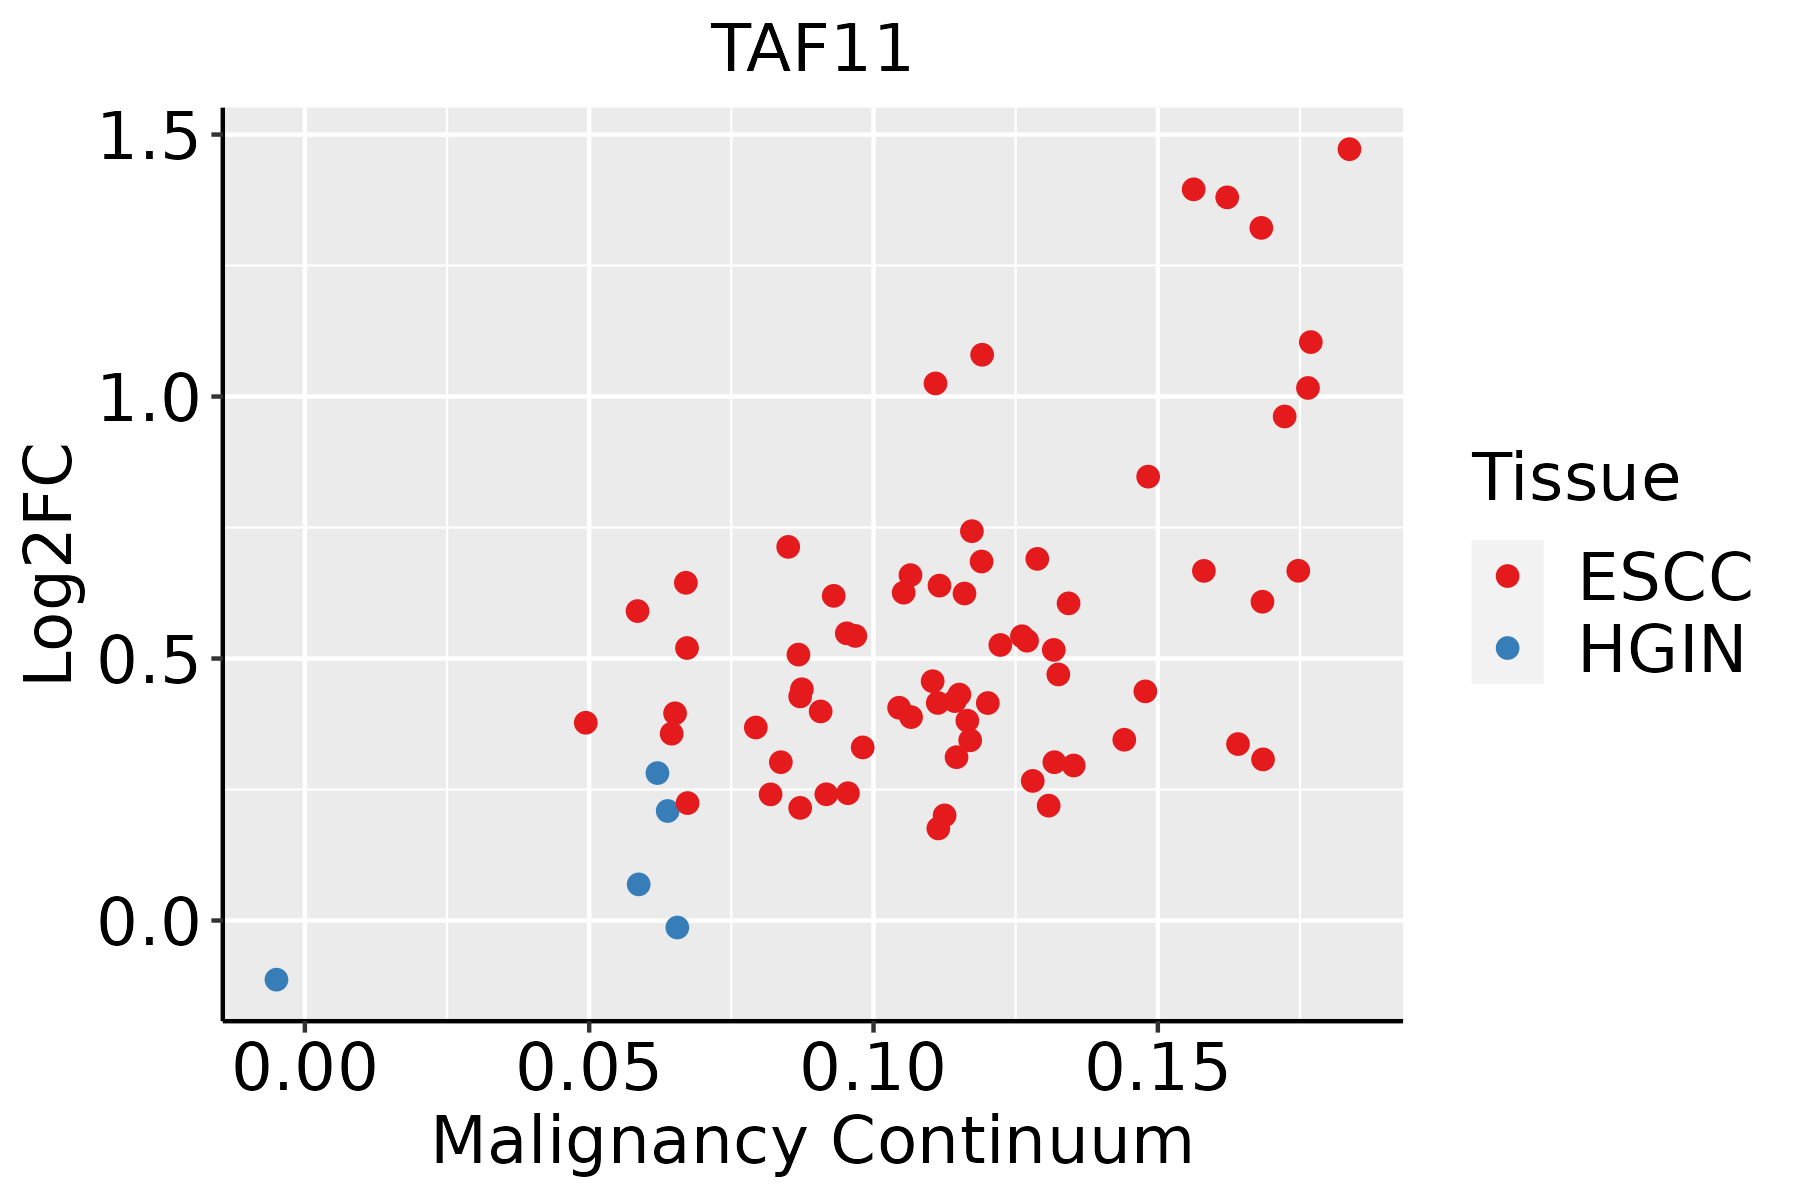 | ESCC: Esophageal squamous cell carcinoma |
| HGIN: High-grade intraepithelial neoplasias | ||
| LGIN: Low-grade intraepithelial neoplasias | ||
| Liver |  | HCC: Hepatocellular carcinoma |
| NAFLD: Non-alcoholic fatty liver disease | ||
| Oral Cavity | 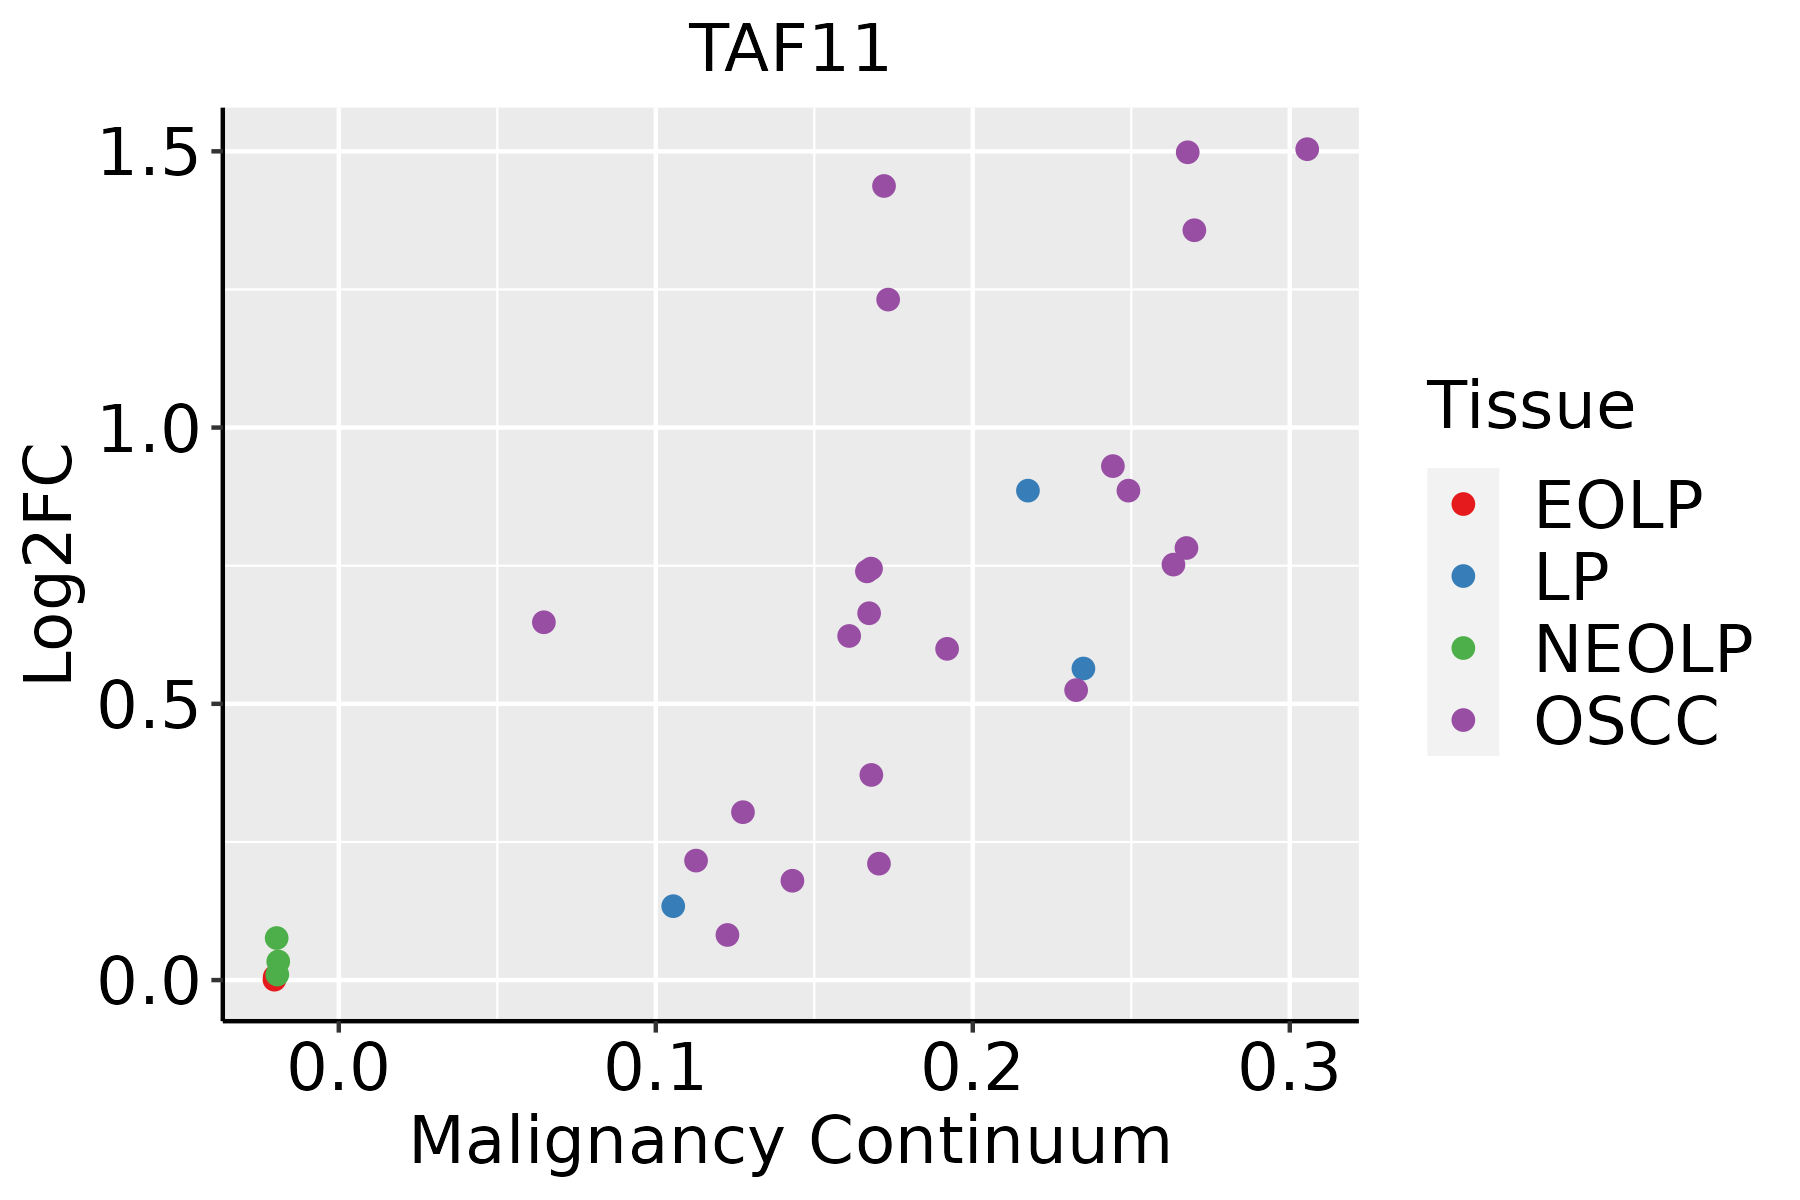 | EOLP: Erosive Oral lichen planus |
| LP: leukoplakia | ||
| NEOLP: Non-erosive oral lichen planus | ||
| OSCC: Oral squamous cell carcinoma | ||
| Skin |  | AK: Actinic keratosis |
| cSCC: Cutaneous squamous cell carcinoma | ||
| SCCIS:squamous cell carcinoma in situ | ||
| Thyroid | 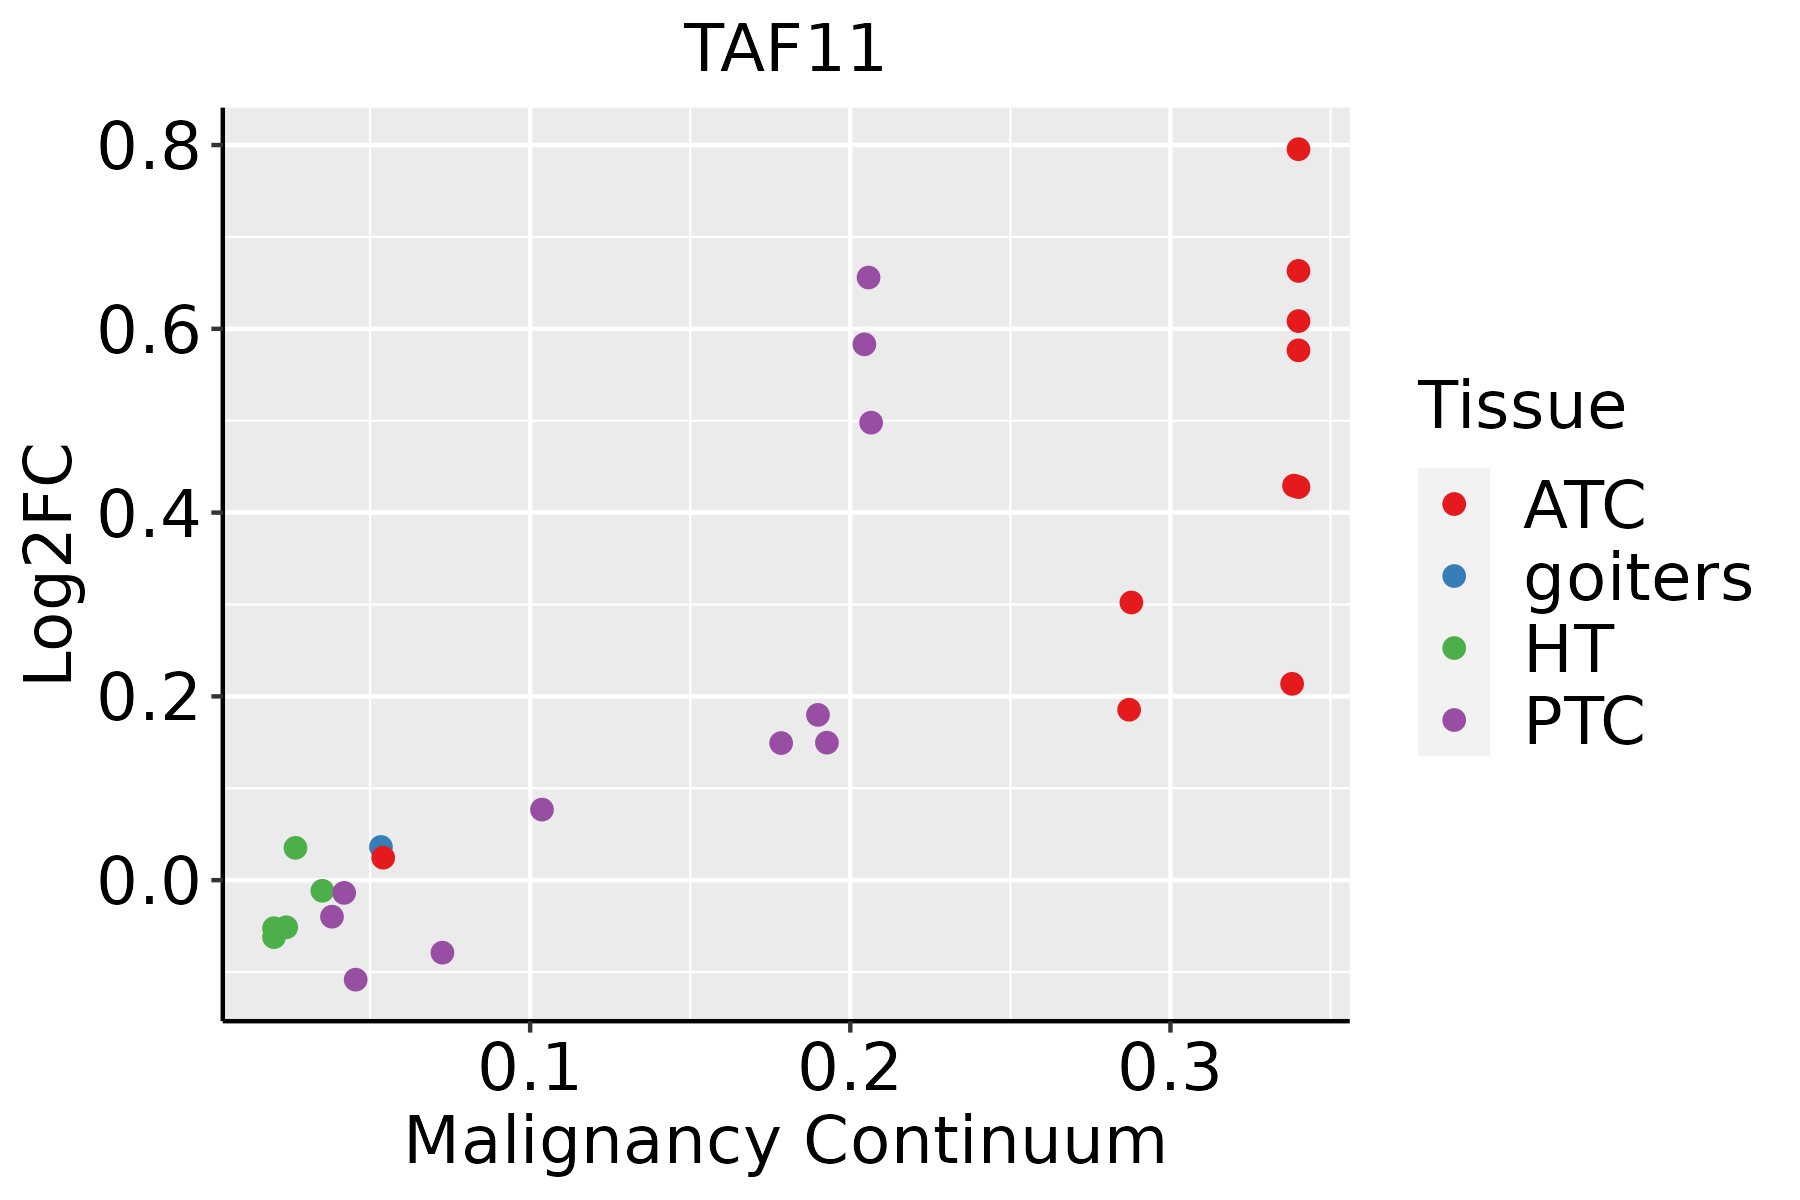 | ATC: Anaplastic thyroid cancer |
| HT: Hashimoto's thyroiditis | ||
| PTC: Papillary thyroid cancer |
| ∗log2FC in expression of this searched gene in stem-like cells from each diseased tissue sample relative to stem-like cells in normal samples in each tissue plotted against the malignancy continuum. Samples are colored based on if they are from different disease stage. |
Top |
Malignant transformation related pathway analysis |
| Find out the enriched GO biological processes and KEGG pathways involved in transition from healthy to precancer to cancer |
| Tissue | Disease Stage | Enriched GO biological Processes |
| Colorectum | AD |  |
| Colorectum | SER |  |
| Colorectum | MSS |  |
| Colorectum | MSI-H |  |
| Colorectum | FAP |  |
| ∗Top 15 enriched GO BP terms are showed in the bar plot of each disease state in each tissue. Each row represents a significant GO biological process which is colored according to the -log10(p.adjust). |
| Page: 1 2 3 4 5 6 7 8 9 |
| GO ID | Tissue | Disease Stage | Description | Gene Ratio | Bg Ratio | pvalue | p.adjust | Count |
| GO:0016032111 | Esophagus | ESCC | viral process | 301/8552 | 415/18723 | 3.34e-29 | 1.32e-26 | 301 |
| GO:001908017 | Esophagus | ESCC | viral gene expression | 80/8552 | 94/18723 | 2.04e-15 | 1.28e-13 | 80 |
| GO:0044403111 | Esophagus | ESCC | biological process involved in symbiotic interaction | 186/8552 | 290/18723 | 1.43e-10 | 4.16e-09 | 186 |
| GO:001908312 | Esophagus | ESCC | viral transcription | 41/8552 | 50/18723 | 1.35e-07 | 2.17e-06 | 41 |
| GO:00063673 | Esophagus | ESCC | transcription initiation from RNA polymerase II promoter | 56/8552 | 77/18723 | 1.30e-06 | 1.59e-05 | 56 |
| GO:000635211 | Esophagus | ESCC | DNA-templated transcription, initiation | 86/8552 | 130/18723 | 1.88e-06 | 2.19e-05 | 86 |
| GO:00708973 | Esophagus | ESCC | transcription preinitiation complex assembly | 30/8552 | 36/18723 | 3.60e-06 | 3.95e-05 | 30 |
| GO:005185115 | Esophagus | ESCC | modulation by host of symbiont process | 43/8552 | 60/18723 | 4.00e-05 | 3.22e-04 | 43 |
| GO:005181714 | Esophagus | ESCC | modulation of process of other organism involved in symbiotic interaction | 54/8552 | 81/18723 | 1.09e-04 | 7.64e-04 | 54 |
| GO:00439233 | Esophagus | ESCC | positive regulation by host of viral transcription | 14/8552 | 16/18723 | 6.78e-04 | 3.56e-03 | 14 |
| GO:003582114 | Esophagus | ESCC | modulation of process of other organism | 64/8552 | 106/18723 | 1.61e-03 | 7.50e-03 | 64 |
| GO:005170214 | Esophagus | ESCC | biological process involved in interaction with symbiont | 57/8552 | 94/18723 | 2.46e-03 | 1.07e-02 | 57 |
| GO:00511232 | Esophagus | ESCC | RNA polymerase II preinitiation complex assembly | 18/8552 | 24/18723 | 3.43e-03 | 1.41e-02 | 18 |
| GO:001603212 | Liver | Cirrhotic | viral process | 203/4634 | 415/18723 | 5.40e-27 | 3.76e-24 | 203 |
| GO:004440312 | Liver | Cirrhotic | biological process involved in symbiotic interaction | 131/4634 | 290/18723 | 2.00e-14 | 1.84e-12 | 131 |
| GO:001908011 | Liver | Cirrhotic | viral gene expression | 52/4634 | 94/18723 | 2.19e-10 | 1.08e-08 | 52 |
| GO:00518171 | Liver | Cirrhotic | modulation of process of other organism involved in symbiotic interaction | 44/4634 | 81/18723 | 1.11e-08 | 4.26e-07 | 44 |
| GO:005170211 | Liver | Cirrhotic | biological process involved in interaction with symbiont | 48/4634 | 94/18723 | 3.41e-08 | 1.14e-06 | 48 |
| GO:00518511 | Liver | Cirrhotic | modulation by host of symbiont process | 33/4634 | 60/18723 | 5.09e-07 | 1.14e-05 | 33 |
| GO:00358213 | Liver | Cirrhotic | modulation of process of other organism | 49/4634 | 106/18723 | 1.20e-06 | 2.43e-05 | 49 |
| Page: 1 2 3 4 5 6 |
| Pathway ID | Tissue | Disease Stage | Description | Gene Ratio | Bg Ratio | pvalue | p.adjust | qvalue | Count |
| hsa030222 | Esophagus | ESCC | Basal transcription factors | 35/4205 | 45/8465 | 1.01e-04 | 4.06e-04 | 2.08e-04 | 35 |
| hsa0302211 | Esophagus | ESCC | Basal transcription factors | 35/4205 | 45/8465 | 1.01e-04 | 4.06e-04 | 2.08e-04 | 35 |
| hsa03022 | Oral cavity | OSCC | Basal transcription factors | 28/3704 | 45/8465 | 9.53e-03 | 2.11e-02 | 1.08e-02 | 28 |
| hsa030221 | Oral cavity | OSCC | Basal transcription factors | 28/3704 | 45/8465 | 9.53e-03 | 2.11e-02 | 1.08e-02 | 28 |
| Page: 1 |
Top |
Cell-cell communication analysis |
| Identification of potential cell-cell interactions between two cell types and their ligand-receptor pairs for different disease states |
| Ligand | Receptor | LRpair | Pathway | Tissue | Disease Stage |
| Page: 1 |
Top |
Single-cell gene regulatory network inference analysis |
| Find out the significant the regulons (TFs) and the target genes of each regulon across cell types for different disease states |
| TF | Cell Type | Tissue | Disease Stage | Target Gene | RSS | Regulon Activity |
| ∗The dot plots of a searched regulon are shown for all cell subpopulations in each disease state of each tissue based on the regulon specific score inferred using pySCENIC and by calculating the average expression. |
| Page: 1 |
Top |
Somatic mutation of malignant transformation related genes |
| Annotation of somatic variants for genes involved in malignant transformation |
| Hugo Symbol | Variant Class | Variant Classification | dbSNP RS | HGVSc | HGVSp | HGVSp Short | SWISSPROT | BIOTYPE | SIFT | PolyPhen | Tumor Sample Barcode | Tissue | Histology | Sex | Age | Stage | Therapy Types | Drugs | Outcome |
| TAF11 | SNV | Missense_Mutation | rs367847591 | c.7N>A | p.Asp3Asn | p.D3N | Q15544 | protein_coding | tolerated(0.94) | benign(0) | TCGA-5L-AAT1-01 | Breast | breast invasive carcinoma | Female | <65 | III/IV | Hormone Therapy | letrozol | SD |
| TAF11 | SNV | Missense_Mutation | novel | c.148N>C | p.Glu50Gln | p.E50Q | Q15544 | protein_coding | tolerated(0.2) | probably_damaging(0.979) | TCGA-JW-A5VL-01 | Cervix | cervical & endocervical cancer | Female | <65 | I/II | Unknown | Unknown | SD |
| TAF11 | SNV | Missense_Mutation | novel | c.184N>A | p.Asp62Asn | p.D62N | Q15544 | protein_coding | deleterious(0.04) | possibly_damaging(0.651) | TCGA-VS-A958-01 | Cervix | cervical & endocervical cancer | Female | <65 | I/II | Chemotherapy | cisplatin | CR |
| TAF11 | SNV | Missense_Mutation | rs754844977 | c.487N>A | p.Gly163Arg | p.G163R | Q15544 | protein_coding | deleterious(0) | probably_damaging(0.997) | TCGA-CM-6162-01 | Colorectum | colon adenocarcinoma | Female | <65 | III/IV | Chemotherapy | oxaliplatin | SD |
| TAF11 | SNV | Missense_Mutation | c.65N>T | p.Ala22Val | p.A22V | Q15544 | protein_coding | tolerated(0.21) | benign(0) | TCGA-G4-6309-01 | Colorectum | colon adenocarcinoma | Female | <65 | III/IV | Chemotherapy | xeloda | PD | |
| TAF11 | SNV | Missense_Mutation | rs115299208 | c.571N>A | p.Val191Ile | p.V191I | Q15544 | protein_coding | deleterious(0.03) | benign(0.183) | TCGA-B5-A3FC-01 | Endometrium | uterine corpus endometrioid carcinoma | Female | <65 | I/II | Unknown | Unknown | SD |
| TAF11 | SNV | Missense_Mutation | rs765429402 | c.238G>A | p.Ala80Thr | p.A80T | Q15544 | protein_coding | deleterious(0.03) | benign(0) | TCGA-18-3411-01 | Lung | lung squamous cell carcinoma | Female | <65 | III/IV | Unknown | Unknown | SD |
| TAF11 | insertion | Frame_Shift_Ins | novel | c.622_623insA | p.Ile208AsnfsTer26 | p.I208Nfs*26 | Q15544 | protein_coding | TCGA-94-8490-01 | Lung | lung squamous cell carcinoma | Male | >=65 | I/II | Unknown | Unknown | SD | ||
| TAF11 | SNV | Missense_Mutation | novel | c.575N>C | p.Arg192Thr | p.R192T | Q15544 | protein_coding | deleterious(0) | probably_damaging(0.992) | TCGA-H7-8502-01 | Oral cavity | head & neck squamous cell carcinoma | Male | <65 | I/II | Chemotherapy | unknown | SD |
| TAF11 | insertion | Frame_Shift_Ins | novel | c.576_577insTACTTTCT | p.Arg193TyrfsTer5 | p.R193Yfs*5 | Q15544 | protein_coding | TCGA-H7-8502-01 | Oral cavity | head & neck squamous cell carcinoma | Male | <65 | I/II | Chemotherapy | unknown | SD |
| Page: 1 2 |
Top |
Related drugs of malignant transformation related genes |
| Identification of chemicals and drugs interact with genes involved in malignant transfromation |
| (DGIdb 4.0) |
| Entrez ID | Symbol | Category | Interaction Types | Drug Claim Name | Drug Name | PMIDs |
| Page: 1 |

Copyright 2023-Present -The University of Texas Health Science Center at Houston |