
|
|||||
|
 | |
| |
| |
| |
| |
| |
|
Gene: TAF1 |
Gene summary for TAF1 |
| Gene information | Species | Human | Gene symbol | TAF1 | Gene ID | 6872 |
| Gene name | TATA-box binding protein associated factor 1 | |
| Gene Alias | BA2R | |
| Cytomap | Xq13.1 | |
| Gene Type | protein-coding | GO ID | GO:0000122 | UniProtAcc | P21675 |
Top |
Malignant transformation analysis |
| Identification of the aberrant gene expression in precancerous and cancerous lesions by comparing the gene expression of stem-like cells in diseased tissues with normal stem cells |
| Entrez ID | Symbol | Replicates | Species | Organ | Tissue | Adj P-value | Log2FC | Malignancy |
| 6872 | TAF1 | GSM6177620_NYU_UCEC1_lib1_lib1 | Human | Endometrium | EEC | 2.60e-07 | -5.33e-02 | -0.1869 |
| 6872 | TAF1 | GSM6177620_NYU_UCEC1_lib2_lib2 | Human | Endometrium | EEC | 4.11e-05 | -1.18e-01 | -0.1875 |
| 6872 | TAF1 | GSM6177620_NYU_UCEC1_lib3_lib3 | Human | Endometrium | EEC | 8.31e-10 | -5.23e-02 | -0.1883 |
| 6872 | TAF1 | GSM6177621_NYU_UCEC2_lib1_lib1 | Human | Endometrium | EEC | 4.77e-06 | -3.76e-02 | -0.1934 |
| 6872 | TAF1 | GSM6177622_NYU_UCEC3_lib1_lib1 | Human | Endometrium | EEC | 7.67e-07 | -8.08e-02 | -0.1917 |
| 6872 | TAF1 | GSM6177622_NYU_UCEC3_lib2_lib2 | Human | Endometrium | EEC | 8.00e-09 | -1.10e-01 | -0.1916 |
| 6872 | TAF1 | LZE4T | Human | Esophagus | ESCC | 7.07e-11 | 3.10e-01 | 0.0811 |
| 6872 | TAF1 | LZE5T | Human | Esophagus | ESCC | 3.35e-02 | 2.64e-01 | 0.0514 |
| 6872 | TAF1 | LZE7T | Human | Esophagus | ESCC | 4.05e-10 | 4.91e-01 | 0.0667 |
| 6872 | TAF1 | LZE8T | Human | Esophagus | ESCC | 1.03e-03 | 1.23e-01 | 0.067 |
| 6872 | TAF1 | LZE24T | Human | Esophagus | ESCC | 1.02e-18 | 5.28e-01 | 0.0596 |
| 6872 | TAF1 | LZE21T | Human | Esophagus | ESCC | 4.21e-04 | 1.86e-01 | 0.0655 |
| 6872 | TAF1 | P1T-E | Human | Esophagus | ESCC | 6.77e-05 | 3.04e-01 | 0.0875 |
| 6872 | TAF1 | P2T-E | Human | Esophagus | ESCC | 2.30e-15 | 2.99e-01 | 0.1177 |
| 6872 | TAF1 | P4T-E | Human | Esophagus | ESCC | 9.05e-14 | 2.10e-01 | 0.1323 |
| 6872 | TAF1 | P5T-E | Human | Esophagus | ESCC | 2.53e-10 | 1.53e-01 | 0.1327 |
| 6872 | TAF1 | P8T-E | Human | Esophagus | ESCC | 6.06e-24 | 4.42e-01 | 0.0889 |
| 6872 | TAF1 | P9T-E | Human | Esophagus | ESCC | 2.93e-08 | 1.84e-01 | 0.1131 |
| 6872 | TAF1 | P10T-E | Human | Esophagus | ESCC | 3.76e-16 | 2.90e-01 | 0.116 |
| 6872 | TAF1 | P11T-E | Human | Esophagus | ESCC | 4.65e-06 | 2.92e-01 | 0.1426 |
| Page: 1 2 3 4 5 |
| Tissue | Expression Dynamics | Abbreviation |
| Endometrium |  | AEH: Atypical endometrial hyperplasia |
| EEC: Endometrioid Cancer | ||
| Esophagus | 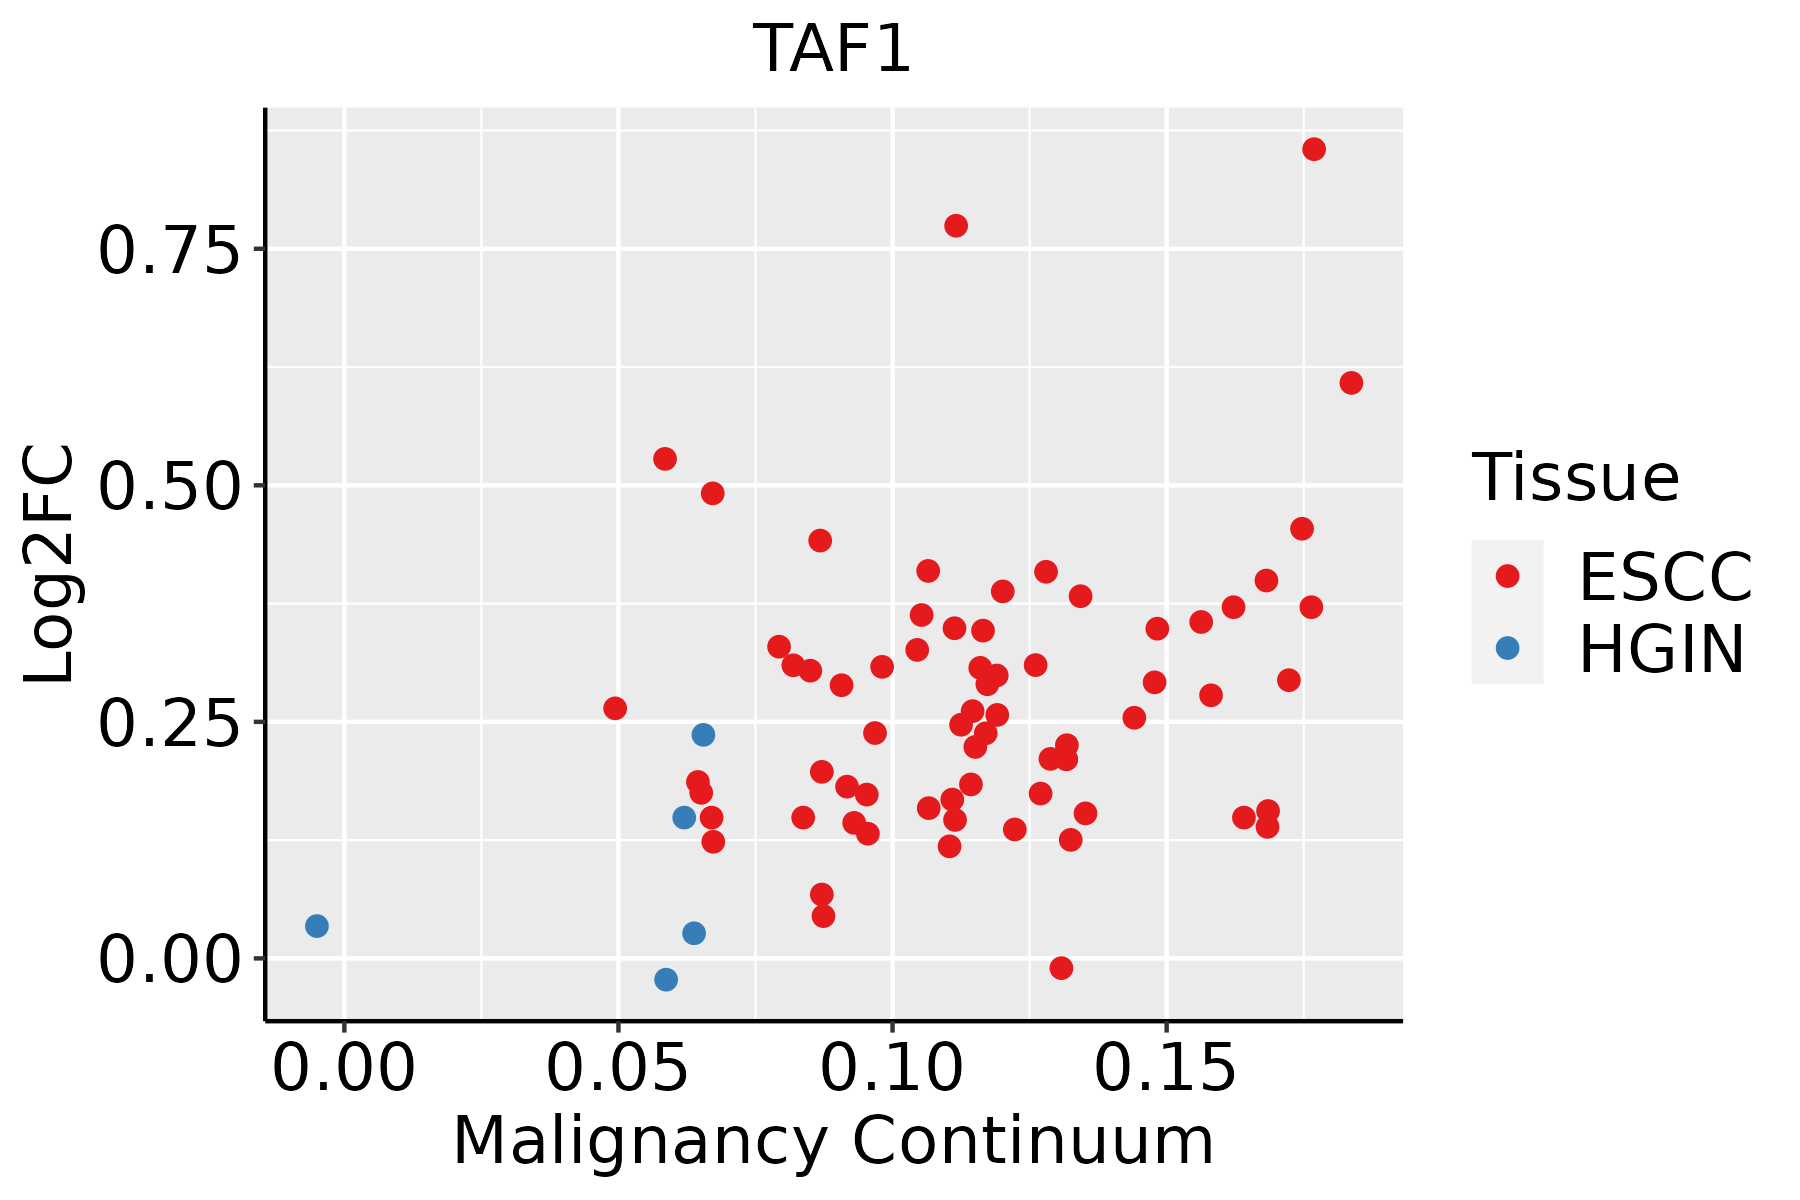 | ESCC: Esophageal squamous cell carcinoma |
| HGIN: High-grade intraepithelial neoplasias | ||
| LGIN: Low-grade intraepithelial neoplasias | ||
| Liver | 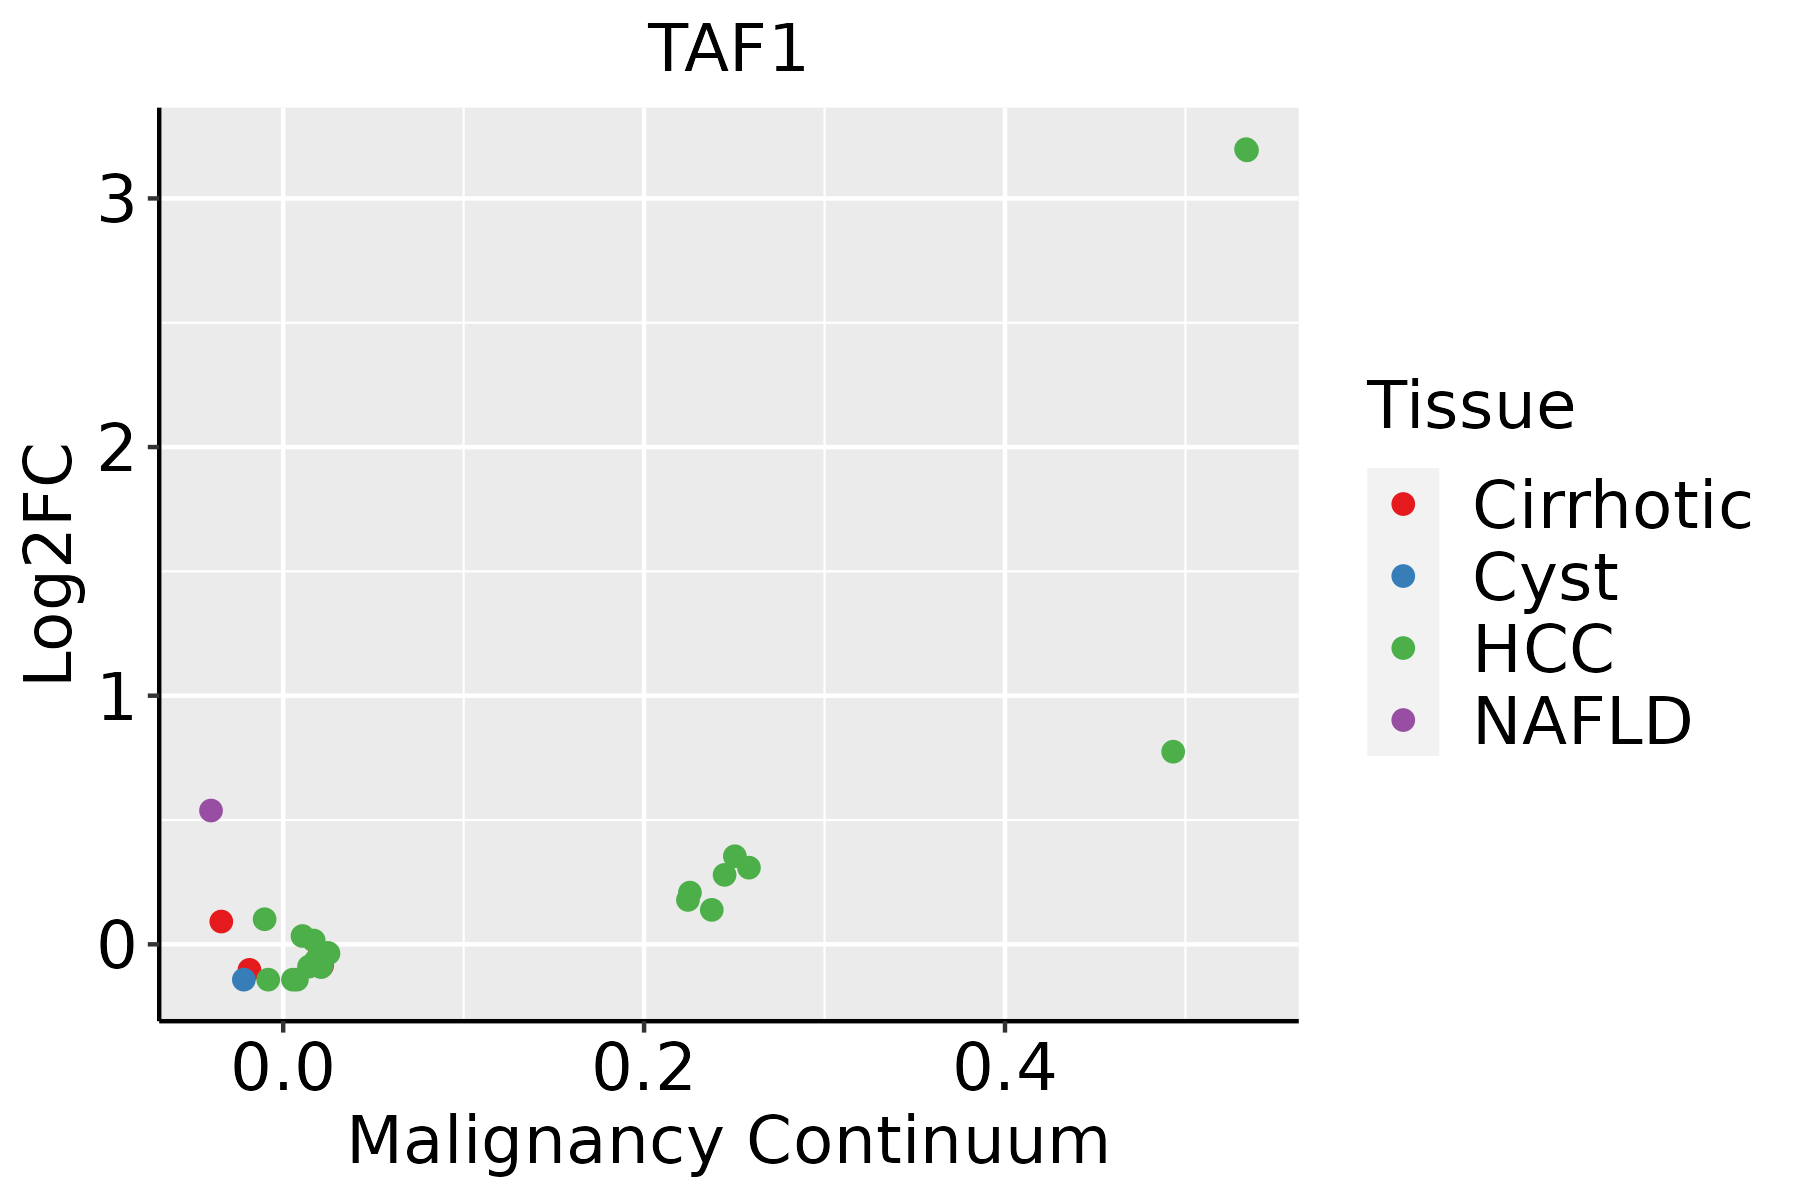 | HCC: Hepatocellular carcinoma |
| NAFLD: Non-alcoholic fatty liver disease | ||
| Thyroid | 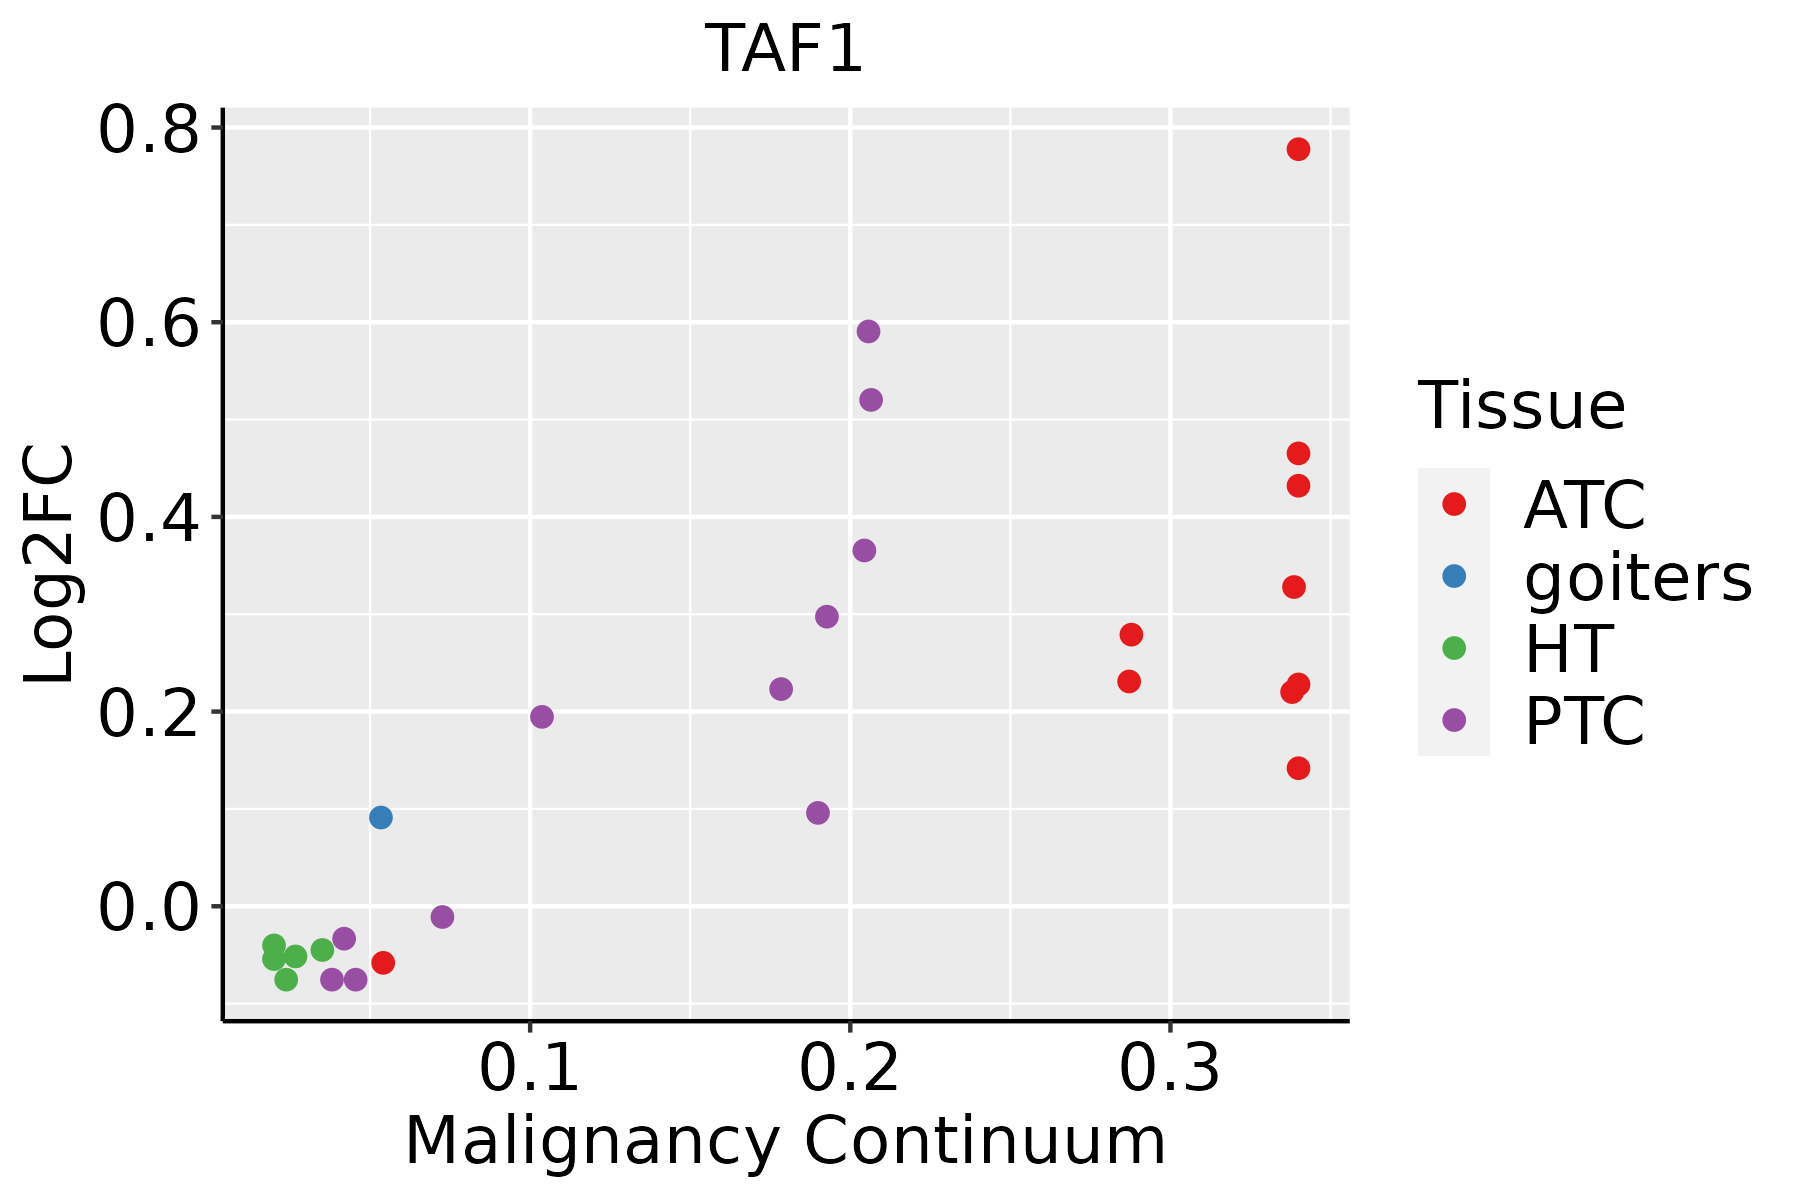 | ATC: Anaplastic thyroid cancer |
| HT: Hashimoto's thyroiditis | ||
| PTC: Papillary thyroid cancer |
| ∗log2FC in expression of this searched gene in stem-like cells from each diseased tissue sample relative to stem-like cells in normal samples in each tissue plotted against the malignancy continuum. Samples are colored based on if they are from different disease stage. |
Top |
Malignant transformation related pathway analysis |
| Find out the enriched GO biological processes and KEGG pathways involved in transition from healthy to precancer to cancer |
| Tissue | Disease Stage | Enriched GO biological Processes |
| Colorectum | AD |  |
| Colorectum | SER |  |
| Colorectum | MSS |  |
| Colorectum | MSI-H |  |
| Colorectum | FAP |  |
| ∗Top 15 enriched GO BP terms are showed in the bar plot of each disease state in each tissue. Each row represents a significant GO biological process which is colored according to the -log10(p.adjust). |
| Page: 1 2 3 4 5 6 7 8 9 |
| GO ID | Tissue | Disease Stage | Description | Gene Ratio | Bg Ratio | pvalue | p.adjust | Count |
| GO:003133010 | Cervix | CC | negative regulation of cellular catabolic process | 63/2311 | 262/18723 | 1.10e-07 | 5.68e-06 | 63 |
| GO:005109810 | Cervix | CC | regulation of binding | 80/2311 | 363/18723 | 1.32e-07 | 6.42e-06 | 80 |
| GO:00447725 | Cervix | CC | mitotic cell cycle phase transition | 89/2311 | 424/18723 | 2.70e-07 | 1.12e-05 | 89 |
| GO:00064029 | Cervix | CC | mRNA catabolic process | 56/2311 | 232/18723 | 4.81e-07 | 1.83e-05 | 56 |
| GO:19033119 | Cervix | CC | regulation of mRNA metabolic process | 64/2311 | 288/18723 | 1.71e-06 | 5.64e-05 | 64 |
| GO:000989510 | Cervix | CC | negative regulation of catabolic process | 69/2311 | 320/18723 | 2.15e-06 | 6.55e-05 | 69 |
| GO:00064019 | Cervix | CC | RNA catabolic process | 62/2311 | 278/18723 | 2.18e-06 | 6.56e-05 | 62 |
| GO:00000824 | Cervix | CC | G1/S transition of mitotic cell cycle | 49/2311 | 214/18723 | 1.16e-05 | 2.48e-04 | 49 |
| GO:00448434 | Cervix | CC | cell cycle G1/S phase transition | 53/2311 | 241/18723 | 1.76e-05 | 3.32e-04 | 53 |
| GO:004873210 | Cervix | CC | gland development | 84/2311 | 436/18723 | 1.93e-05 | 3.54e-04 | 84 |
| GO:005110110 | Cervix | CC | regulation of DNA binding | 31/2311 | 118/18723 | 2.91e-05 | 4.81e-04 | 31 |
| GO:00610139 | Cervix | CC | regulation of mRNA catabolic process | 38/2311 | 166/18723 | 1.07e-04 | 1.36e-03 | 38 |
| GO:00165705 | Cervix | CC | histone modification | 84/2311 | 463/18723 | 1.70e-04 | 2.01e-03 | 84 |
| GO:190331210 | Cervix | CC | negative regulation of mRNA metabolic process | 24/2311 | 92/18723 | 2.49e-04 | 2.77e-03 | 24 |
| GO:00610089 | Cervix | CC | hepaticobiliary system development | 34/2311 | 150/18723 | 2.92e-04 | 3.14e-03 | 34 |
| GO:00467008 | Cervix | CC | heterocycle catabolic process | 80/2311 | 445/18723 | 3.23e-04 | 3.42e-03 | 80 |
| GO:00346559 | Cervix | CC | nucleobase-containing compound catabolic process | 74/2311 | 407/18723 | 3.77e-04 | 3.88e-03 | 74 |
| GO:00434889 | Cervix | CC | regulation of mRNA stability | 35/2311 | 158/18723 | 3.80e-04 | 3.89e-03 | 35 |
| GO:00018899 | Cervix | CC | liver development | 33/2311 | 147/18723 | 4.27e-04 | 4.30e-03 | 33 |
| GO:00434879 | Cervix | CC | regulation of RNA stability | 36/2311 | 170/18723 | 7.72e-04 | 6.86e-03 | 36 |
| Page: 1 2 3 4 5 6 7 8 9 10 11 12 13 14 15 16 17 18 19 20 21 22 23 24 25 26 27 28 29 30 31 32 33 34 35 36 37 38 39 40 41 42 43 44 45 46 47 48 49 50 51 52 53 54 |
| Pathway ID | Tissue | Disease Stage | Description | Gene Ratio | Bg Ratio | pvalue | p.adjust | qvalue | Count |
| hsa030222 | Esophagus | ESCC | Basal transcription factors | 35/4205 | 45/8465 | 1.01e-04 | 4.06e-04 | 2.08e-04 | 35 |
| hsa0302211 | Esophagus | ESCC | Basal transcription factors | 35/4205 | 45/8465 | 1.01e-04 | 4.06e-04 | 2.08e-04 | 35 |
| Page: 1 |
Top |
Cell-cell communication analysis |
| Identification of potential cell-cell interactions between two cell types and their ligand-receptor pairs for different disease states |
| Ligand | Receptor | LRpair | Pathway | Tissue | Disease Stage |
| Page: 1 |
Top |
Single-cell gene regulatory network inference analysis |
| Find out the significant the regulons (TFs) and the target genes of each regulon across cell types for different disease states |
| TF | Cell Type | Tissue | Disease Stage | Target Gene | RSS | Regulon Activity |
| TAF1 | CD8TCM | Cervix | N_HPV | BLMH,RBM15B,STK11, etc. | 1.12e-01 |  |
| TAF1 | STM | Esophagus | LGIN | HIST1H1E,HIST1H2AH,AP000769.1, etc. | 7.22e-01 |  |
| TAF1 | STM | Prostate | BPH | MDM2,BTBD8,FRMD6-AS2, etc. | 2.43e-01 |  |
| TAF1 | CD4TN | Thyroid | ADJ | PARP3,FXYD2,PGM2L1, etc. | 3.28e-01 |  |
| ∗The dot plots of a searched regulon are shown for all cell subpopulations in each disease state of each tissue based on the regulon specific score inferred using pySCENIC and by calculating the average expression. |
| Page: 1 |
Top |
Somatic mutation of malignant transformation related genes |
| Annotation of somatic variants for genes involved in malignant transformation |
| Hugo Symbol | Variant Class | Variant Classification | dbSNP RS | HGVSc | HGVSp | HGVSp Short | SWISSPROT | BIOTYPE | SIFT | PolyPhen | Tumor Sample Barcode | Tissue | Histology | Sex | Age | Stage | Therapy Types | Drugs | Outcome |
| TAF1 | SNV | Missense_Mutation | novel | c.3409N>A | p.Gln1137Lys | p.Q1137K | P21675 | protein_coding | deleterious(0.04) | probably_damaging(0.991) | TCGA-5L-AAT1-01 | Breast | breast invasive carcinoma | Female | <65 | III/IV | Hormone Therapy | letrozol | SD |
| TAF1 | SNV | Missense_Mutation | novel | c.4912G>A | p.Asp1638Asn | p.D1638N | P21675 | protein_coding | tolerated(1) | benign(0.092) | TCGA-A1-A0SI-01 | Breast | breast invasive carcinoma | Female | <65 | I/II | Unknown | Unknown | SD |
| TAF1 | SNV | Missense_Mutation | c.5638N>A | p.Glu1880Lys | p.E1880K | P21675 | protein_coding | deleterious_low_confidence(0) | probably_damaging(0.931) | TCGA-AC-A23H-01 | Breast | breast invasive carcinoma | Female | >=65 | I/II | Unknown | Unknown | PD | |
| TAF1 | SNV | Missense_Mutation | novel | c.85N>A | p.Asp29Asn | p.D29N | P21675 | protein_coding | tolerated_low_confidence(0.1) | benign(0.124) | TCGA-AC-A5XS-01 | Breast | breast invasive carcinoma | Female | >=65 | I/II | Hormone Therapy | femara | SD |
| TAF1 | SNV | Missense_Mutation | novel | c.4675N>T | p.Pro1559Ser | p.P1559S | P21675 | protein_coding | deleterious(0.01) | possibly_damaging(0.752) | TCGA-AC-A5XS-01 | Breast | breast invasive carcinoma | Female | >=65 | I/II | Hormone Therapy | femara | SD |
| TAF1 | SNV | Missense_Mutation | c.1679G>T | p.Arg560Leu | p.R560L | P21675 | protein_coding | deleterious(0) | benign(0.44) | TCGA-AN-A046-01 | Breast | breast invasive carcinoma | Female | >=65 | I/II | Unknown | Unknown | SD | |
| TAF1 | SNV | Missense_Mutation | c.4174C>T | p.His1392Tyr | p.H1392Y | P21675 | protein_coding | tolerated(0.17) | benign(0.021) | TCGA-AN-A0AS-01 | Breast | breast invasive carcinoma | Female | >=65 | III/IV | Unknown | Unknown | SD | |
| TAF1 | SNV | Missense_Mutation | c.2195N>G | p.Asp732Gly | p.D732G | P21675 | protein_coding | deleterious(0) | probably_damaging(0.993) | TCGA-AO-A124-01 | Breast | breast invasive carcinoma | Female | <65 | I/II | Chemotherapy | doxorubicin | SD | |
| TAF1 | SNV | Missense_Mutation | rs760338471 | c.2698A>G | p.Met900Val | p.M900V | P21675 | protein_coding | deleterious(0.03) | benign(0.049) | TCGA-AO-A12F-01 | Breast | breast invasive carcinoma | Female | <65 | I/II | Chemotherapy | paclitaxel | SD |
| TAF1 | SNV | Missense_Mutation | c.1816G>A | p.Gly606Arg | p.G606R | P21675 | protein_coding | deleterious(0) | probably_damaging(0.996) | TCGA-AR-A1AL-01 | Breast | breast invasive carcinoma | Female | <65 | III/IV | Hormone Therapy | anastrozole | SD |
| Page: 1 2 3 4 5 6 7 8 9 10 11 12 13 14 15 16 17 18 19 20 21 22 23 24 25 26 27 28 29 30 31 |
Top |
Related drugs of malignant transformation related genes |
| Identification of chemicals and drugs interact with genes involved in malignant transfromation |
| (DGIdb 4.0) |
| Entrez ID | Symbol | Category | Interaction Types | Drug Claim Name | Drug Name | PMIDs |
| 6872 | TAF1 | TRANSCRIPTION FACTOR COMPLEX, NUCLEAR HORMONE RECEPTOR, KINASE, SERINE THREONINE KINASE, TRANSCRIPTION FACTOR, ENZYME, CLINICALLY ACTIONABLE | inhibitor | 336446910 | ||
| 6872 | TAF1 | TRANSCRIPTION FACTOR COMPLEX, NUCLEAR HORMONE RECEPTOR, KINASE, SERINE THREONINE KINASE, TRANSCRIPTION FACTOR, ENZYME, CLINICALLY ACTIONABLE | DOXORUBICIN | DOXORUBICIN | 10070062 |
| Page: 1 |

Copyright 2023-Present -The University of Texas Health Science Center at Houston |