
|
|||||
|
 | |
| |
| |
| |
| |
| |
|
Gene: TADA3 |
Gene summary for TADA3 |
| Gene information | Species | Human | Gene symbol | TADA3 | Gene ID | 10474 |
| Gene name | transcriptional adaptor 3 | |
| Gene Alias | ADA3 | |
| Cytomap | 3p25.3 | |
| Gene Type | protein-coding | GO ID | GO:0000278 | UniProtAcc | A8K899 |
Top |
Malignant transformation analysis |
| Identification of the aberrant gene expression in precancerous and cancerous lesions by comparing the gene expression of stem-like cells in diseased tissues with normal stem cells |
| Entrez ID | Symbol | Replicates | Species | Organ | Tissue | Adj P-value | Log2FC | Malignancy |
| 10474 | TADA3 | HTA11_3410_2000001011 | Human | Colorectum | AD | 2.18e-02 | 1.49e-01 | 0.0155 |
| 10474 | TADA3 | HTA11_2487_2000001011 | Human | Colorectum | SER | 3.95e-10 | 4.16e-01 | -0.1808 |
| 10474 | TADA3 | HTA11_1938_2000001011 | Human | Colorectum | AD | 2.24e-03 | 3.13e-01 | -0.0811 |
| 10474 | TADA3 | HTA11_78_2000001011 | Human | Colorectum | AD | 2.82e-03 | 2.91e-01 | -0.1088 |
| 10474 | TADA3 | HTA11_347_2000001011 | Human | Colorectum | AD | 2.47e-12 | 3.47e-01 | -0.1954 |
| 10474 | TADA3 | HTA11_411_2000001011 | Human | Colorectum | SER | 1.25e-04 | 7.05e-01 | -0.2602 |
| 10474 | TADA3 | HTA11_2112_2000001011 | Human | Colorectum | SER | 2.13e-02 | 4.65e-01 | -0.2196 |
| 10474 | TADA3 | HTA11_3361_2000001011 | Human | Colorectum | AD | 7.60e-03 | 2.41e-01 | -0.1207 |
| 10474 | TADA3 | HTA11_696_2000001011 | Human | Colorectum | AD | 6.47e-14 | 3.79e-01 | -0.1464 |
| 10474 | TADA3 | HTA11_866_2000001011 | Human | Colorectum | AD | 3.71e-03 | 2.40e-01 | -0.1001 |
| 10474 | TADA3 | HTA11_1391_2000001011 | Human | Colorectum | AD | 3.96e-12 | 4.61e-01 | -0.059 |
| 10474 | TADA3 | HTA11_546_2000001011 | Human | Colorectum | AD | 8.91e-05 | 3.33e-01 | -0.0842 |
| 10474 | TADA3 | HTA11_866_3004761011 | Human | Colorectum | AD | 1.07e-03 | 2.30e-01 | 0.096 |
| 10474 | TADA3 | HTA11_4255_2000001011 | Human | Colorectum | SER | 4.98e-02 | 3.47e-01 | 0.0446 |
| 10474 | TADA3 | HTA11_8622_2000001021 | Human | Colorectum | SER | 4.77e-03 | 3.34e-01 | 0.0528 |
| 10474 | TADA3 | HTA11_7663_2000001011 | Human | Colorectum | SER | 5.06e-04 | 3.85e-01 | 0.0131 |
| 10474 | TADA3 | HTA11_10623_2000001011 | Human | Colorectum | AD | 2.40e-02 | 3.52e-01 | -0.0177 |
| 10474 | TADA3 | HTA11_6801_2000001011 | Human | Colorectum | SER | 4.14e-03 | 4.54e-01 | 0.0171 |
| 10474 | TADA3 | HTA11_7696_3000711011 | Human | Colorectum | AD | 3.76e-09 | 4.09e-01 | 0.0674 |
| 10474 | TADA3 | HTA11_6818_2000001021 | Human | Colorectum | AD | 2.16e-05 | 3.50e-01 | 0.0588 |
| Page: 1 2 3 4 5 6 7 8 |
| Tissue | Expression Dynamics | Abbreviation |
| Colorectum (GSE201348) |  | FAP: Familial adenomatous polyposis |
| CRC: Colorectal cancer | ||
| Colorectum (HTA11) |  | AD: Adenomas |
| SER: Sessile serrated lesions | ||
| MSI-H: Microsatellite-high colorectal cancer | ||
| MSS: Microsatellite stable colorectal cancer | ||
| Esophagus | 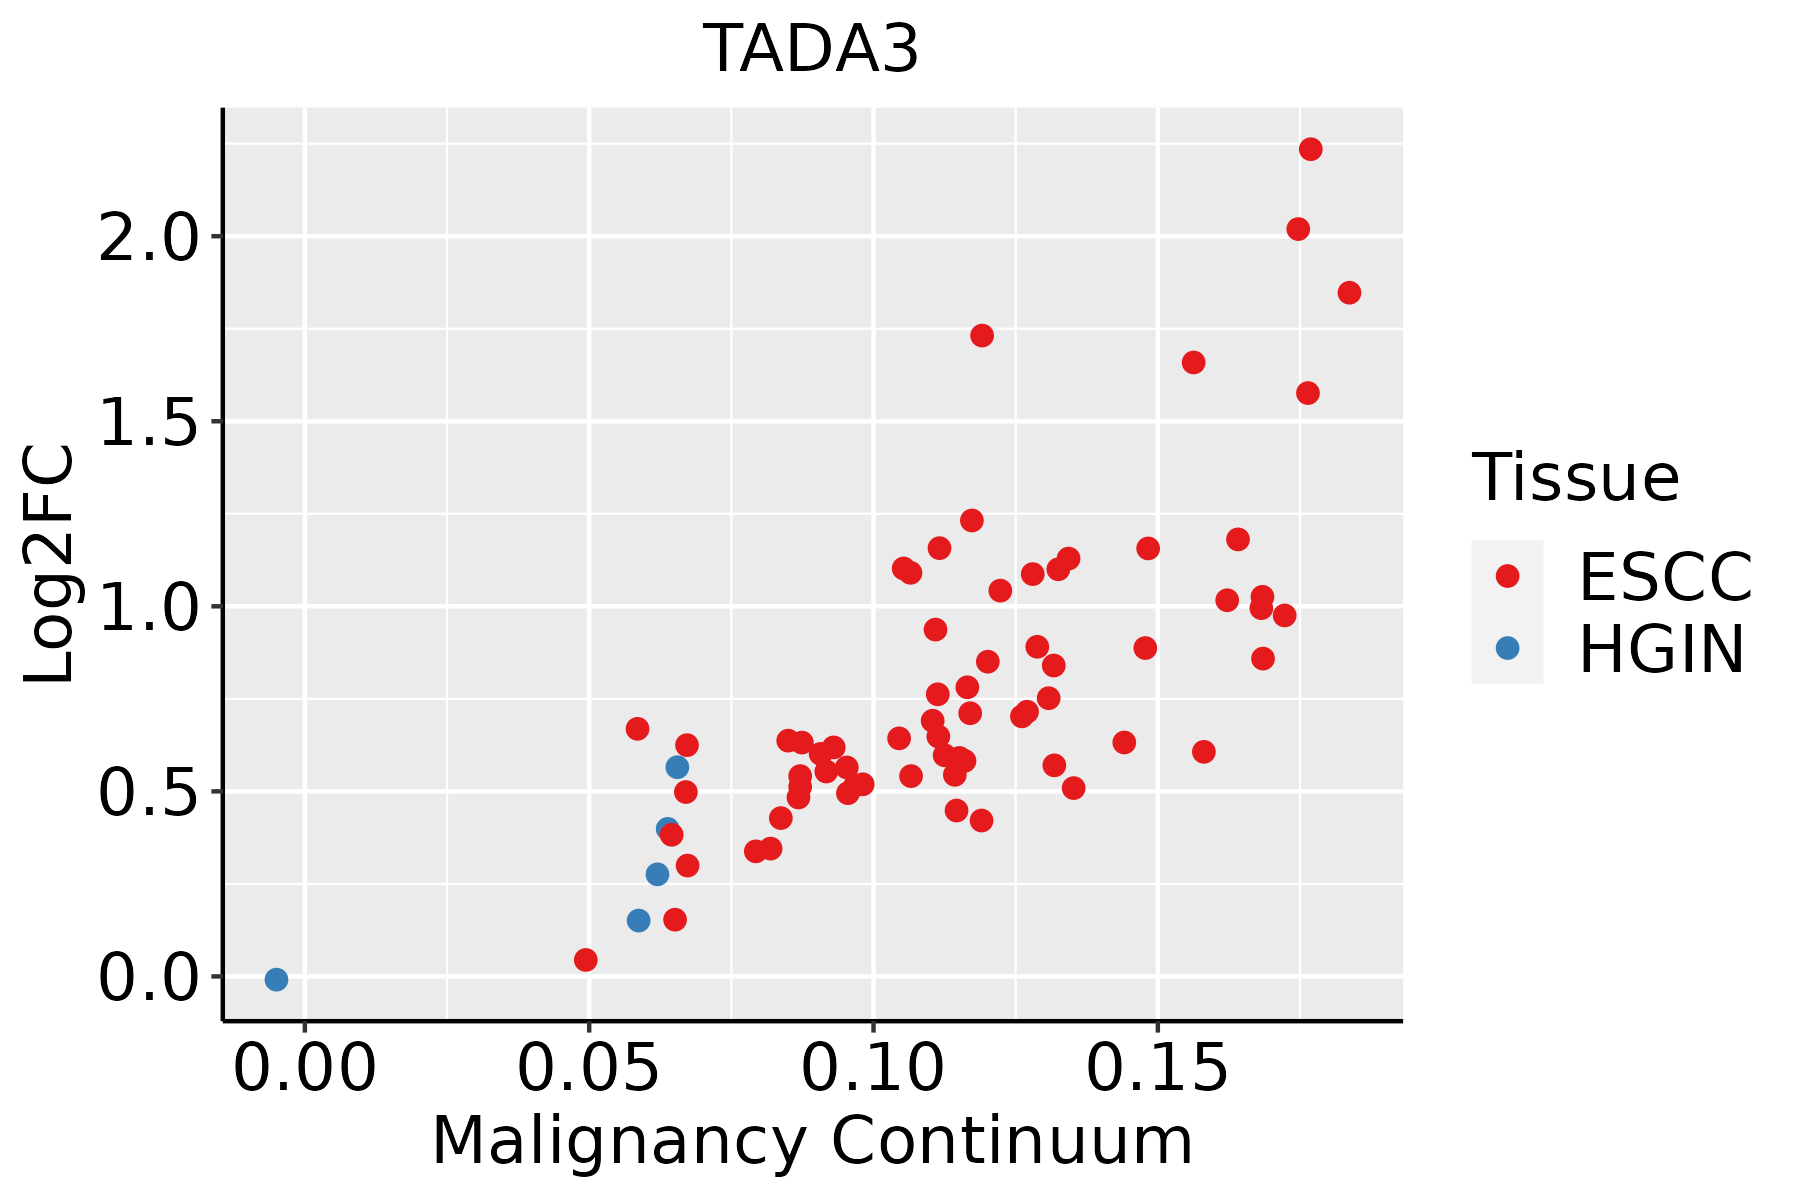 | ESCC: Esophageal squamous cell carcinoma |
| HGIN: High-grade intraepithelial neoplasias | ||
| LGIN: Low-grade intraepithelial neoplasias | ||
| Liver |  | HCC: Hepatocellular carcinoma |
| NAFLD: Non-alcoholic fatty liver disease | ||
| Oral Cavity | 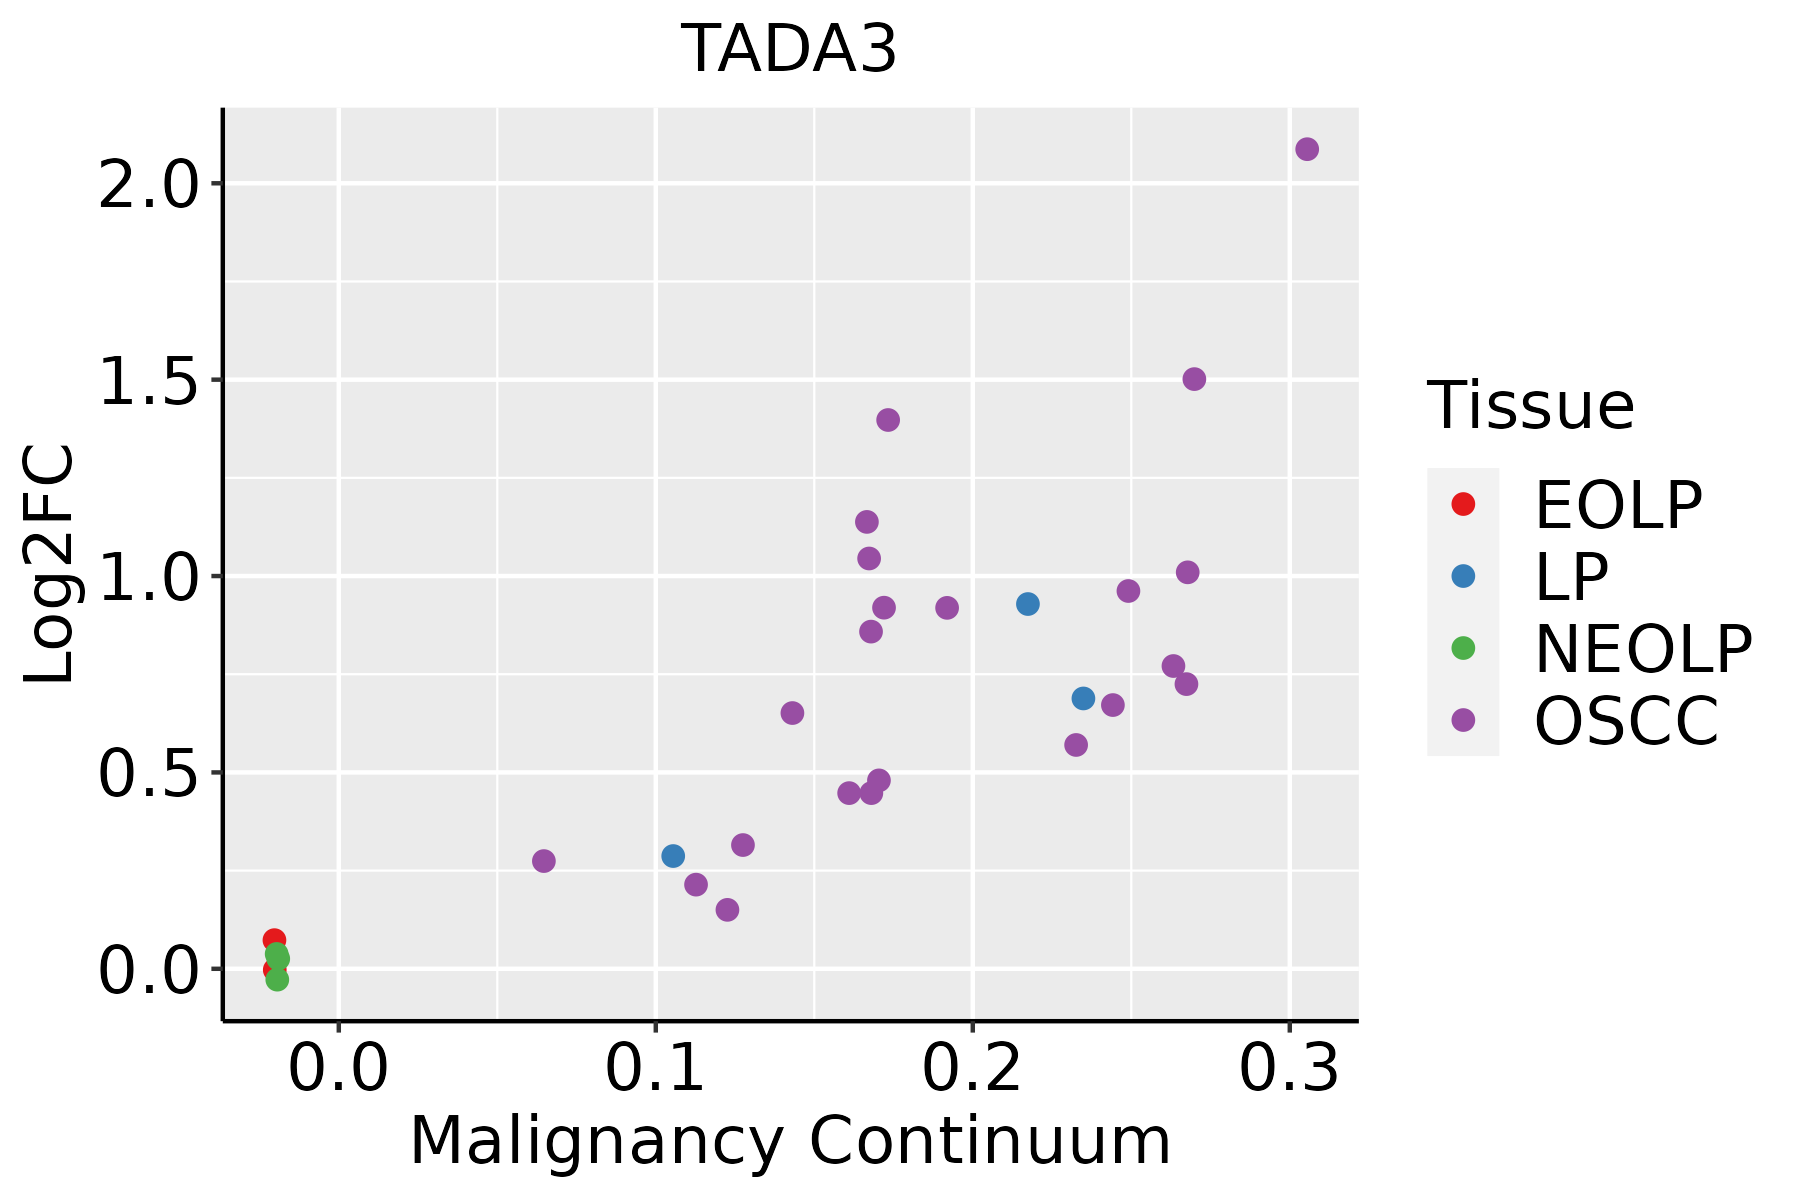 | EOLP: Erosive Oral lichen planus |
| LP: leukoplakia | ||
| NEOLP: Non-erosive oral lichen planus | ||
| OSCC: Oral squamous cell carcinoma | ||
| Prostate |  | BPH: Benign Prostatic Hyperplasia |
| Skin | 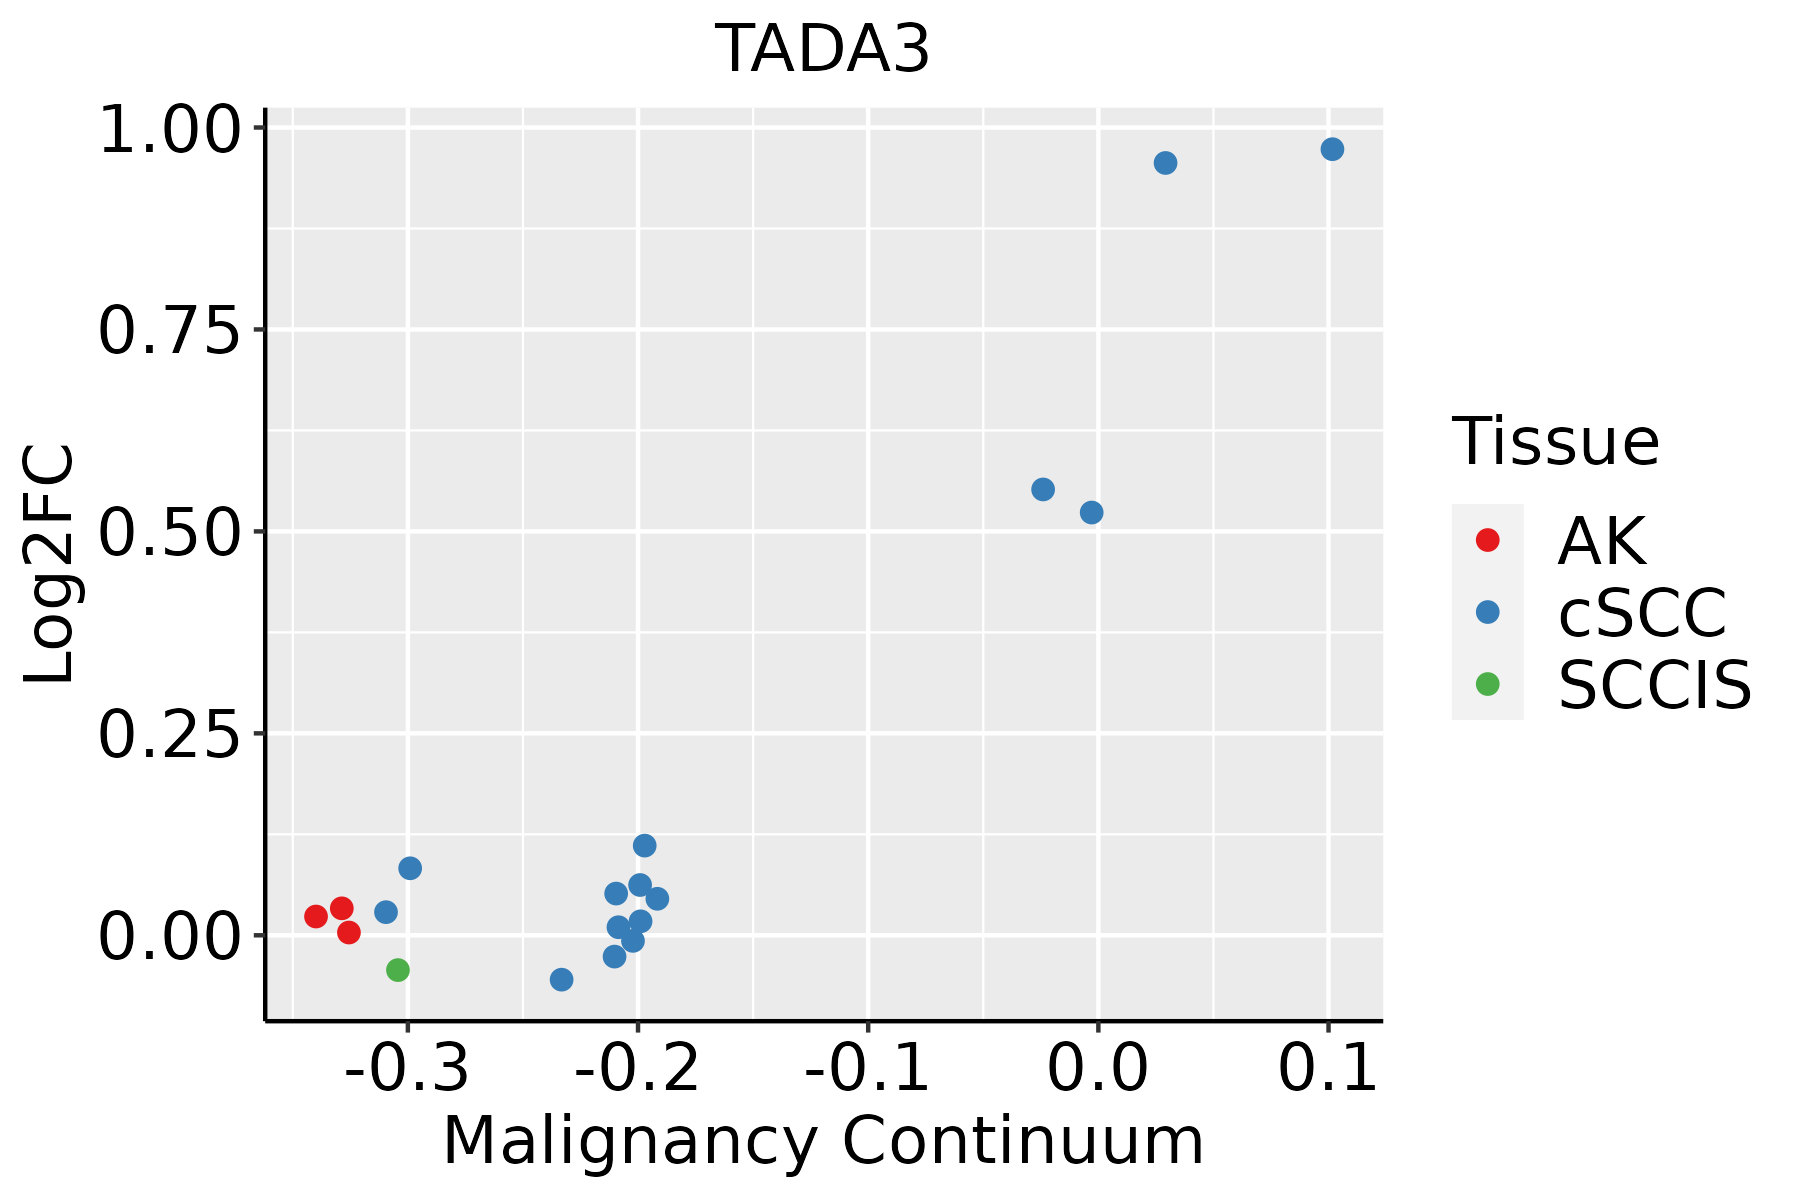 | AK: Actinic keratosis |
| cSCC: Cutaneous squamous cell carcinoma | ||
| SCCIS:squamous cell carcinoma in situ | ||
| Thyroid | 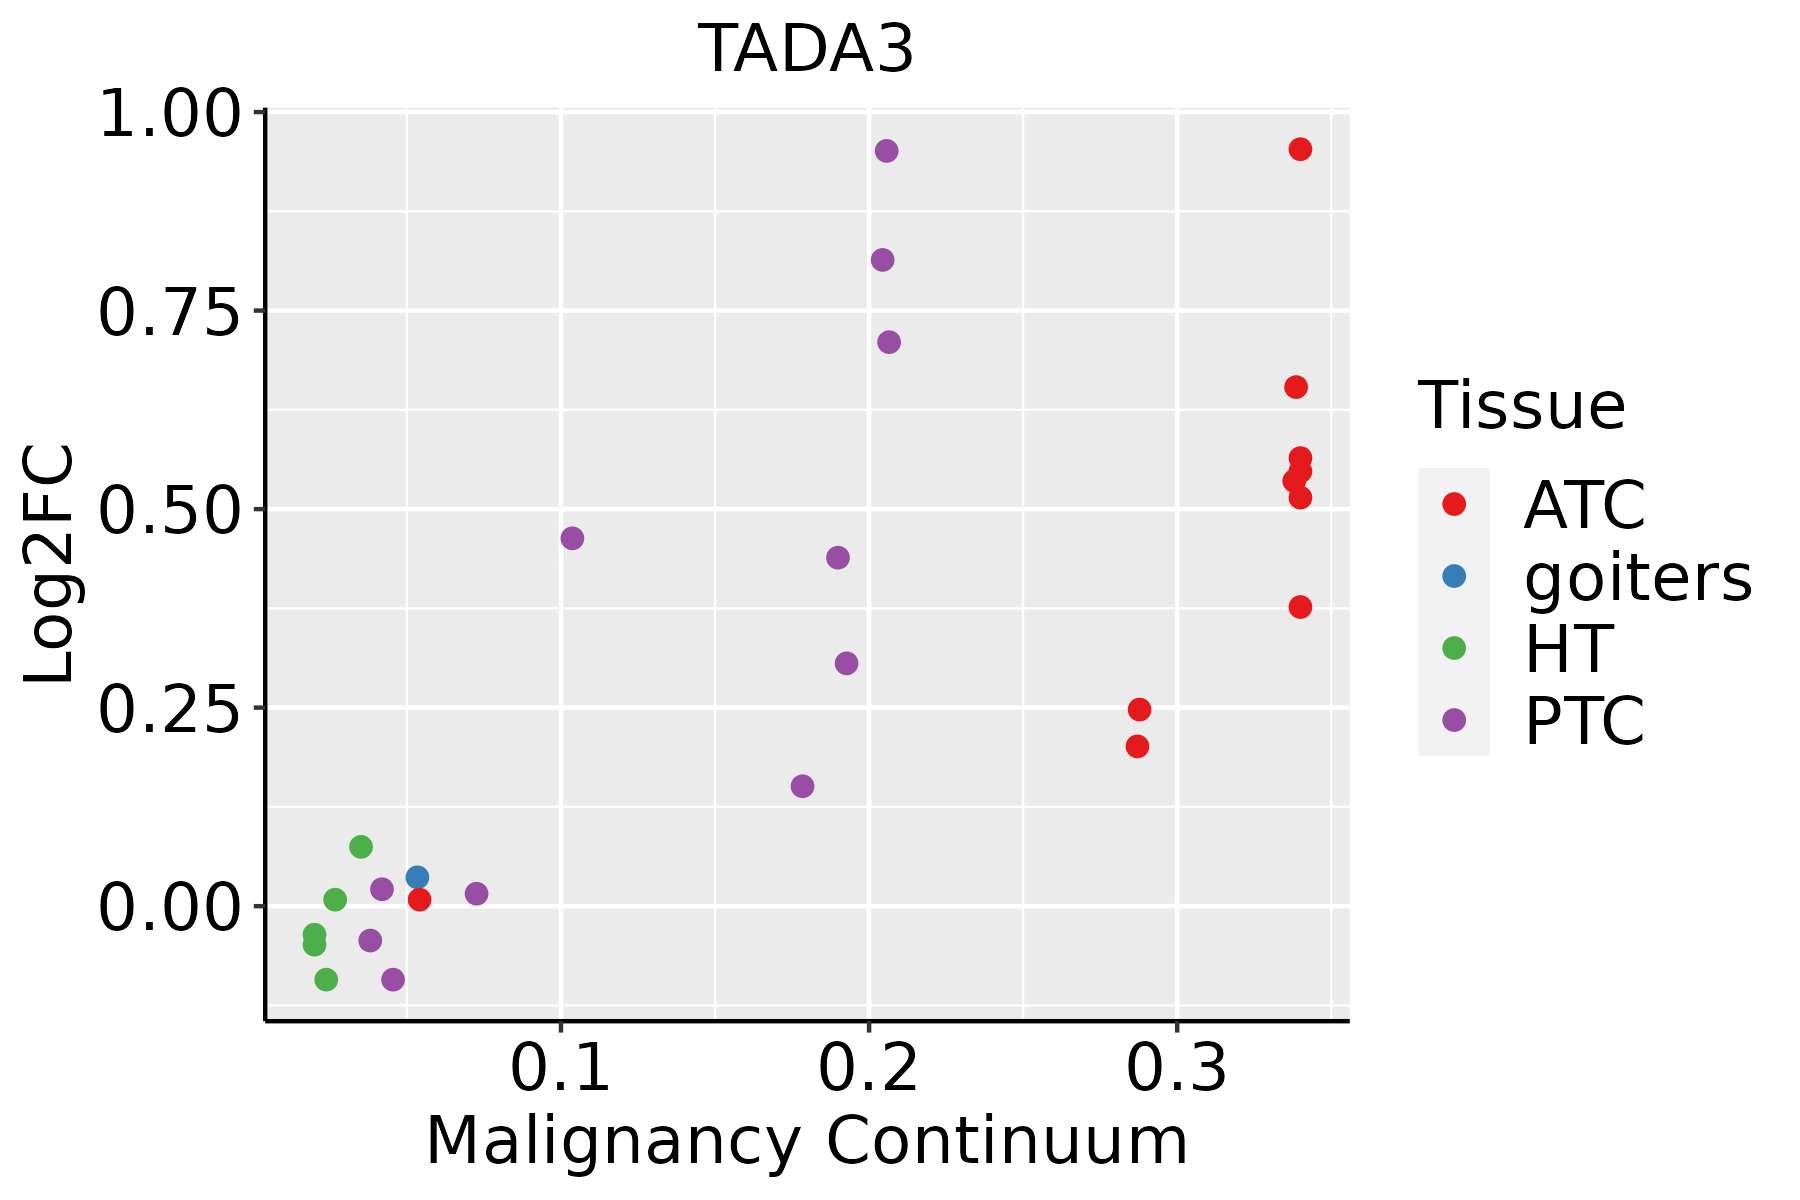 | ATC: Anaplastic thyroid cancer |
| HT: Hashimoto's thyroiditis | ||
| PTC: Papillary thyroid cancer |
| ∗log2FC in expression of this searched gene in stem-like cells from each diseased tissue sample relative to stem-like cells in normal samples in each tissue plotted against the malignancy continuum. Samples are colored based on if they are from different disease stage. |
Top |
Malignant transformation related pathway analysis |
| Find out the enriched GO biological processes and KEGG pathways involved in transition from healthy to precancer to cancer |
| Tissue | Disease Stage | Enriched GO biological Processes |
| Colorectum | AD |  |
| Colorectum | SER |  |
| Colorectum | MSS |  |
| Colorectum | MSI-H |  |
| Colorectum | FAP |  |
| ∗Top 15 enriched GO BP terms are showed in the bar plot of each disease state in each tissue. Each row represents a significant GO biological process which is colored according to the -log10(p.adjust). |
| Page: 1 2 3 4 5 6 7 8 9 |
| GO ID | Tissue | Disease Stage | Description | Gene Ratio | Bg Ratio | pvalue | p.adjust | Count |
| GO:0031647 | Colorectum | AD | regulation of protein stability | 108/3918 | 298/18723 | 6.33e-10 | 5.08e-08 | 108 |
| GO:0071383 | Colorectum | AD | cellular response to steroid hormone stimulus | 73/3918 | 204/18723 | 6.31e-07 | 2.24e-05 | 73 |
| GO:0030522 | Colorectum | AD | intracellular receptor signaling pathway | 87/3918 | 265/18723 | 3.69e-06 | 1.03e-04 | 87 |
| GO:0043401 | Colorectum | AD | steroid hormone mediated signaling pathway | 51/3918 | 136/18723 | 6.52e-06 | 1.63e-04 | 51 |
| GO:0048545 | Colorectum | AD | response to steroid hormone | 104/3918 | 339/18723 | 1.33e-05 | 2.90e-04 | 104 |
| GO:0009755 | Colorectum | AD | hormone-mediated signaling pathway | 64/3918 | 190/18723 | 2.78e-05 | 5.24e-04 | 64 |
| GO:0030518 | Colorectum | AD | intracellular steroid hormone receptor signaling pathway | 43/3918 | 116/18723 | 4.61e-05 | 7.97e-04 | 43 |
| GO:0031056 | Colorectum | AD | regulation of histone modification | 45/3918 | 152/18723 | 7.05e-03 | 4.31e-02 | 45 |
| GO:00316471 | Colorectum | SER | regulation of protein stability | 86/2897 | 298/18723 | 2.56e-09 | 2.42e-07 | 86 |
| GO:00713831 | Colorectum | SER | cellular response to steroid hormone stimulus | 55/2897 | 204/18723 | 1.66e-05 | 5.05e-04 | 55 |
| GO:00485451 | Colorectum | SER | response to steroid hormone | 80/2897 | 339/18723 | 5.15e-05 | 1.25e-03 | 80 |
| GO:00434011 | Colorectum | SER | steroid hormone mediated signaling pathway | 38/2897 | 136/18723 | 1.42e-04 | 2.82e-03 | 38 |
| GO:00097551 | Colorectum | SER | hormone-mediated signaling pathway | 49/2897 | 190/18723 | 1.54e-04 | 3.00e-03 | 49 |
| GO:00305221 | Colorectum | SER | intracellular receptor signaling pathway | 63/2897 | 265/18723 | 2.47e-04 | 4.20e-03 | 63 |
| GO:00305181 | Colorectum | SER | intracellular steroid hormone receptor signaling pathway | 31/2897 | 116/18723 | 1.25e-03 | 1.41e-02 | 31 |
| GO:00310561 | Colorectum | SER | regulation of histone modification | 37/2897 | 152/18723 | 2.80e-03 | 2.50e-02 | 37 |
| GO:00316472 | Colorectum | MSS | regulation of protein stability | 103/3467 | 298/18723 | 2.52e-11 | 3.49e-09 | 103 |
| GO:00713832 | Colorectum | MSS | cellular response to steroid hormone stimulus | 72/3467 | 204/18723 | 8.87e-09 | 5.43e-07 | 72 |
| GO:00434012 | Colorectum | MSS | steroid hormone mediated signaling pathway | 51/3467 | 136/18723 | 1.43e-07 | 6.67e-06 | 51 |
| GO:00305222 | Colorectum | MSS | intracellular receptor signaling pathway | 84/3467 | 265/18723 | 1.47e-07 | 6.79e-06 | 84 |
| Page: 1 2 3 4 5 6 7 8 9 10 11 12 13 14 |
| Pathway ID | Tissue | Disease Stage | Description | Gene Ratio | Bg Ratio | pvalue | p.adjust | qvalue | Count |
| hsa0516510 | Esophagus | ESCC | Human papillomavirus infection | 215/4205 | 331/8465 | 7.86e-09 | 7.12e-08 | 3.65e-08 | 215 |
| hsa0516515 | Esophagus | ESCC | Human papillomavirus infection | 215/4205 | 331/8465 | 7.86e-09 | 7.12e-08 | 3.65e-08 | 215 |
| hsa05165 | Liver | Cirrhotic | Human papillomavirus infection | 124/2530 | 331/8465 | 1.55e-03 | 7.83e-03 | 4.83e-03 | 124 |
| hsa051651 | Liver | Cirrhotic | Human papillomavirus infection | 124/2530 | 331/8465 | 1.55e-03 | 7.83e-03 | 4.83e-03 | 124 |
| hsa051652 | Liver | HCC | Human papillomavirus infection | 188/4020 | 331/8465 | 3.34e-04 | 1.49e-03 | 8.29e-04 | 188 |
| hsa051653 | Liver | HCC | Human papillomavirus infection | 188/4020 | 331/8465 | 3.34e-04 | 1.49e-03 | 8.29e-04 | 188 |
| hsa051659 | Oral cavity | OSCC | Human papillomavirus infection | 200/3704 | 331/8465 | 3.83e-10 | 4.93e-09 | 2.51e-09 | 200 |
| hsa0516514 | Oral cavity | OSCC | Human papillomavirus infection | 200/3704 | 331/8465 | 3.83e-10 | 4.93e-09 | 2.51e-09 | 200 |
| hsa0516523 | Oral cavity | LP | Human papillomavirus infection | 121/2418 | 331/8465 | 8.00e-04 | 3.86e-03 | 2.49e-03 | 121 |
| hsa0516533 | Oral cavity | LP | Human papillomavirus infection | 121/2418 | 331/8465 | 8.00e-04 | 3.86e-03 | 2.49e-03 | 121 |
| hsa051658 | Prostate | BPH | Human papillomavirus infection | 111/1718 | 331/8465 | 6.15e-09 | 7.81e-08 | 4.83e-08 | 111 |
| hsa0516513 | Prostate | BPH | Human papillomavirus infection | 111/1718 | 331/8465 | 6.15e-09 | 7.81e-08 | 4.83e-08 | 111 |
| hsa0516522 | Prostate | Tumor | Human papillomavirus infection | 110/1791 | 331/8465 | 1.31e-07 | 1.51e-06 | 9.36e-07 | 110 |
| hsa0516532 | Prostate | Tumor | Human papillomavirus infection | 110/1791 | 331/8465 | 1.31e-07 | 1.51e-06 | 9.36e-07 | 110 |
| Page: 1 |
Top |
Cell-cell communication analysis |
| Identification of potential cell-cell interactions between two cell types and their ligand-receptor pairs for different disease states |
| Ligand | Receptor | LRpair | Pathway | Tissue | Disease Stage |
| Page: 1 |
Top |
Single-cell gene regulatory network inference analysis |
| Find out the significant the regulons (TFs) and the target genes of each regulon across cell types for different disease states |
| TF | Cell Type | Tissue | Disease Stage | Target Gene | RSS | Regulon Activity |
| ∗The dot plots of a searched regulon are shown for all cell subpopulations in each disease state of each tissue based on the regulon specific score inferred using pySCENIC and by calculating the average expression. |
| Page: 1 |
Top |
Somatic mutation of malignant transformation related genes |
| Annotation of somatic variants for genes involved in malignant transformation |
| Hugo Symbol | Variant Class | Variant Classification | dbSNP RS | HGVSc | HGVSp | HGVSp Short | SWISSPROT | BIOTYPE | SIFT | PolyPhen | Tumor Sample Barcode | Tissue | Histology | Sex | Age | Stage | Therapy Types | Drugs | Outcome |
| TADA3 | SNV | Missense_Mutation | c.226N>T | p.Asp76Tyr | p.D76Y | O75528 | protein_coding | deleterious(0) | probably_damaging(0.982) | TCGA-A2-A04R-01 | Breast | breast invasive carcinoma | Female | <65 | I/II | Chemotherapy | taxol | SD | |
| TADA3 | SNV | Missense_Mutation | novel | c.546N>A | p.Asp182Glu | p.D182E | O75528 | protein_coding | tolerated(0.43) | benign(0.089) | TCGA-A7-A6VW-01 | Breast | breast invasive carcinoma | Female | <65 | I/II | Chemotherapy | doxorubicin | CR |
| TADA3 | SNV | Missense_Mutation | c.1205G>A | p.Arg402Gln | p.R402Q | O75528 | protein_coding | deleterious(0.01) | benign(0.203) | TCGA-A8-A08R-01 | Breast | breast invasive carcinoma | Female | <65 | I/II | Unknown | Unknown | SD | |
| TADA3 | SNV | Missense_Mutation | novel | c.1108C>G | p.Leu370Val | p.L370V | O75528 | protein_coding | tolerated(0.18) | possibly_damaging(0.9) | TCGA-BH-A0AY-01 | Breast | breast invasive carcinoma | Female | <65 | I/II | Chemotherapy | SD | |
| TADA3 | insertion | Nonsense_Mutation | novel | c.1161_1162insTGATAAAAATGCAAATTCTCAGGCCAC | p.Ala387_Asp388insTer | p.A387_D388ins* | O75528 | protein_coding | TCGA-AN-A04C-01 | Breast | breast invasive carcinoma | Female | <65 | I/II | Unknown | Unknown | SD | ||
| TADA3 | deletion | Frame_Shift_Del | novel | c.1009delN | p.Asp337ThrfsTer17 | p.D337Tfs*17 | O75528 | protein_coding | TCGA-D8-A27V-01 | Breast | breast invasive carcinoma | Female | <65 | I/II | Hormone Therapy | tamoxiphen | SD | ||
| TADA3 | SNV | Missense_Mutation | c.302N>A | p.Pro101His | p.P101H | O75528 | protein_coding | deleterious(0.02) | benign(0) | TCGA-EA-A410-01 | Cervix | cervical & endocervical cancer | Female | <65 | I/II | Unknown | Unknown | SD | |
| TADA3 | SNV | Missense_Mutation | c.524N>T | p.Glu175Val | p.E175V | O75528 | protein_coding | deleterious(0) | benign(0.353) | TCGA-A6-2685-01 | Colorectum | colon adenocarcinoma | Female | <65 | I/II | Unknown | Unknown | PD | |
| TADA3 | SNV | Missense_Mutation | c.269N>G | p.His90Arg | p.H90R | O75528 | protein_coding | tolerated(0.49) | benign(0.018) | TCGA-AA-3818-01 | Colorectum | colon adenocarcinoma | Female | >=65 | I/II | Unknown | Unknown | PD | |
| TADA3 | SNV | Missense_Mutation | novel | c.584A>C | p.His195Pro | p.H195P | O75528 | protein_coding | deleterious(0) | probably_damaging(0.998) | TCGA-AA-3966-01 | Colorectum | colon adenocarcinoma | Female | >=65 | I/II | Unknown | Unknown | SD |
| Page: 1 2 3 4 5 |
Top |
Related drugs of malignant transformation related genes |
| Identification of chemicals and drugs interact with genes involved in malignant transfromation |
| (DGIdb 4.0) |
| Entrez ID | Symbol | Category | Interaction Types | Drug Claim Name | Drug Name | PMIDs |
| Page: 1 |

Copyright 2023-Present -The University of Texas Health Science Center at Houston |