
|
|||||
|
 | |
| |
| |
| |
| |
| |
|
Gene: TADA1 |
Gene summary for TADA1 |
| Gene information | Species | Human | Gene symbol | TADA1 | Gene ID | 117143 |
| Gene name | transcriptional adaptor 1 | |
| Gene Alias | ADA1 | |
| Cytomap | 1q24.1 | |
| Gene Type | protein-coding | GO ID | GO:0006139 | UniProtAcc | Q96BN2 |
Top |
Malignant transformation analysis |
| Identification of the aberrant gene expression in precancerous and cancerous lesions by comparing the gene expression of stem-like cells in diseased tissues with normal stem cells |
| Entrez ID | Symbol | Replicates | Species | Organ | Tissue | Adj P-value | Log2FC | Malignancy |
| 117143 | TADA1 | LZE4T | Human | Esophagus | ESCC | 9.94e-04 | 1.93e-01 | 0.0811 |
| 117143 | TADA1 | LZE24T | Human | Esophagus | ESCC | 1.01e-02 | 8.38e-02 | 0.0596 |
| 117143 | TADA1 | P2T-E | Human | Esophagus | ESCC | 1.76e-12 | 2.40e-01 | 0.1177 |
| 117143 | TADA1 | P4T-E | Human | Esophagus | ESCC | 2.77e-08 | 2.43e-01 | 0.1323 |
| 117143 | TADA1 | P5T-E | Human | Esophagus | ESCC | 7.78e-11 | 1.55e-01 | 0.1327 |
| 117143 | TADA1 | P8T-E | Human | Esophagus | ESCC | 3.45e-08 | 8.07e-02 | 0.0889 |
| 117143 | TADA1 | P9T-E | Human | Esophagus | ESCC | 2.89e-06 | 1.39e-01 | 0.1131 |
| 117143 | TADA1 | P10T-E | Human | Esophagus | ESCC | 5.37e-15 | 2.12e-01 | 0.116 |
| 117143 | TADA1 | P11T-E | Human | Esophagus | ESCC | 1.30e-04 | 1.93e-01 | 0.1426 |
| 117143 | TADA1 | P12T-E | Human | Esophagus | ESCC | 1.21e-16 | 1.95e-01 | 0.1122 |
| 117143 | TADA1 | P15T-E | Human | Esophagus | ESCC | 3.57e-10 | 2.65e-01 | 0.1149 |
| 117143 | TADA1 | P16T-E | Human | Esophagus | ESCC | 4.72e-16 | 1.67e-01 | 0.1153 |
| 117143 | TADA1 | P20T-E | Human | Esophagus | ESCC | 7.63e-09 | 2.38e-01 | 0.1124 |
| 117143 | TADA1 | P21T-E | Human | Esophagus | ESCC | 8.62e-18 | 1.60e-01 | 0.1617 |
| 117143 | TADA1 | P22T-E | Human | Esophagus | ESCC | 3.54e-16 | 1.56e-01 | 0.1236 |
| 117143 | TADA1 | P23T-E | Human | Esophagus | ESCC | 1.37e-05 | 2.40e-01 | 0.108 |
| 117143 | TADA1 | P24T-E | Human | Esophagus | ESCC | 1.78e-05 | 9.63e-02 | 0.1287 |
| 117143 | TADA1 | P26T-E | Human | Esophagus | ESCC | 1.39e-21 | 2.23e-01 | 0.1276 |
| 117143 | TADA1 | P27T-E | Human | Esophagus | ESCC | 4.04e-07 | 9.08e-02 | 0.1055 |
| 117143 | TADA1 | P28T-E | Human | Esophagus | ESCC | 5.01e-19 | 1.75e-01 | 0.1149 |
| Page: 1 2 3 |
| Tissue | Expression Dynamics | Abbreviation |
| Esophagus | 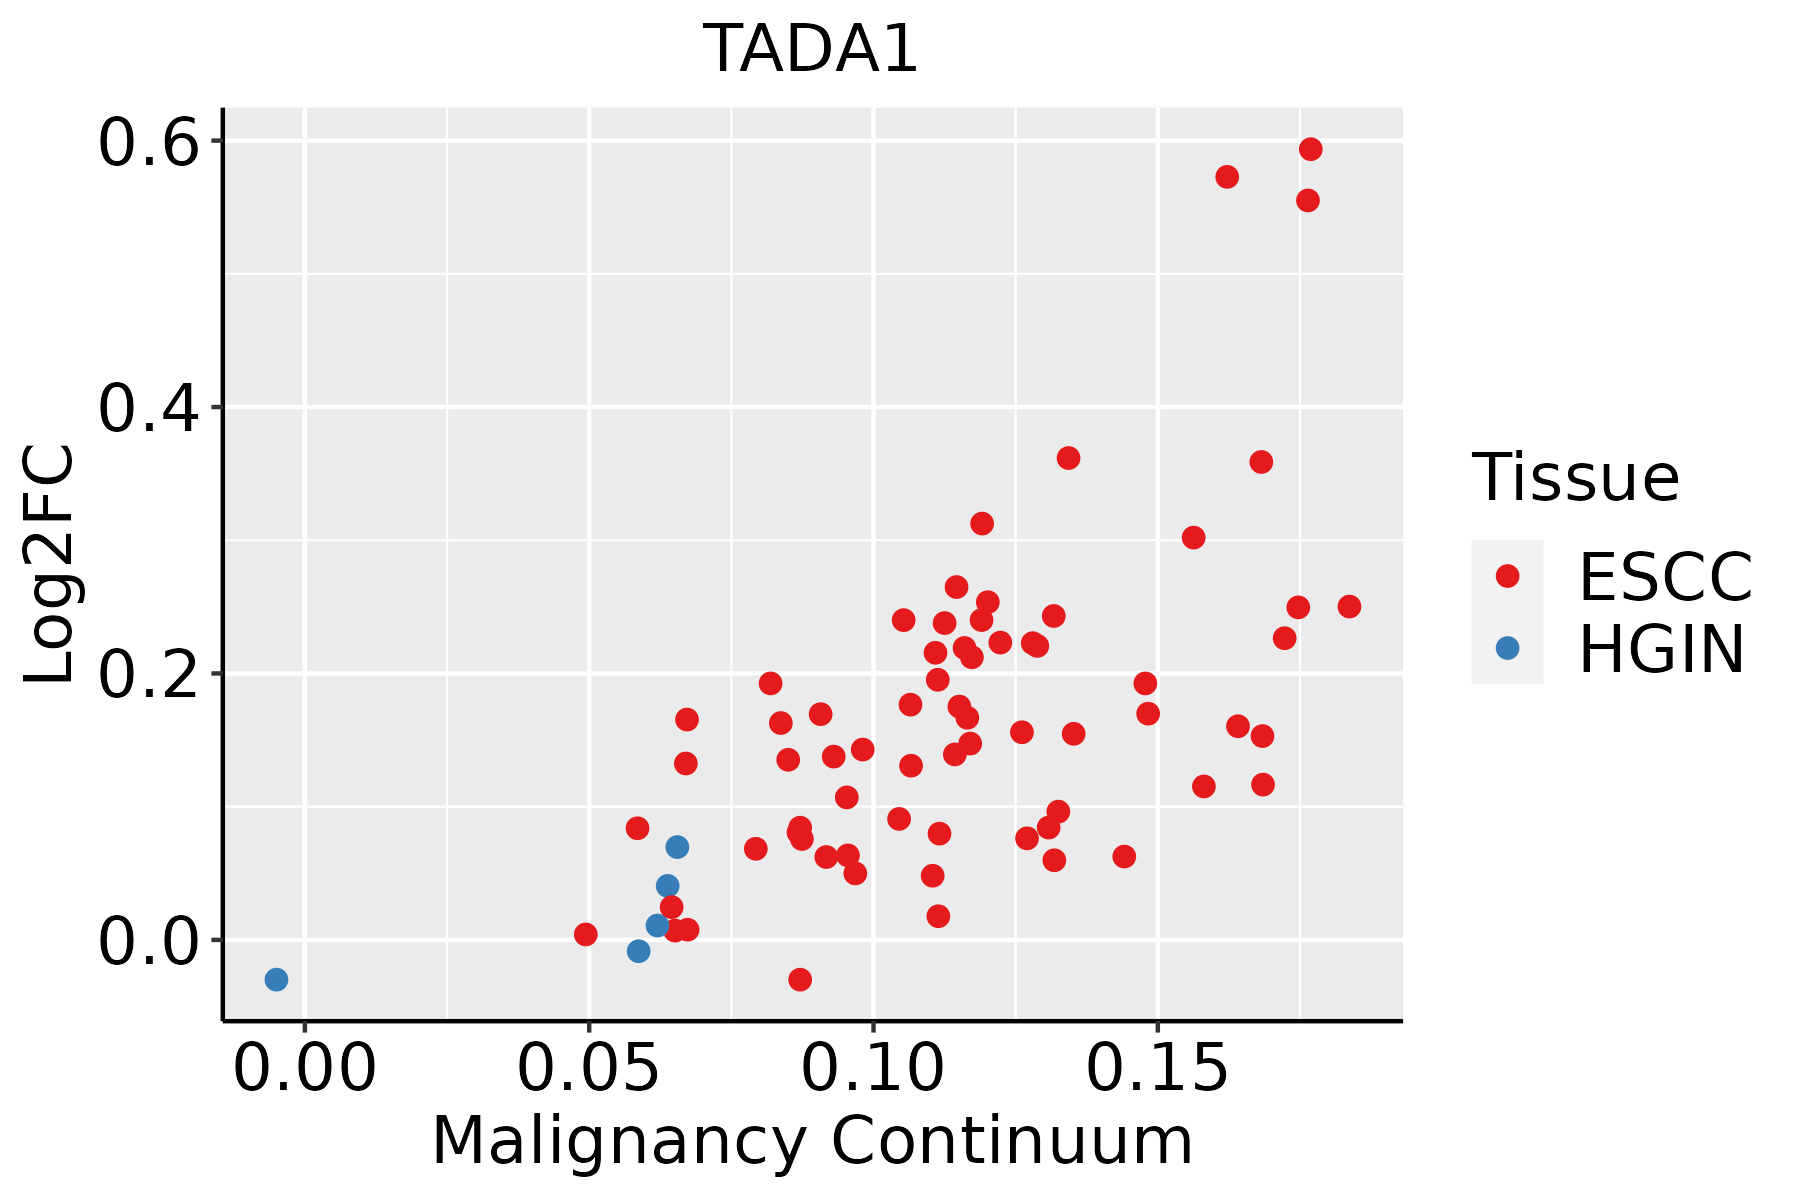 | ESCC: Esophageal squamous cell carcinoma |
| HGIN: High-grade intraepithelial neoplasias | ||
| LGIN: Low-grade intraepithelial neoplasias |
| ∗log2FC in expression of this searched gene in stem-like cells from each diseased tissue sample relative to stem-like cells in normal samples in each tissue plotted against the malignancy continuum. Samples are colored based on if they are from different disease stage. |
Top |
Malignant transformation related pathway analysis |
| Find out the enriched GO biological processes and KEGG pathways involved in transition from healthy to precancer to cancer |
| Tissue | Disease Stage | Enriched GO biological Processes |
| Colorectum | AD |  |
| Colorectum | SER |  |
| Colorectum | MSS |  |
| Colorectum | MSI-H |  |
| Colorectum | FAP |  |
| ∗Top 15 enriched GO BP terms are showed in the bar plot of each disease state in each tissue. Each row represents a significant GO biological process which is colored according to the -log10(p.adjust). |
| Page: 1 2 3 4 5 6 7 8 9 |
| GO ID | Tissue | Disease Stage | Description | Gene Ratio | Bg Ratio | pvalue | p.adjust | Count |
| GO:001657015 | Esophagus | ESCC | histone modification | 323/8552 | 463/18723 | 2.61e-26 | 7.88e-24 | 323 |
| GO:001820514 | Esophagus | ESCC | peptidyl-lysine modification | 259/8552 | 376/18723 | 3.90e-20 | 5.26e-18 | 259 |
| GO:001839413 | Esophagus | ESCC | peptidyl-lysine acetylation | 123/8552 | 169/18723 | 6.58e-13 | 2.94e-11 | 123 |
| GO:004354313 | Esophagus | ESCC | protein acylation | 165/8552 | 243/18723 | 1.69e-12 | 7.14e-11 | 165 |
| GO:000647313 | Esophagus | ESCC | protein acetylation | 140/8552 | 201/18723 | 4.37e-12 | 1.69e-10 | 140 |
| GO:001839313 | Esophagus | ESCC | internal peptidyl-lysine acetylation | 114/8552 | 158/18723 | 1.16e-11 | 4.24e-10 | 114 |
| GO:000647513 | Esophagus | ESCC | internal protein amino acid acetylation | 115/8552 | 160/18723 | 1.43e-11 | 5.08e-10 | 115 |
| GO:00165735 | Esophagus | ESCC | histone acetylation | 110/8552 | 152/18723 | 1.95e-11 | 6.81e-10 | 110 |
| GO:00439662 | Esophagus | ESCC | histone H3 acetylation | 43/8552 | 61/18723 | 7.57e-05 | 5.67e-04 | 43 |
| Page: 1 |
| Pathway ID | Tissue | Disease Stage | Description | Gene Ratio | Bg Ratio | pvalue | p.adjust | qvalue | Count |
| Page: 1 |
Top |
Cell-cell communication analysis |
| Identification of potential cell-cell interactions between two cell types and their ligand-receptor pairs for different disease states |
| Ligand | Receptor | LRpair | Pathway | Tissue | Disease Stage |
| Page: 1 |
Top |
Single-cell gene regulatory network inference analysis |
| Find out the significant the regulons (TFs) and the target genes of each regulon across cell types for different disease states |
| TF | Cell Type | Tissue | Disease Stage | Target Gene | RSS | Regulon Activity |
| ∗The dot plots of a searched regulon are shown for all cell subpopulations in each disease state of each tissue based on the regulon specific score inferred using pySCENIC and by calculating the average expression. |
| Page: 1 |
Top |
Somatic mutation of malignant transformation related genes |
| Annotation of somatic variants for genes involved in malignant transformation |
| Hugo Symbol | Variant Class | Variant Classification | dbSNP RS | HGVSc | HGVSp | HGVSp Short | SWISSPROT | BIOTYPE | SIFT | PolyPhen | Tumor Sample Barcode | Tissue | Histology | Sex | Age | Stage | Therapy Types | Drugs | Outcome |
| TADA1 | SNV | Missense_Mutation | c.215T>G | p.Ile72Ser | p.I72S | Q96BN2 | protein_coding | tolerated(0.88) | benign(0.017) | TCGA-BH-A18G-01 | Breast | breast invasive carcinoma | Female | >=65 | I/II | Unknown | Unknown | SD | |
| TADA1 | insertion | Nonsense_Mutation | novel | c.602_603insAACTATGTCTGACTTCTCAGTTTGTATCTAGCTCTATT | p.Asp201GlufsTer11 | p.D201Efs*11 | Q96BN2 | protein_coding | TCGA-A2-A0EV-01 | Breast | breast invasive carcinoma | Female | >=65 | I/II | Unknown | Unknown | SD | ||
| TADA1 | SNV | Missense_Mutation | novel | c.58G>A | p.Gly20Arg | p.G20R | Q96BN2 | protein_coding | deleterious(0) | probably_damaging(1) | TCGA-2W-A8YY-01 | Cervix | cervical & endocervical cancer | Female | <65 | I/II | Chemotherapy | cisplatin | CR |
| TADA1 | SNV | Missense_Mutation | c.133N>A | p.Leu45Ile | p.L45I | Q96BN2 | protein_coding | tolerated(0.48) | benign(0.005) | TCGA-AA-3821-01 | Colorectum | colon adenocarcinoma | Female | >=65 | I/II | Unknown | Unknown | SD | |
| TADA1 | SNV | Missense_Mutation | novel | c.962N>A | p.Val321Asp | p.V321D | Q96BN2 | protein_coding | deleterious(0) | benign(0.029) | TCGA-AA-A01K-01 | Colorectum | colon adenocarcinoma | Female | >=65 | III/IV | Chemotherapy | folinic | CR |
| TADA1 | SNV | Missense_Mutation | c.999G>T | p.Leu333Phe | p.L333F | Q96BN2 | protein_coding | tolerated_low_confidence(0.08) | possibly_damaging(0.58) | TCGA-AD-6901-01 | Colorectum | colon adenocarcinoma | Male | >=65 | I/II | Chemotherapy | xeloda | PD | |
| TADA1 | SNV | Missense_Mutation | novel | c.506N>G | p.Glu169Gly | p.E169G | Q96BN2 | protein_coding | deleterious(0.01) | benign(0.185) | TCGA-A5-A0G2-01 | Endometrium | uterine corpus endometrioid carcinoma | Female | <65 | III/IV | Unknown | Unknown | SD |
| TADA1 | SNV | Missense_Mutation | rs370808608 | c.835N>A | p.Asp279Asn | p.D279N | Q96BN2 | protein_coding | deleterious(0.01) | probably_damaging(0.978) | TCGA-AJ-A3EL-01 | Endometrium | uterine corpus endometrioid carcinoma | Female | <65 | I/II | Unknown | Unknown | SD |
| TADA1 | SNV | Missense_Mutation | c.990G>T | p.Glu330Asp | p.E330D | Q96BN2 | protein_coding | tolerated_low_confidence(0.31) | benign(0) | TCGA-AP-A051-01 | Endometrium | uterine corpus endometrioid carcinoma | Female | >=65 | I/II | Unknown | Unknown | SD | |
| TADA1 | SNV | Missense_Mutation | rs771134514 | c.793G>A | p.Gly265Arg | p.G265R | Q96BN2 | protein_coding | deleterious(0.02) | benign(0.115) | TCGA-AP-A051-01 | Endometrium | uterine corpus endometrioid carcinoma | Female | >=65 | I/II | Unknown | Unknown | SD |
| Page: 1 2 3 4 |
Top |
Related drugs of malignant transformation related genes |
| Identification of chemicals and drugs interact with genes involved in malignant transfromation |
| (DGIdb 4.0) |
| Entrez ID | Symbol | Category | Interaction Types | Drug Claim Name | Drug Name | PMIDs |
| Page: 1 |

Copyright 2023-Present -The University of Texas Health Science Center at Houston |