
|
|||||
|
 | |
| |
| |
| |
| |
| |
|
Gene: TAC1 |
Gene summary for TAC1 |
| Gene information | Species | Human | Gene symbol | TAC1 | Gene ID | 6863 |
| Gene name | tachykinin precursor 1 | |
| Gene Alias | Hs.2563 | |
| Cytomap | 7q21.3 | |
| Gene Type | protein-coding | GO ID | GO:0000003 | UniProtAcc | P20366 |
Top |
Malignant transformation analysis |
| Identification of the aberrant gene expression in precancerous and cancerous lesions by comparing the gene expression of stem-like cells in diseased tissues with normal stem cells |
| Entrez ID | Symbol | Replicates | Species | Organ | Tissue | Adj P-value | Log2FC | Malignancy |
| 6863 | TAC1 | S014 | Human | Liver | HCC | 1.70e-64 | 3.39e+00 | 0.2254 |
| 6863 | TAC1 | S015 | Human | Liver | HCC | 1.17e-21 | 2.47e+00 | 0.2375 |
| 6863 | TAC1 | S016 | Human | Liver | HCC | 2.79e-62 | 3.62e+00 | 0.2243 |
| Page: 1 |
| Tissue | Expression Dynamics | Abbreviation |
| Liver | 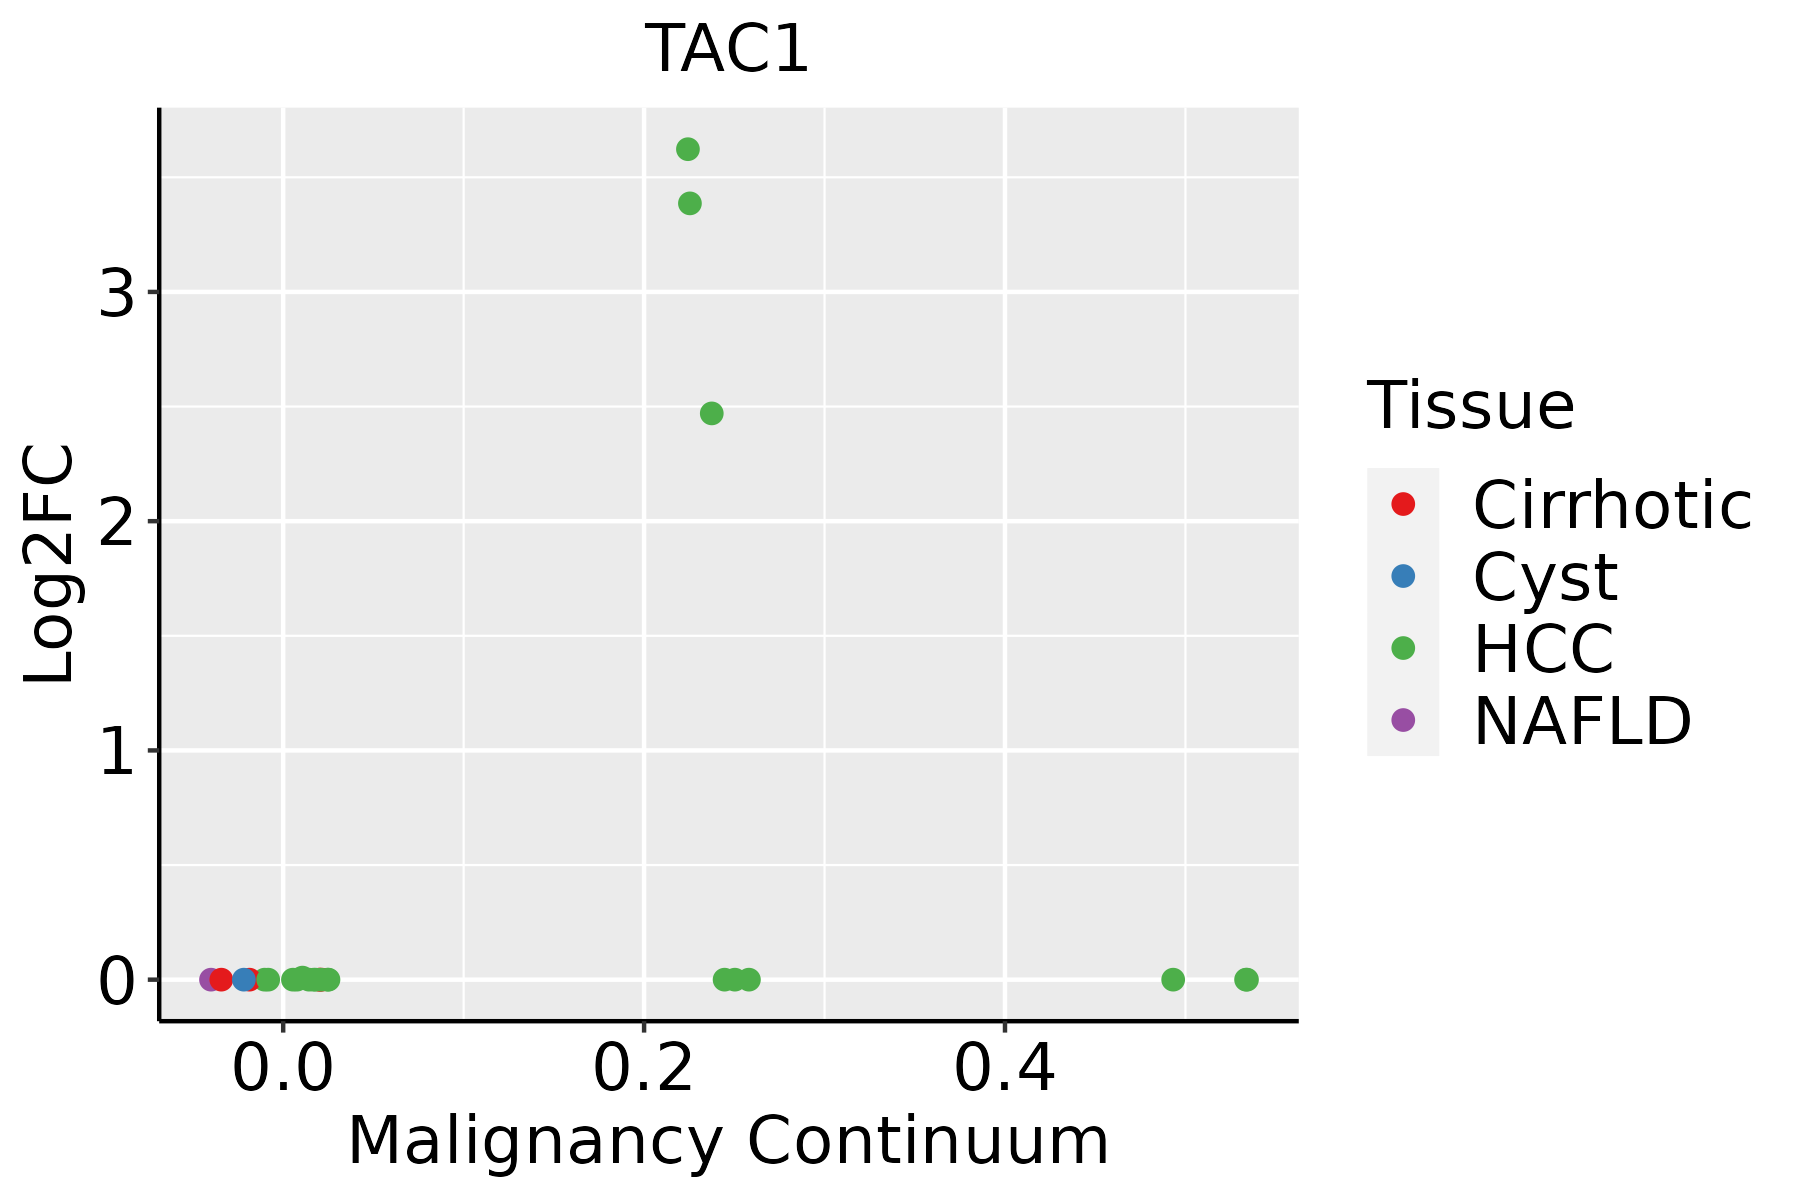 | HCC: Hepatocellular carcinoma |
| NAFLD: Non-alcoholic fatty liver disease |
| ∗log2FC in expression of this searched gene in stem-like cells from each diseased tissue sample relative to stem-like cells in normal samples in each tissue plotted against the malignancy continuum. Samples are colored based on if they are from different disease stage. |
Top |
Malignant transformation related pathway analysis |
| Find out the enriched GO biological processes and KEGG pathways involved in transition from healthy to precancer to cancer |
| Tissue | Disease Stage | Enriched GO biological Processes |
| Colorectum | AD |  |
| Colorectum | SER |  |
| Colorectum | MSS |  |
| Colorectum | MSI-H |  |
| Colorectum | FAP |  |
| ∗Top 15 enriched GO BP terms are showed in the bar plot of each disease state in each tissue. Each row represents a significant GO biological process which is colored according to the -log10(p.adjust). |
| Page: 1 2 3 4 5 6 7 8 9 |
| GO ID | Tissue | Disease Stage | Description | Gene Ratio | Bg Ratio | pvalue | p.adjust | Count |
| GO:190290322 | Liver | HCC | regulation of supramolecular fiber organization | 224/7958 | 383/18723 | 1.54e-10 | 5.33e-09 | 224 |
| GO:000701522 | Liver | HCC | actin filament organization | 252/7958 | 442/18723 | 3.83e-10 | 1.25e-08 | 252 |
| GO:190290522 | Liver | HCC | positive regulation of supramolecular fiber organization | 131/7958 | 209/18723 | 2.85e-09 | 7.69e-08 | 131 |
| GO:005149522 | Liver | HCC | positive regulation of cytoskeleton organization | 138/7958 | 226/18723 | 1.26e-08 | 3.12e-07 | 138 |
| GO:003297022 | Liver | HCC | regulation of actin filament-based process | 222/7958 | 397/18723 | 3.81e-08 | 8.30e-07 | 222 |
| GO:003295622 | Liver | HCC | regulation of actin cytoskeleton organization | 202/7958 | 358/18723 | 6.18e-08 | 1.29e-06 | 202 |
| GO:011005322 | Liver | HCC | regulation of actin filament organization | 158/7958 | 278/18723 | 9.01e-07 | 1.37e-05 | 158 |
| GO:005101722 | Liver | HCC | actin filament bundle assembly | 96/7958 | 157/18723 | 1.81e-06 | 2.52e-05 | 96 |
| GO:006157222 | Liver | HCC | actin filament bundle organization | 97/7958 | 161/18723 | 4.04e-06 | 5.22e-05 | 97 |
| GO:003103222 | Liver | HCC | actomyosin structure organization | 109/7958 | 196/18723 | 1.39e-04 | 1.13e-03 | 109 |
| GO:199009021 | Liver | HCC | cellular response to nerve growth factor stimulus | 36/7958 | 53/18723 | 1.62e-04 | 1.29e-03 | 36 |
| GO:001087621 | Liver | HCC | lipid localization | 228/7958 | 448/18723 | 1.80e-04 | 1.41e-03 | 228 |
| GO:199008921 | Liver | HCC | response to nerve growth factor | 37/7958 | 56/18723 | 3.13e-04 | 2.22e-03 | 37 |
| GO:005087822 | Liver | HCC | regulation of body fluid levels | 191/7958 | 379/18723 | 1.06e-03 | 6.11e-03 | 191 |
| GO:003249611 | Liver | HCC | response to lipopolysaccharide | 174/7958 | 343/18723 | 1.19e-03 | 6.62e-03 | 174 |
| GO:000686921 | Liver | HCC | lipid transport | 198/7958 | 398/18723 | 1.92e-03 | 9.78e-03 | 198 |
| GO:003003822 | Liver | HCC | contractile actin filament bundle assembly | 60/7958 | 106/18723 | 2.34e-03 | 1.16e-02 | 60 |
| GO:004314922 | Liver | HCC | stress fiber assembly | 60/7958 | 106/18723 | 2.34e-03 | 1.16e-02 | 60 |
| GO:000223711 | Liver | HCC | response to molecule of bacterial origin | 181/7958 | 363/18723 | 2.58e-03 | 1.24e-02 | 181 |
| GO:003223312 | Liver | HCC | positive regulation of actin filament bundle assembly | 38/7958 | 63/18723 | 3.27e-03 | 1.50e-02 | 38 |
| Page: 1 2 |
| Pathway ID | Tissue | Disease Stage | Description | Gene Ratio | Bg Ratio | pvalue | p.adjust | qvalue | Count |
| Page: 1 |
Top |
Cell-cell communication analysis |
| Identification of potential cell-cell interactions between two cell types and their ligand-receptor pairs for different disease states |
| Ligand | Receptor | LRpair | Pathway | Tissue | Disease Stage |
| Page: 1 |
Top |
Single-cell gene regulatory network inference analysis |
| Find out the significant the regulons (TFs) and the target genes of each regulon across cell types for different disease states |
| TF | Cell Type | Tissue | Disease Stage | Target Gene | RSS | Regulon Activity |
| ∗The dot plots of a searched regulon are shown for all cell subpopulations in each disease state of each tissue based on the regulon specific score inferred using pySCENIC and by calculating the average expression. |
| Page: 1 |
Top |
Somatic mutation of malignant transformation related genes |
| Annotation of somatic variants for genes involved in malignant transformation |
| Hugo Symbol | Variant Class | Variant Classification | dbSNP RS | HGVSc | HGVSp | HGVSp Short | SWISSPROT | BIOTYPE | SIFT | PolyPhen | Tumor Sample Barcode | Tissue | Histology | Sex | Age | Stage | Therapy Types | Drugs | Outcome |
| TAC1 | SNV | Missense_Mutation | novel | c.166G>A | p.Ala56Thr | p.A56T | P20366 | protein_coding | tolerated(0.56) | probably_damaging(0.994) | TCGA-AA-3949-01 | Colorectum | colon adenocarcinoma | Female | >=65 | III/IV | Unknown | Unknown | SD |
| TAC1 | SNV | Missense_Mutation | novel | c.143T>G | p.Phe48Cys | p.F48C | P20366 | protein_coding | deleterious(0) | probably_damaging(0.996) | TCGA-AA-3984-01 | Colorectum | colon adenocarcinoma | Female | <65 | I/II | Unknown | Unknown | SD |
| TAC1 | SNV | Missense_Mutation | novel | c.222N>G | p.Asp74Glu | p.D74E | P20366 | protein_coding | tolerated(1) | probably_damaging(0.971) | TCGA-AJ-A3EL-01 | Endometrium | uterine corpus endometrioid carcinoma | Female | <65 | I/II | Unknown | Unknown | SD |
| TAC1 | SNV | Missense_Mutation | novel | c.383N>T | p.Arg128Ile | p.R128I | P20366 | protein_coding | deleterious(0) | probably_damaging(0.988) | TCGA-AJ-A5DW-01 | Endometrium | uterine corpus endometrioid carcinoma | Female | <65 | I/II | Unknown | Unknown | SD |
| TAC1 | SNV | Missense_Mutation | c.356N>T | p.Arg119Met | p.R119M | P20366 | protein_coding | tolerated(0.05) | possibly_damaging(0.66) | TCGA-AX-A06F-01 | Endometrium | uterine corpus endometrioid carcinoma | Female | <65 | III/IV | Chemotherapy | carboplatin | SD | |
| TAC1 | SNV | Missense_Mutation | novel | c.215A>G | p.Asp72Gly | p.D72G | P20366 | protein_coding | tolerated(0.12) | possibly_damaging(0.601) | TCGA-B5-A1MW-01 | Endometrium | uterine corpus endometrioid carcinoma | Female | <65 | I/II | Unknown | Unknown | PD |
| TAC1 | SNV | Missense_Mutation | novel | c.161G>T | p.Arg54Ile | p.R54I | P20366 | protein_coding | deleterious(0) | probably_damaging(0.992) | TCGA-BK-A6W3-01 | Endometrium | uterine corpus endometrioid carcinoma | Female | <65 | I/II | Unknown | Unknown | SD |
| TAC1 | SNV | Missense_Mutation | novel | c.70G>A | p.Ala24Thr | p.A24T | P20366 | protein_coding | tolerated(0.3) | probably_damaging(0.991) | TCGA-FI-A2D5-01 | Endometrium | uterine corpus endometrioid carcinoma | Female | <65 | III/IV | Chemotherapy | carboplatinum | PD |
| TAC1 | SNV | Missense_Mutation | novel | c.102N>T | p.Trp34Cys | p.W34C | P20366 | protein_coding | deleterious(0) | probably_damaging(0.997) | TCGA-44-6145-01 | Lung | lung adenocarcinoma | Female | <65 | I/II | Unknown | Unknown | SD |
| TAC1 | SNV | Missense_Mutation | rs774315492 | c.52N>C | p.Phe18Leu | p.F18L | P20366 | protein_coding | tolerated(0.5) | benign(0) | TCGA-49-AARO-01 | Lung | lung adenocarcinoma | Female | <65 | I/II | Unknown | Unknown | PD |
| Page: 1 2 |
Top |
Related drugs of malignant transformation related genes |
| Identification of chemicals and drugs interact with genes involved in malignant transfromation |
| (DGIdb 4.0) |
| Entrez ID | Symbol | Category | Interaction Types | Drug Claim Name | Drug Name | PMIDs |
| 6863 | TAC1 | DRUGGABLE GENOME | PUROMYCIN | PUROMYCIN | 14623771 | |
| 6863 | TAC1 | DRUGGABLE GENOME | HUMAN CHORIONIC GONADOTROPIN | 14706561 | ||
| 6863 | TAC1 | DRUGGABLE GENOME | GINGER | GINGER | 1282221 | |
| 6863 | TAC1 | DRUGGABLE GENOME | GP-120 | 10597775 | ||
| 6863 | TAC1 | DRUGGABLE GENOME | FUROSEMIDE | FUROSEMIDE | 2048822 | |
| 6863 | TAC1 | DRUGGABLE GENOME | ANDROGENS | 7982063 | ||
| 6863 | TAC1 | DRUGGABLE GENOME | FAMOTIDINE | FAMOTIDINE | 12495560 | |
| 6863 | TAC1 | DRUGGABLE GENOME | GOSSYPOL | GOSSYPOL | 2887120 | |
| 6863 | TAC1 | DRUGGABLE GENOME | SULINDAC | SULINDAC | 1707646 | |
| 6863 | TAC1 | DRUGGABLE GENOME | HALOPERIDOL | HALOPERIDOL | 6166743 |
| Page: 1 2 3 |

Copyright 2023-Present -The University of Texas Health Science Center at Houston |