
|
|||||
|
 | |
| |
| |
| |
| |
| |
|
Gene: TAB3 |
Gene summary for TAB3 |
| Gene information | Species | Human | Gene symbol | TAB3 | Gene ID | 257397 |
| Gene name | TGF-beta activated kinase 1 (MAP3K7) binding protein 3 | |
| Gene Alias | MAP3K7IP3 | |
| Cytomap | Xp21.2 | |
| Gene Type | protein-coding | GO ID | GO:0006914 | UniProtAcc | Q8N5C8 |
Top |
Malignant transformation analysis |
| Identification of the aberrant gene expression in precancerous and cancerous lesions by comparing the gene expression of stem-like cells in diseased tissues with normal stem cells |
| Entrez ID | Symbol | Replicates | Species | Organ | Tissue | Adj P-value | Log2FC | Malignancy |
| 257397 | TAB3 | NAFLD1 | Human | Liver | NAFLD | 2.20e-04 | 4.42e-01 | -0.04 |
| 257397 | TAB3 | HCC1_Meng | Human | Liver | HCC | 1.53e-28 | -6.94e-02 | 0.0246 |
| 257397 | TAB3 | HCC2_Meng | Human | Liver | HCC | 5.63e-19 | -2.07e-02 | 0.0107 |
| 257397 | TAB3 | HCC2 | Human | Liver | HCC | 1.71e-02 | 3.26e+00 | 0.5341 |
| 257397 | TAB3 | S027 | Human | Liver | HCC | 3.90e-02 | 3.99e-01 | 0.2446 |
| 257397 | TAB3 | S028 | Human | Liver | HCC | 1.12e-10 | 5.29e-01 | 0.2503 |
| 257397 | TAB3 | S029 | Human | Liver | HCC | 3.51e-13 | 7.04e-01 | 0.2581 |
| 257397 | TAB3 | HTA12-26-1 | Human | Pancreas | PDAC | 1.12e-06 | 5.01e-01 | 0.3728 |
| 257397 | TAB3 | HTA12-29-1 | Human | Pancreas | PDAC | 4.41e-22 | 5.68e-01 | 0.3722 |
| Page: 1 |
| Tissue | Expression Dynamics | Abbreviation |
| Liver | 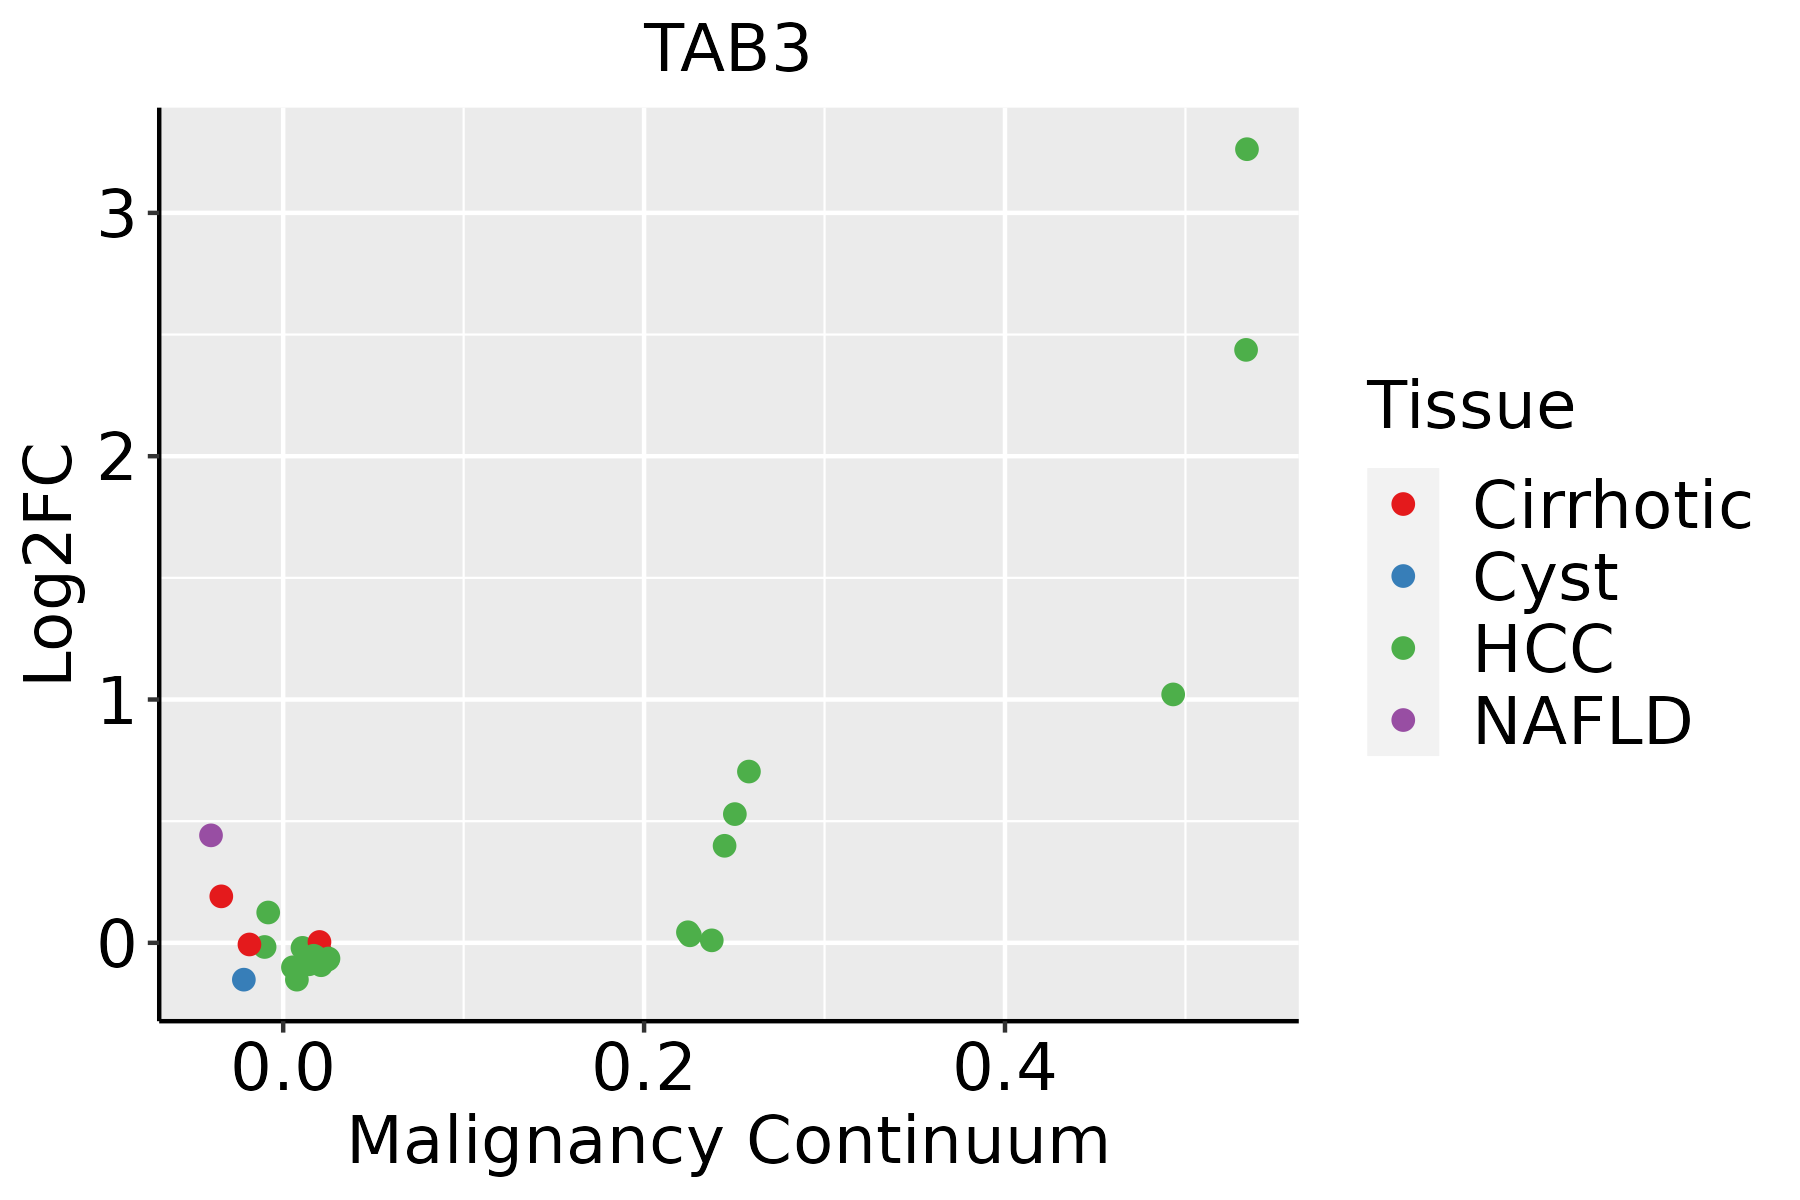 | HCC: Hepatocellular carcinoma |
| NAFLD: Non-alcoholic fatty liver disease |
| ∗log2FC in expression of this searched gene in stem-like cells from each diseased tissue sample relative to stem-like cells in normal samples in each tissue plotted against the malignancy continuum. Samples are colored based on if they are from different disease stage. |
Top |
Malignant transformation related pathway analysis |
| Find out the enriched GO biological processes and KEGG pathways involved in transition from healthy to precancer to cancer |
| Tissue | Disease Stage | Enriched GO biological Processes |
| Colorectum | AD |  |
| Colorectum | SER |  |
| Colorectum | MSS |  |
| Colorectum | MSI-H |  |
| Colorectum | FAP |  |
| ∗Top 15 enriched GO BP terms are showed in the bar plot of each disease state in each tissue. Each row represents a significant GO biological process which is colored according to the -log10(p.adjust). |
| Page: 1 2 3 4 5 6 7 8 9 |
| GO ID | Tissue | Disease Stage | Description | Gene Ratio | Bg Ratio | pvalue | p.adjust | Count |
| GO:00098957 | Liver | NAFLD | negative regulation of catabolic process | 65/1882 | 320/18723 | 2.50e-08 | 2.71e-06 | 65 |
| GO:00313307 | Liver | NAFLD | negative regulation of cellular catabolic process | 55/1882 | 262/18723 | 9.35e-08 | 7.59e-06 | 55 |
| GO:00105065 | Liver | NAFLD | regulation of autophagy | 57/1882 | 317/18723 | 1.00e-05 | 3.18e-04 | 57 |
| GO:001050621 | Liver | HCC | regulation of autophagy | 210/7958 | 317/18723 | 7.59e-18 | 8.45e-16 | 210 |
| GO:000989522 | Liver | HCC | negative regulation of catabolic process | 196/7958 | 320/18723 | 7.98e-12 | 3.35e-10 | 196 |
| GO:003133022 | Liver | HCC | negative regulation of cellular catabolic process | 164/7958 | 262/18723 | 3.52e-11 | 1.35e-09 | 164 |
| GO:00105074 | Liver | HCC | negative regulation of autophagy | 57/7958 | 85/18723 | 4.10e-06 | 5.27e-05 | 57 |
| GO:000724912 | Liver | HCC | I-kappaB kinase/NF-kappaB signaling | 156/7958 | 281/18723 | 6.66e-06 | 8.00e-05 | 156 |
| GO:004312312 | Liver | HCC | positive regulation of I-kappaB kinase/NF-kappaB signaling | 108/7958 | 186/18723 | 1.28e-05 | 1.43e-04 | 108 |
| GO:004312212 | Liver | HCC | regulation of I-kappaB kinase/NF-kappaB signaling | 138/7958 | 249/18723 | 2.47e-05 | 2.58e-04 | 138 |
| Page: 1 |
| Pathway ID | Tissue | Disease Stage | Description | Gene Ratio | Bg Ratio | pvalue | p.adjust | qvalue | Count |
| hsa0513214 | Liver | NAFLD | Salmonella infection | 55/1043 | 249/8465 | 8.48e-06 | 3.09e-04 | 2.49e-04 | 55 |
| hsa0513014 | Liver | NAFLD | Pathogenic Escherichia coli infection | 45/1043 | 197/8465 | 2.31e-05 | 6.88e-04 | 5.54e-04 | 45 |
| hsa0513114 | Liver | NAFLD | Shigellosis | 48/1043 | 247/8465 | 7.82e-04 | 1.17e-02 | 9.39e-03 | 48 |
| hsa0513215 | Liver | NAFLD | Salmonella infection | 55/1043 | 249/8465 | 8.48e-06 | 3.09e-04 | 2.49e-04 | 55 |
| hsa0513015 | Liver | NAFLD | Pathogenic Escherichia coli infection | 45/1043 | 197/8465 | 2.31e-05 | 6.88e-04 | 5.54e-04 | 45 |
| hsa0513115 | Liver | NAFLD | Shigellosis | 48/1043 | 247/8465 | 7.82e-04 | 1.17e-02 | 9.39e-03 | 48 |
| hsa0513242 | Liver | HCC | Salmonella infection | 178/4020 | 249/8465 | 5.90e-15 | 1.98e-13 | 1.10e-13 | 178 |
| hsa0513042 | Liver | HCC | Pathogenic Escherichia coli infection | 129/4020 | 197/8465 | 2.02e-07 | 2.50e-06 | 1.39e-06 | 129 |
| hsa0513142 | Liver | HCC | Shigellosis | 150/4020 | 247/8465 | 1.53e-05 | 1.04e-04 | 5.81e-05 | 150 |
| hsa049362 | Liver | HCC | Alcoholic liver disease | 89/4020 | 142/8465 | 1.73e-04 | 8.53e-04 | 4.75e-04 | 89 |
| hsa046684 | Liver | HCC | TNF signaling pathway | 73/4020 | 114/8465 | 2.53e-04 | 1.19e-03 | 6.63e-04 | 73 |
| hsa0513252 | Liver | HCC | Salmonella infection | 178/4020 | 249/8465 | 5.90e-15 | 1.98e-13 | 1.10e-13 | 178 |
| hsa0513052 | Liver | HCC | Pathogenic Escherichia coli infection | 129/4020 | 197/8465 | 2.02e-07 | 2.50e-06 | 1.39e-06 | 129 |
| hsa0513152 | Liver | HCC | Shigellosis | 150/4020 | 247/8465 | 1.53e-05 | 1.04e-04 | 5.81e-05 | 150 |
| hsa049363 | Liver | HCC | Alcoholic liver disease | 89/4020 | 142/8465 | 1.73e-04 | 8.53e-04 | 4.75e-04 | 89 |
| hsa0466811 | Liver | HCC | TNF signaling pathway | 73/4020 | 114/8465 | 2.53e-04 | 1.19e-03 | 6.63e-04 | 73 |
| Page: 1 |
Top |
Cell-cell communication analysis |
| Identification of potential cell-cell interactions between two cell types and their ligand-receptor pairs for different disease states |
| Ligand | Receptor | LRpair | Pathway | Tissue | Disease Stage |
| Page: 1 |
Top |
Single-cell gene regulatory network inference analysis |
| Find out the significant the regulons (TFs) and the target genes of each regulon across cell types for different disease states |
| TF | Cell Type | Tissue | Disease Stage | Target Gene | RSS | Regulon Activity |
| ∗The dot plots of a searched regulon are shown for all cell subpopulations in each disease state of each tissue based on the regulon specific score inferred using pySCENIC and by calculating the average expression. |
| Page: 1 |
Top |
Somatic mutation of malignant transformation related genes |
| Annotation of somatic variants for genes involved in malignant transformation |
| Hugo Symbol | Variant Class | Variant Classification | dbSNP RS | HGVSc | HGVSp | HGVSp Short | SWISSPROT | BIOTYPE | SIFT | PolyPhen | Tumor Sample Barcode | Tissue | Histology | Sex | Age | Stage | Therapy Types | Drugs | Outcome |
| TAB3 | SNV | Missense_Mutation | c.1423N>C | p.Glu475Gln | p.E475Q | Q8N5C8 | protein_coding | tolerated(0.18) | benign(0.106) | TCGA-A2-A0SY-01 | Breast | breast invasive carcinoma | Female | <65 | III/IV | Hormone Therapy | arimidex | SD | |
| TAB3 | SNV | Missense_Mutation | rs367663654 | c.1997G>A | p.Arg666Gln | p.R666Q | Q8N5C8 | protein_coding | tolerated(0.75) | benign(0) | TCGA-AN-A046-01 | Breast | breast invasive carcinoma | Female | >=65 | I/II | Unknown | Unknown | SD |
| TAB3 | SNV | Missense_Mutation | novel | c.497N>A | p.Gly166Glu | p.G166E | Q8N5C8 | protein_coding | deleterious(0.01) | possibly_damaging(0.653) | TCGA-AR-A2LE-01 | Breast | breast invasive carcinoma | Female | >=65 | I/II | Hormone Therapy | tamoxiphen | PD |
| TAB3 | SNV | Missense_Mutation | c.1384G>A | p.Ala462Thr | p.A462T | Q8N5C8 | protein_coding | tolerated(0.19) | benign(0.007) | TCGA-D8-A1X6-01 | Breast | breast invasive carcinoma | Female | >=65 | III/IV | Hormone Therapy | tamoxiphen | SD | |
| TAB3 | SNV | Missense_Mutation | novel | c.46N>G | p.Leu16Val | p.L16V | Q8N5C8 | protein_coding | deleterious(0) | probably_damaging(0.999) | TCGA-E2-A574-01 | Breast | breast invasive carcinoma | Female | <65 | I/II | Chemotherapy | adriamycin | SD |
| TAB3 | SNV | Missense_Mutation | novel | c.1124N>T | p.Arg375Ile | p.R375I | Q8N5C8 | protein_coding | deleterious(0) | probably_damaging(0.999) | TCGA-S3-AA0Z-01 | Breast | breast invasive carcinoma | Female | <65 | I/II | Ancillary | neulasta | CR |
| TAB3 | SNV | Missense_Mutation | rs141293756 | c.1426N>T | p.Arg476Cys | p.R476C | Q8N5C8 | protein_coding | deleterious(0) | possibly_damaging(0.655) | TCGA-EA-A3HU-01 | Cervix | cervical & endocervical cancer | Female | <65 | I/II | Unknown | Unknown | SD |
| TAB3 | SNV | Missense_Mutation | c.1740G>C | p.Met580Ile | p.M580I | Q8N5C8 | protein_coding | tolerated(0.44) | benign(0.026) | TCGA-EA-A3QD-01 | Cervix | cervical & endocervical cancer | Female | <65 | III/IV | Chemotherapy | cisplatin | CR | |
| TAB3 | SNV | Missense_Mutation | c.96G>A | p.Met32Ile | p.M32I | Q8N5C8 | protein_coding | tolerated(0.07) | benign(0.147) | TCGA-EK-A2RN-01 | Cervix | cervical & endocervical cancer | Female | <65 | I/II | Unknown | Unknown | SD | |
| TAB3 | SNV | Missense_Mutation | c.1232C>T | p.Ser411Leu | p.S411L | Q8N5C8 | protein_coding | deleterious(0.03) | probably_damaging(0.999) | TCGA-IR-A3LH-01 | Cervix | cervical & endocervical cancer | Female | <65 | I/II | Chemotherapy | cisplatin | CR |
| Page: 1 2 3 4 5 6 7 8 9 10 11 12 13 |
Top |
Related drugs of malignant transformation related genes |
| Identification of chemicals and drugs interact with genes involved in malignant transfromation |
| (DGIdb 4.0) |
| Entrez ID | Symbol | Category | Interaction Types | Drug Claim Name | Drug Name | PMIDs |
| Page: 1 |

Copyright 2023-Present -The University of Texas Health Science Center at Houston |