
|
|||||
|
 | |
| |
| |
| |
| |
| |
|
Gene: SZRD1 |
Gene summary for SZRD1 |
| Gene information | Species | Human | Gene symbol | SZRD1 | Gene ID | 26099 |
| Gene name | SUZ RNA binding domain containing 1 | |
| Gene Alias | C1orf144 | |
| Cytomap | 1p36.13 | |
| Gene Type | protein-coding | GO ID | NA | UniProtAcc | Q7Z422 |
Top |
Malignant transformation analysis |
| Identification of the aberrant gene expression in precancerous and cancerous lesions by comparing the gene expression of stem-like cells in diseased tissues with normal stem cells |
| Entrez ID | Symbol | Replicates | Species | Organ | Tissue | Adj P-value | Log2FC | Malignancy |
| 26099 | SZRD1 | LZE2T | Human | Esophagus | ESCC | 1.98e-04 | 3.23e-01 | 0.082 |
| 26099 | SZRD1 | LZE4T | Human | Esophagus | ESCC | 3.89e-05 | 1.05e-01 | 0.0811 |
| 26099 | SZRD1 | LZE7T | Human | Esophagus | ESCC | 1.13e-04 | 4.59e-01 | 0.0667 |
| 26099 | SZRD1 | LZE8T | Human | Esophagus | ESCC | 3.30e-10 | 3.79e-01 | 0.067 |
| 26099 | SZRD1 | LZE20T | Human | Esophagus | ESCC | 6.17e-08 | 3.62e-01 | 0.0662 |
| 26099 | SZRD1 | LZE22T | Human | Esophagus | ESCC | 1.65e-05 | 3.91e-01 | 0.068 |
| 26099 | SZRD1 | LZE24T | Human | Esophagus | ESCC | 5.80e-21 | 5.21e-01 | 0.0596 |
| 26099 | SZRD1 | LZE6T | Human | Esophagus | ESCC | 2.15e-04 | 4.46e-01 | 0.0845 |
| 26099 | SZRD1 | P1T-E | Human | Esophagus | ESCC | 6.23e-07 | 5.62e-01 | 0.0875 |
| 26099 | SZRD1 | P2T-E | Human | Esophagus | ESCC | 9.64e-44 | 9.38e-01 | 0.1177 |
| 26099 | SZRD1 | P4T-E | Human | Esophagus | ESCC | 1.49e-29 | 6.51e-01 | 0.1323 |
| 26099 | SZRD1 | P5T-E | Human | Esophagus | ESCC | 1.75e-19 | 3.25e-01 | 0.1327 |
| 26099 | SZRD1 | P8T-E | Human | Esophagus | ESCC | 3.57e-31 | 5.78e-01 | 0.0889 |
| 26099 | SZRD1 | P9T-E | Human | Esophagus | ESCC | 3.36e-25 | 3.87e-01 | 0.1131 |
| 26099 | SZRD1 | P10T-E | Human | Esophagus | ESCC | 1.18e-37 | 7.31e-01 | 0.116 |
| 26099 | SZRD1 | P11T-E | Human | Esophagus | ESCC | 3.21e-15 | 7.69e-01 | 0.1426 |
| 26099 | SZRD1 | P12T-E | Human | Esophagus | ESCC | 5.01e-21 | 4.87e-01 | 0.1122 |
| 26099 | SZRD1 | P15T-E | Human | Esophagus | ESCC | 7.94e-31 | 7.83e-01 | 0.1149 |
| 26099 | SZRD1 | P16T-E | Human | Esophagus | ESCC | 3.07e-24 | 4.20e-01 | 0.1153 |
| 26099 | SZRD1 | P17T-E | Human | Esophagus | ESCC | 1.40e-16 | 7.23e-01 | 0.1278 |
| Page: 1 2 3 4 5 6 |
| Tissue | Expression Dynamics | Abbreviation |
| Esophagus |  | ESCC: Esophageal squamous cell carcinoma |
| HGIN: High-grade intraepithelial neoplasias | ||
| LGIN: Low-grade intraepithelial neoplasias | ||
| Liver | 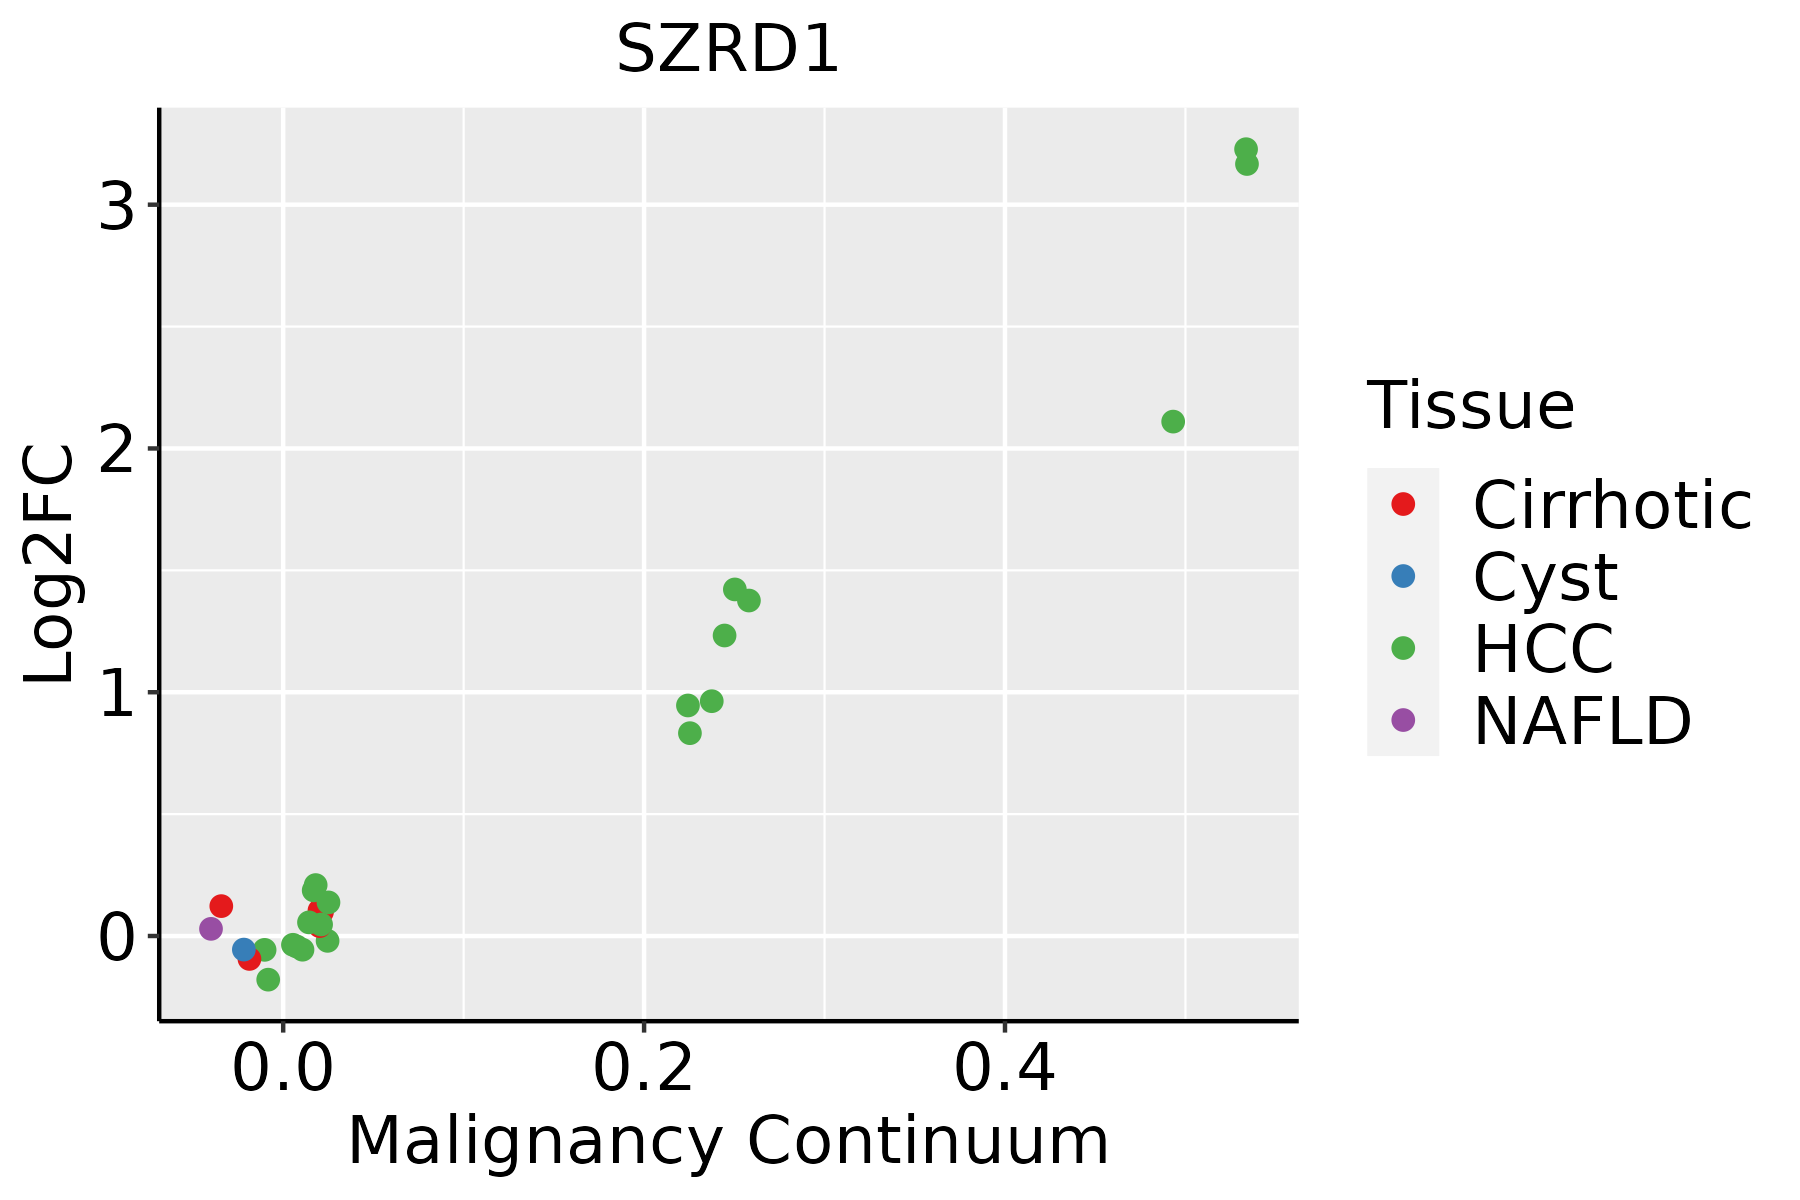 | HCC: Hepatocellular carcinoma |
| NAFLD: Non-alcoholic fatty liver disease | ||
| Oral Cavity | 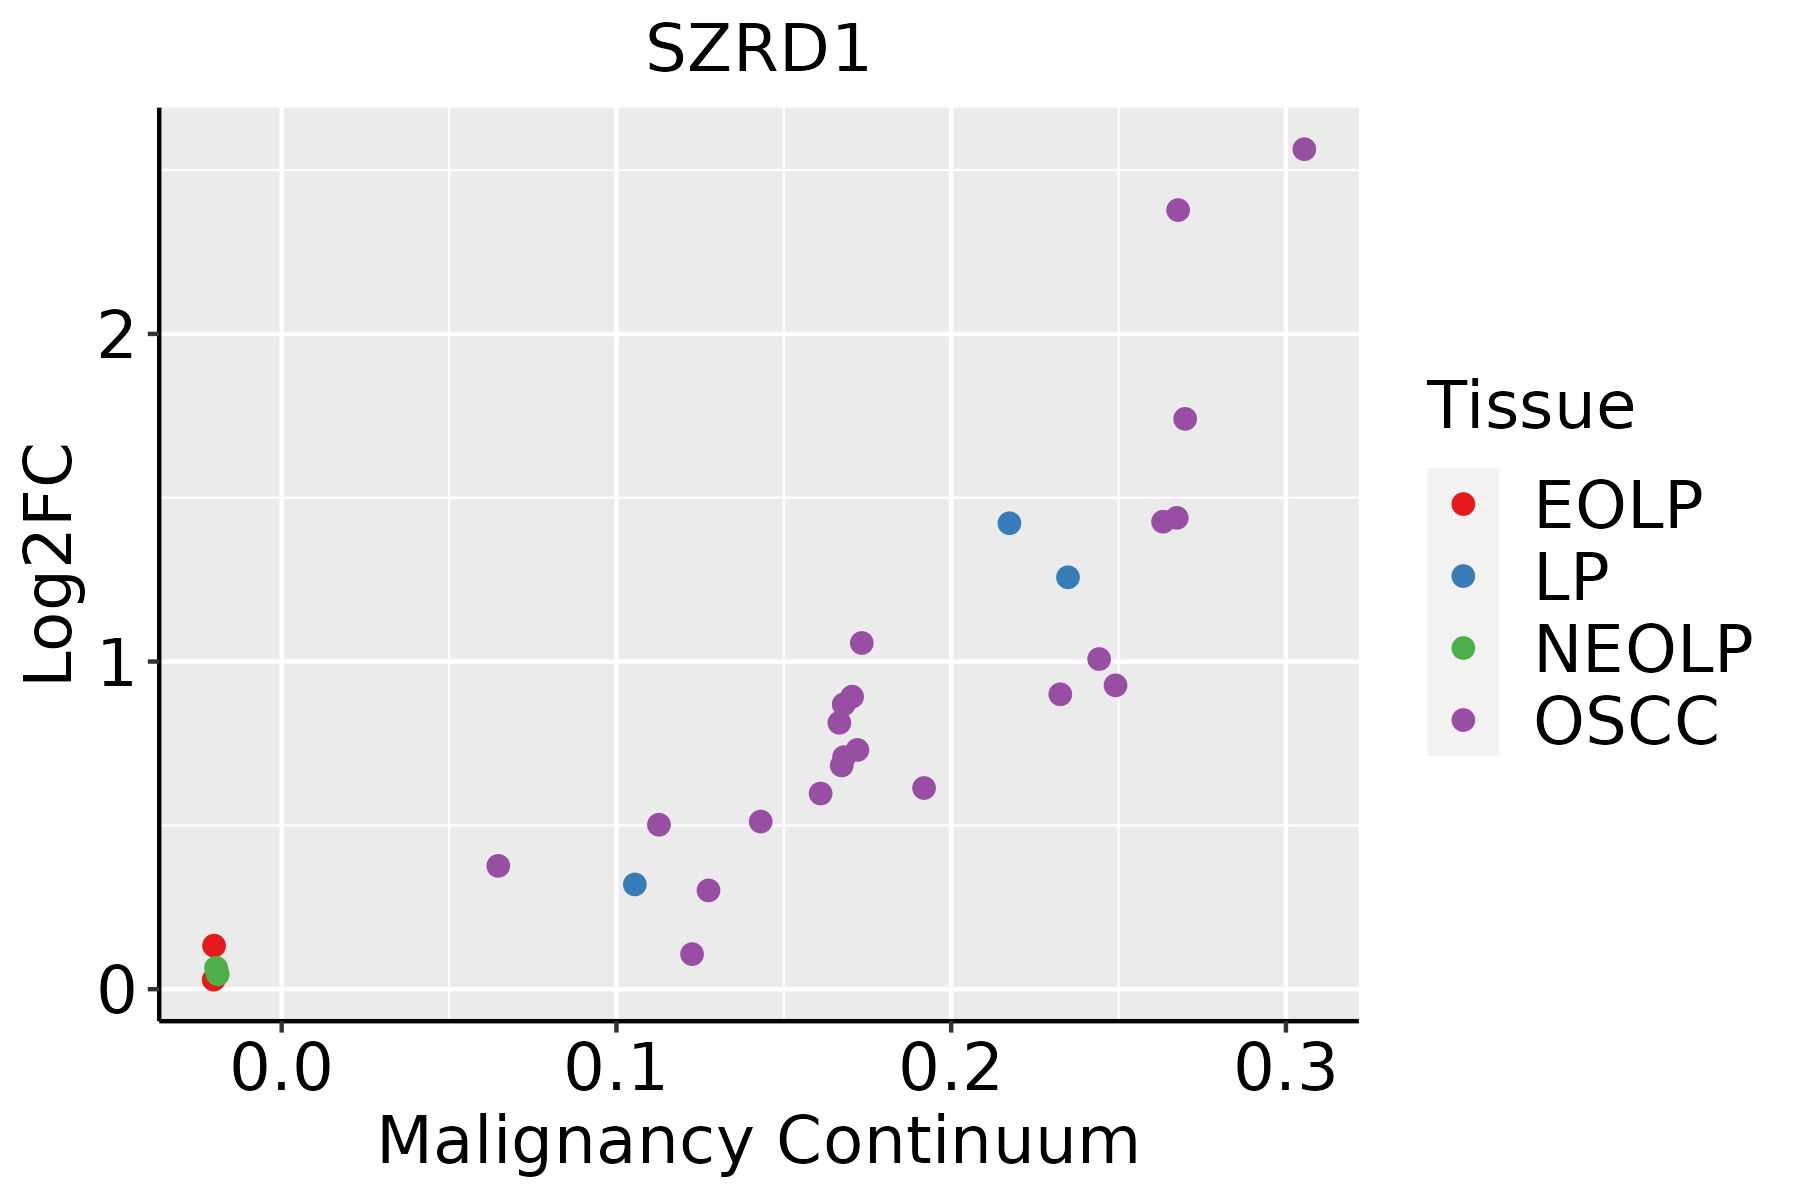 | EOLP: Erosive Oral lichen planus |
| LP: leukoplakia | ||
| NEOLP: Non-erosive oral lichen planus | ||
| OSCC: Oral squamous cell carcinoma | ||
| Skin | 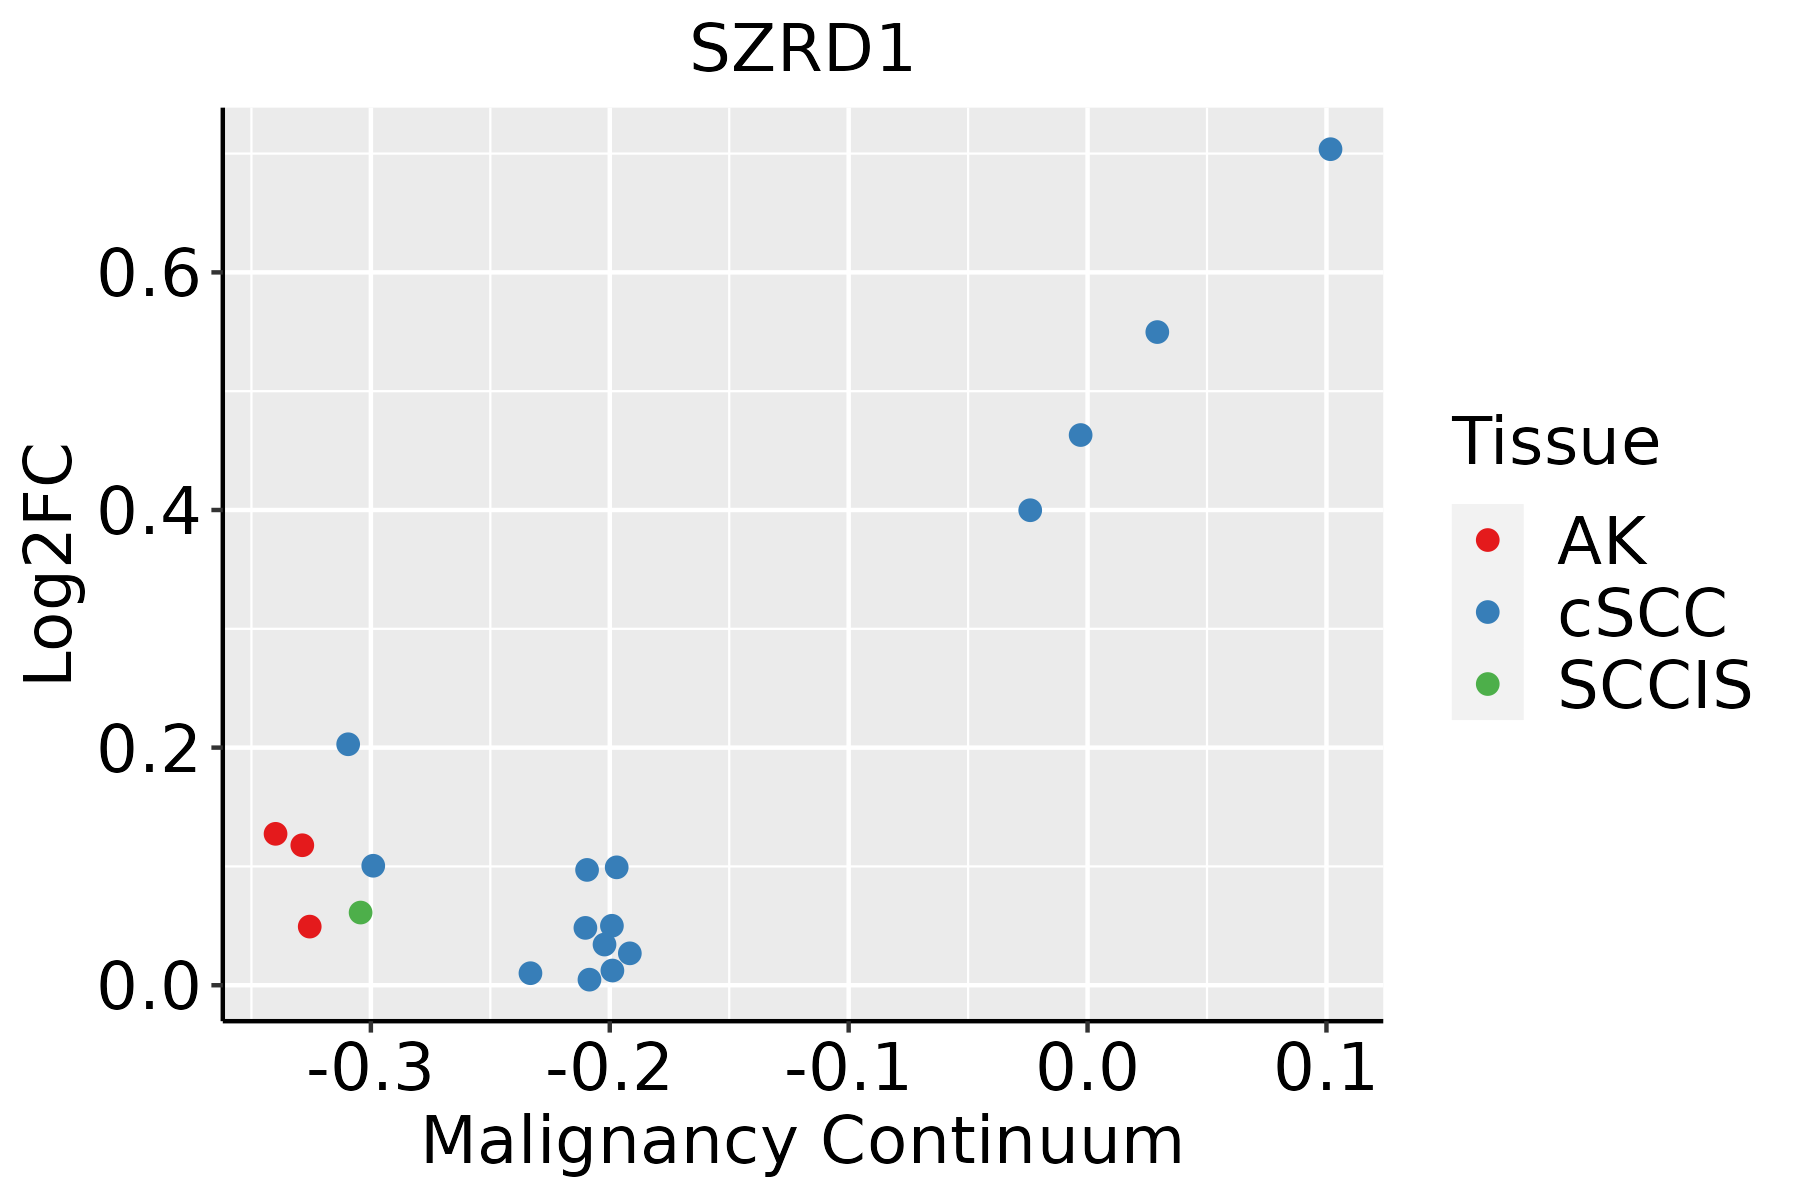 | AK: Actinic keratosis |
| cSCC: Cutaneous squamous cell carcinoma | ||
| SCCIS:squamous cell carcinoma in situ | ||
| Thyroid | 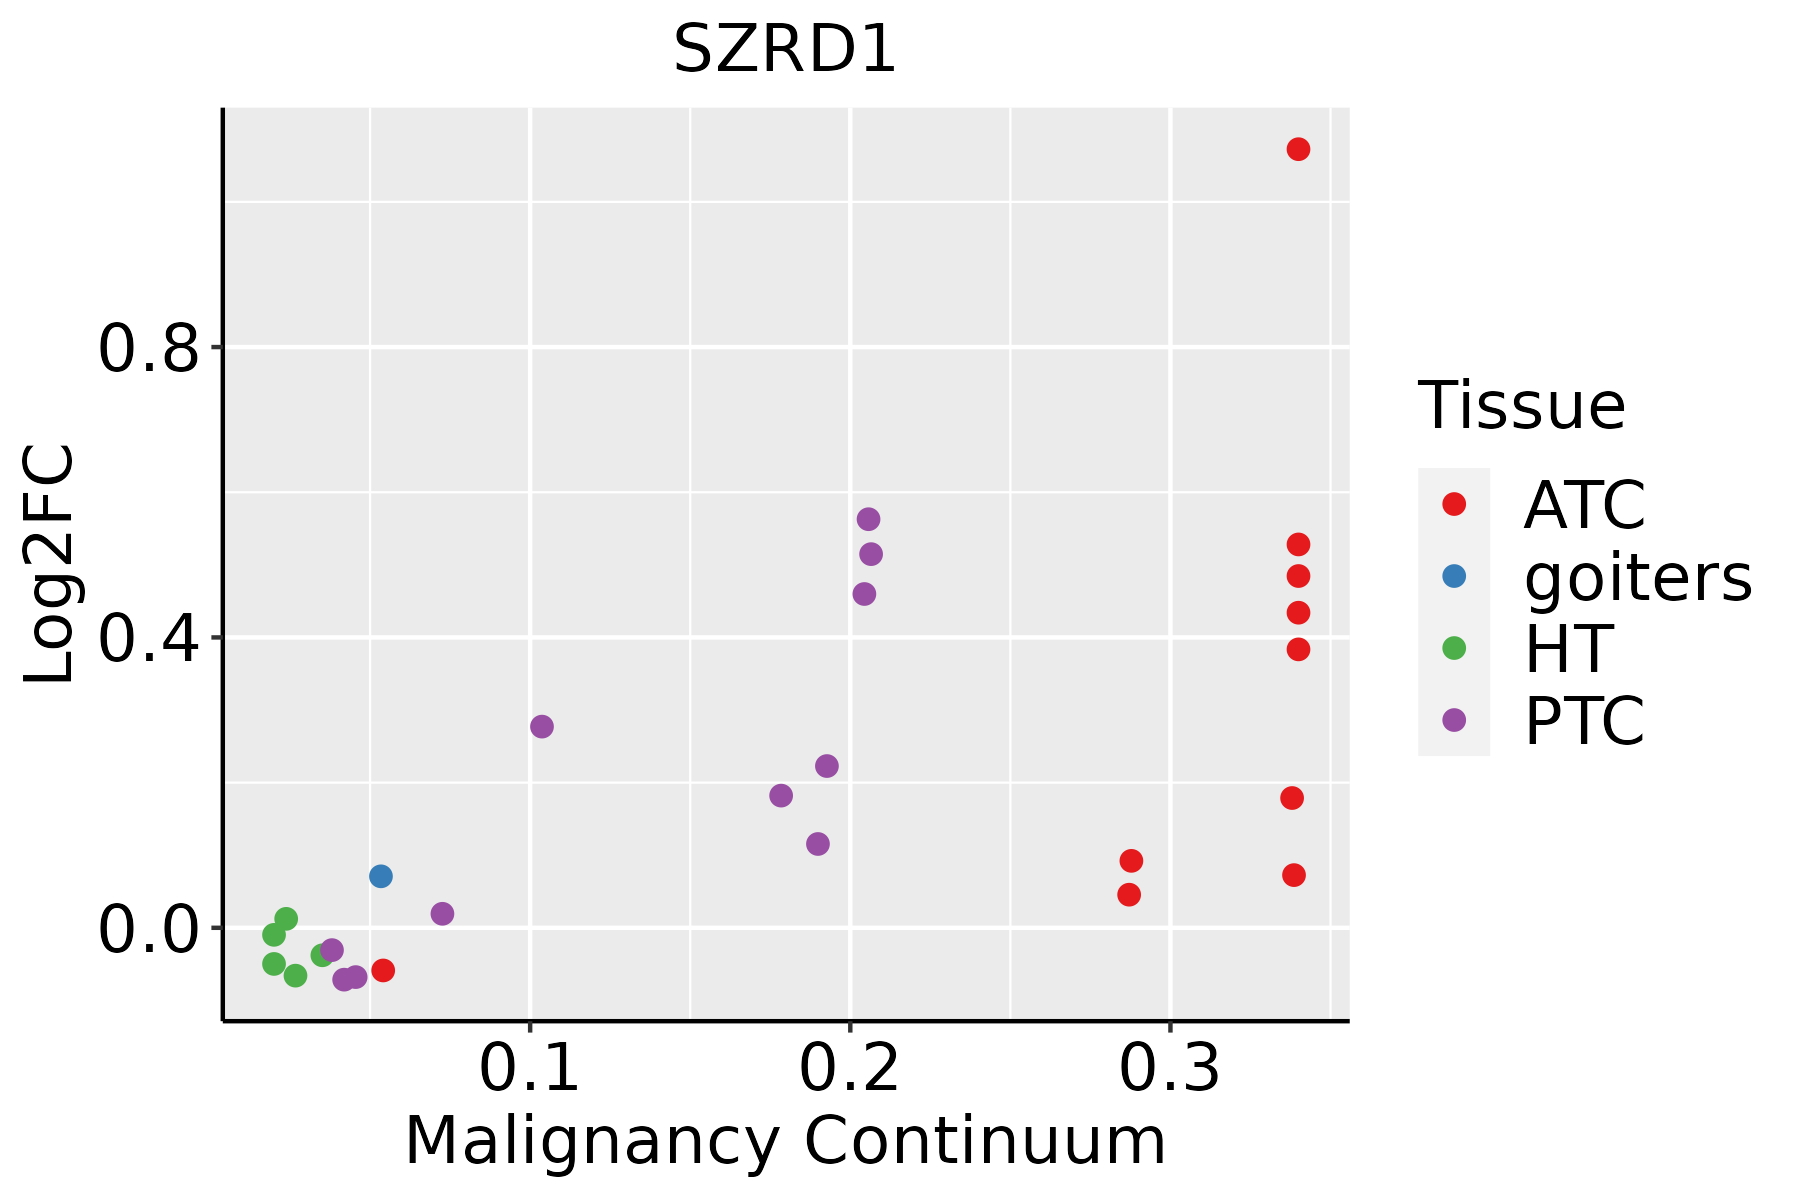 | ATC: Anaplastic thyroid cancer |
| HT: Hashimoto's thyroiditis | ||
| PTC: Papillary thyroid cancer |
| ∗log2FC in expression of this searched gene in stem-like cells from each diseased tissue sample relative to stem-like cells in normal samples in each tissue plotted against the malignancy continuum. Samples are colored based on if they are from different disease stage. |
Top |
Malignant transformation related pathway analysis |
| Find out the enriched GO biological processes and KEGG pathways involved in transition from healthy to precancer to cancer |
| Tissue | Disease Stage | Enriched GO biological Processes |
| Colorectum | AD |  |
| Colorectum | SER |  |
| Colorectum | MSS |  |
| Colorectum | MSI-H |  |
| Colorectum | FAP |  |
| ∗Top 15 enriched GO BP terms are showed in the bar plot of each disease state in each tissue. Each row represents a significant GO biological process which is colored according to the -log10(p.adjust). |
| Page: 1 2 3 4 5 6 7 8 9 |
| GO ID | Tissue | Disease Stage | Description | Gene Ratio | Bg Ratio | pvalue | p.adjust | Count |
| Page: 1 |
| Pathway ID | Tissue | Disease Stage | Description | Gene Ratio | Bg Ratio | pvalue | p.adjust | qvalue | Count |
| Page: 1 |
Top |
Cell-cell communication analysis |
| Identification of potential cell-cell interactions between two cell types and their ligand-receptor pairs for different disease states |
| Ligand | Receptor | LRpair | Pathway | Tissue | Disease Stage |
| Page: 1 |
Top |
Single-cell gene regulatory network inference analysis |
| Find out the significant the regulons (TFs) and the target genes of each regulon across cell types for different disease states |
| TF | Cell Type | Tissue | Disease Stage | Target Gene | RSS | Regulon Activity |
| ∗The dot plots of a searched regulon are shown for all cell subpopulations in each disease state of each tissue based on the regulon specific score inferred using pySCENIC and by calculating the average expression. |
| Page: 1 |
Top |
Somatic mutation of malignant transformation related genes |
| Annotation of somatic variants for genes involved in malignant transformation |
| Hugo Symbol | Variant Class | Variant Classification | dbSNP RS | HGVSc | HGVSp | HGVSp Short | SWISSPROT | BIOTYPE | SIFT | PolyPhen | Tumor Sample Barcode | Tissue | Histology | Sex | Age | Stage | Therapy Types | Drugs | Outcome |
| SZRD1 | SNV | Missense_Mutation | c.200N>T | p.Thr67Ile | p.T67I | Q7Z422 | protein_coding | deleterious(0) | benign(0.179) | TCGA-A8-A090-01 | Breast | breast invasive carcinoma | Female | >=65 | I/II | Unknown | Unknown | SD | |
| SZRD1 | SNV | Missense_Mutation | novel | c.422N>A | p.Gly141Asp | p.G141D | Q7Z422 | protein_coding | deleterious(0) | probably_damaging(0.999) | TCGA-BH-A0E2-01 | Breast | breast invasive carcinoma | Female | <65 | III/IV | Chemotherapy | doxorubicin | SD |
| SZRD1 | SNV | Missense_Mutation | c.192N>C | p.Lys64Asn | p.K64N | Q7Z422 | protein_coding | deleterious(0) | probably_damaging(0.995) | TCGA-E2-A152-01 | Breast | breast invasive carcinoma | Female | <65 | I/II | Targeted Molecular therapy | trastuzumab | PD | |
| SZRD1 | insertion | Frame_Shift_Ins | novel | c.163_164insCCTTCTCAGCCTCTTTCTTCTCTCTGCTTTTCTCTAAAAT | p.Gly55AlafsTer93 | p.G55Afs*93 | Q7Z422 | protein_coding | TCGA-A8-A06P-01 | Breast | breast invasive carcinoma | Female | <65 | III/IV | Unspecific | SD | |||
| SZRD1 | SNV | Missense_Mutation | novel | c.325N>A | p.Glu109Lys | p.E109K | Q7Z422 | protein_coding | deleterious(0) | benign(0.153) | TCGA-VS-A94X-01 | Cervix | cervical & endocervical cancer | Female | <65 | I/II | Chemotherapy | cisplatin | PD |
| SZRD1 | insertion | Frame_Shift_Ins | novel | c.60_61insA | p.Arg21LysfsTer31 | p.R21Kfs*31 | Q7Z422 | protein_coding | TCGA-VS-A8EK-01 | Cervix | cervical & endocervical cancer | Female | >=65 | I/II | Chemotherapy | cisplatin | PD | ||
| SZRD1 | SNV | Missense_Mutation | rs374656978 | c.452N>A | p.Arg151His | p.R151H | Q7Z422 | protein_coding | tolerated(0.35) | possibly_damaging(0.886) | TCGA-EI-6917-01 | Colorectum | rectum adenocarcinoma | Male | <65 | III/IV | Chemotherapy | 5fluorouracil+oxaciplatina+l-folinian | SD |
| SZRD1 | SNV | Missense_Mutation | novel | c.302N>A | p.Arg101Gln | p.R101Q | Q7Z422 | protein_coding | deleterious(0.05) | probably_damaging(0.988) | TCGA-A5-A0G2-01 | Endometrium | uterine corpus endometrioid carcinoma | Female | <65 | III/IV | Unknown | Unknown | SD |
| SZRD1 | SNV | Missense_Mutation | rs374656978 | c.452G>A | p.Arg151His | p.R151H | Q7Z422 | protein_coding | tolerated(0.35) | possibly_damaging(0.886) | TCGA-A5-A1OF-01 | Endometrium | uterine corpus endometrioid carcinoma | Female | <65 | I/II | Unknown | Unknown | SD |
| SZRD1 | SNV | Missense_Mutation | c.65N>A | p.Arg22Gln | p.R22Q | Q7Z422 | protein_coding | tolerated(0.12) | probably_damaging(0.953) | TCGA-AP-A059-01 | Endometrium | uterine corpus endometrioid carcinoma | Female | >=65 | I/II | Unknown | Unknown | SD |
| Page: 1 2 |
Top |
Related drugs of malignant transformation related genes |
| Identification of chemicals and drugs interact with genes involved in malignant transfromation |
| (DGIdb 4.0) |
| Entrez ID | Symbol | Category | Interaction Types | Drug Claim Name | Drug Name | PMIDs |
| Page: 1 |

Copyright 2023-Present -The University of Texas Health Science Center at Houston |