
|
|||||
|
 | |
| |
| |
| |
| |
| |
|
Gene: SYTL3 |
Gene summary for SYTL3 |
| Gene information | Species | Human | Gene symbol | SYTL3 | Gene ID | 94120 |
| Gene name | synaptotagmin like 3 | |
| Gene Alias | SLP3 | |
| Cytomap | 6q25.3 | |
| Gene Type | protein-coding | GO ID | GO:0006810 | UniProtAcc | B4E2A9 |
Top |
Malignant transformation analysis |
| Identification of the aberrant gene expression in precancerous and cancerous lesions by comparing the gene expression of stem-like cells in diseased tissues with normal stem cells |
| Entrez ID | Symbol | Replicates | Species | Organ | Tissue | Adj P-value | Log2FC | Malignancy |
| 94120 | SYTL3 | C21 | Human | Oral cavity | OSCC | 8.39e-08 | 3.27e-01 | 0.2678 |
| 94120 | SYTL3 | C38 | Human | Oral cavity | OSCC | 3.65e-03 | 4.57e-01 | 0.172 |
| 94120 | SYTL3 | C43 | Human | Oral cavity | OSCC | 3.74e-11 | 5.81e-02 | 0.1704 |
| 94120 | SYTL3 | C46 | Human | Oral cavity | OSCC | 2.29e-06 | 1.79e-01 | 0.1673 |
| 94120 | SYTL3 | LN46 | Human | Oral cavity | OSCC | 3.48e-04 | 1.66e-01 | 0.1666 |
| 94120 | SYTL3 | EOLP-1 | Human | Oral cavity | EOLP | 7.02e-15 | 5.62e-01 | -0.0202 |
| 94120 | SYTL3 | EOLP-2 | Human | Oral cavity | EOLP | 4.24e-16 | 6.50e-01 | -0.0203 |
| 94120 | SYTL3 | NEOLP-1 | Human | Oral cavity | NEOLP | 1.39e-05 | 3.59e-01 | -0.0194 |
| 94120 | SYTL3 | SYSMH6 | Human | Oral cavity | OSCC | 2.00e-10 | 2.15e-02 | 0.1275 |
| 94120 | SYTL3 | HTA12-16-5 | Human | Pancreas | PDAC | 1.26e-05 | 5.13e-01 | 0.047 |
| 94120 | SYTL3 | HTA12-18-3 | Human | Pancreas | PDAC | 5.38e-06 | 7.07e-01 | 0.0716 |
| 94120 | SYTL3 | HTA12-9-1 | Human | Pancreas | PDAC | 2.42e-04 | 4.18e-01 | 0.1532 |
| Page: 1 |
| Tissue | Expression Dynamics | Abbreviation |
| Oral Cavity | 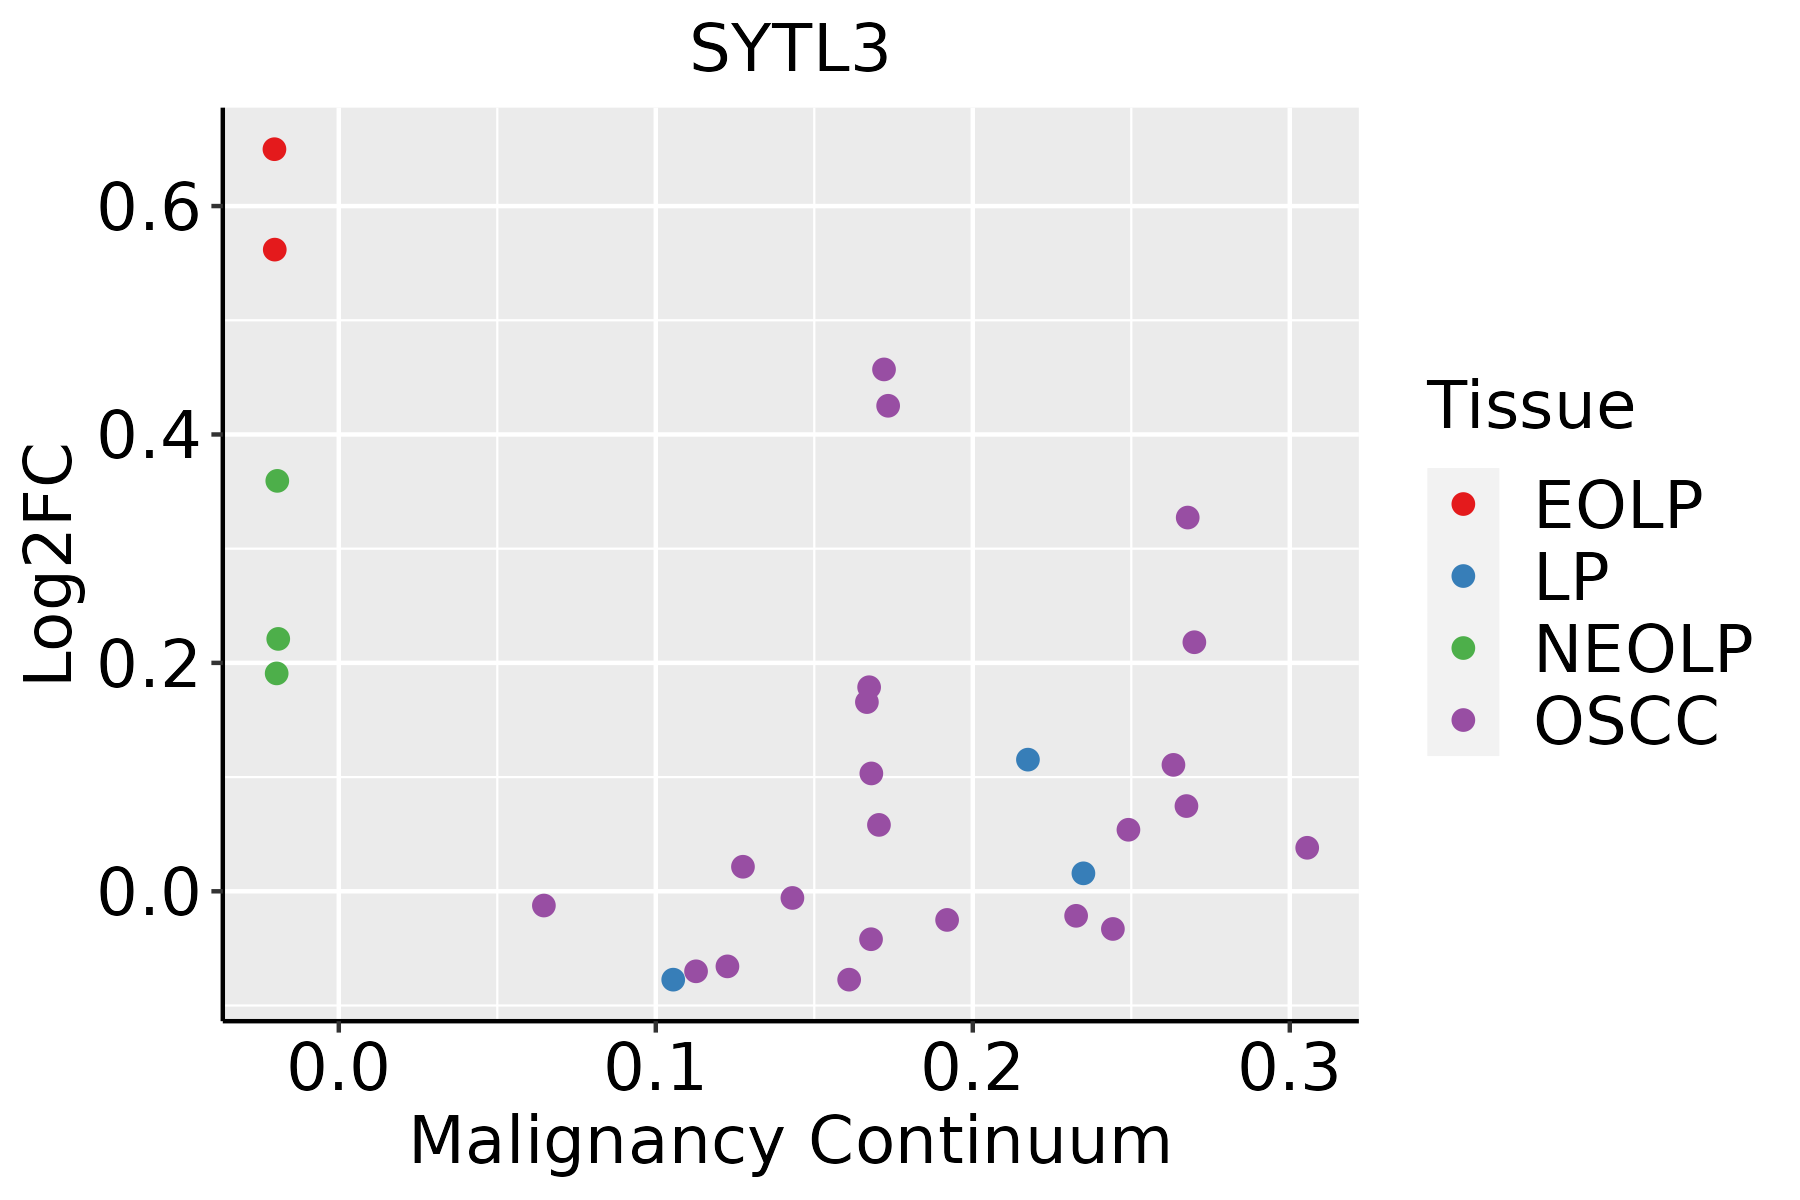 | EOLP: Erosive Oral lichen planus |
| LP: leukoplakia | ||
| NEOLP: Non-erosive oral lichen planus | ||
| OSCC: Oral squamous cell carcinoma |
| ∗log2FC in expression of this searched gene in stem-like cells from each diseased tissue sample relative to stem-like cells in normal samples in each tissue plotted against the malignancy continuum. Samples are colored based on if they are from different disease stage. |
Top |
Malignant transformation related pathway analysis |
| Find out the enriched GO biological processes and KEGG pathways involved in transition from healthy to precancer to cancer |
| Tissue | Disease Stage | Enriched GO biological Processes |
| Colorectum | AD |  |
| Colorectum | SER |  |
| Colorectum | MSS |  |
| Colorectum | MSI-H |  |
| Colorectum | FAP |  |
| ∗Top 15 enriched GO BP terms are showed in the bar plot of each disease state in each tissue. Each row represents a significant GO biological process which is colored according to the -log10(p.adjust). |
| Page: 1 2 3 4 5 6 7 8 9 |
| GO ID | Tissue | Disease Stage | Description | Gene Ratio | Bg Ratio | pvalue | p.adjust | Count |
| GO:00068874 | Oral cavity | EOLP | exocytosis | 60/2218 | 352/18723 | 2.32e-03 | 1.43e-02 | 60 |
| Page: 1 |
| Pathway ID | Tissue | Disease Stage | Description | Gene Ratio | Bg Ratio | pvalue | p.adjust | qvalue | Count |
| Page: 1 |
Top |
Cell-cell communication analysis |
| Identification of potential cell-cell interactions between two cell types and their ligand-receptor pairs for different disease states |
| Ligand | Receptor | LRpair | Pathway | Tissue | Disease Stage |
| Page: 1 |
Top |
Single-cell gene regulatory network inference analysis |
| Find out the significant the regulons (TFs) and the target genes of each regulon across cell types for different disease states |
| TF | Cell Type | Tissue | Disease Stage | Target Gene | RSS | Regulon Activity |
| ∗The dot plots of a searched regulon are shown for all cell subpopulations in each disease state of each tissue based on the regulon specific score inferred using pySCENIC and by calculating the average expression. |
| Page: 1 |
Top |
Somatic mutation of malignant transformation related genes |
| Annotation of somatic variants for genes involved in malignant transformation |
| Hugo Symbol | Variant Class | Variant Classification | dbSNP RS | HGVSc | HGVSp | HGVSp Short | SWISSPROT | BIOTYPE | SIFT | PolyPhen | Tumor Sample Barcode | Tissue | Histology | Sex | Age | Stage | Therapy Types | Drugs | Outcome |
| SYTL3 | SNV | Missense_Mutation | c.953N>C | p.Phe318Ser | p.F318S | Q4VX76 | protein_coding | tolerated(0.1) | benign(0.017) | TCGA-A8-A09Z-01 | Breast | breast invasive carcinoma | Female | >=65 | I/II | Unknown | Unknown | SD | |
| SYTL3 | SNV | Missense_Mutation | c.46G>C | p.Glu16Gln | p.E16Q | Q4VX76 | protein_coding | deleterious(0.01) | possibly_damaging(0.876) | TCGA-D8-A1JA-01 | Breast | breast invasive carcinoma | Female | <65 | III/IV | Chemotherapy | adriamycin | PD | |
| SYTL3 | SNV | Missense_Mutation | c.338A>G | p.Lys113Arg | p.K113R | Q4VX76 | protein_coding | tolerated(0.16) | benign(0.263) | TCGA-D8-A1JK-01 | Breast | breast invasive carcinoma | Female | >=65 | I/II | Unknown | Unknown | SD | |
| SYTL3 | SNV | Missense_Mutation | c.1723N>C | p.Lys575Gln | p.K575Q | Q4VX76 | protein_coding | tolerated(0.05) | benign(0.08) | TCGA-E2-A1IH-01 | Breast | breast invasive carcinoma | Female | >=65 | I/II | Hormone Therapy | aromasin | SD | |
| SYTL3 | insertion | In_Frame_Ins | novel | c.1486_1487insGGGTAG | p.Pro496delinsArgValAla | p.P496delinsRVA | Q4VX76 | protein_coding | TCGA-A2-A0D1-01 | Breast | breast invasive carcinoma | Female | >=65 | I/II | Chemotherapy | taxotere | SD | ||
| SYTL3 | insertion | Nonsense_Mutation | novel | c.1487_1488insTGCTGCCCAGCAAAAGAAGTAGGTCAGGAGGG | p.Asp497AlafsTer7 | p.D497Afs*7 | Q4VX76 | protein_coding | TCGA-A2-A0D1-01 | Breast | breast invasive carcinoma | Female | >=65 | I/II | Chemotherapy | taxotere | SD | ||
| SYTL3 | insertion | In_Frame_Ins | novel | c.1082_1083insGCGCGATCTCGGCTCACTGCAACCTCCATCTCCCAGGTA | p.Arg361_Lys362insArgAspLeuGlySerLeuGlnProProSerProArgTyr | p.R361_K362insRDLGSLQPPSPRY | Q4VX76 | protein_coding | TCGA-AO-A03P-01 | Breast | breast invasive carcinoma | Female | <65 | I/II | Hormone Therapy | letrozole | PD | ||
| SYTL3 | SNV | Missense_Mutation | novel | c.1599C>A | p.His533Gln | p.H533Q | Q4VX76 | protein_coding | deleterious(0) | probably_damaging(0.957) | TCGA-2W-A8YY-01 | Cervix | cervical & endocervical cancer | Female | <65 | I/II | Chemotherapy | cisplatin | CR |
| SYTL3 | SNV | Missense_Mutation | novel | c.1505C>T | p.Ser502Leu | p.S502L | Q4VX76 | protein_coding | deleterious(0.04) | benign(0.248) | TCGA-MA-AA3Z-01 | Cervix | cervical & endocervical cancer | Female | <65 | I/II | Unknown | Unknown | SD |
| SYTL3 | SNV | Missense_Mutation | c.1611N>A | p.Phe537Leu | p.F537L | Q4VX76 | protein_coding | deleterious(0.01) | probably_damaging(0.964) | TCGA-AA-3510-01 | Colorectum | colon adenocarcinoma | Male | >=65 | I/II | Unknown | Unknown | SD |
| Page: 1 2 3 4 5 6 7 |
Top |
Related drugs of malignant transformation related genes |
| Identification of chemicals and drugs interact with genes involved in malignant transfromation |
| (DGIdb 4.0) |
| Entrez ID | Symbol | Category | Interaction Types | Drug Claim Name | Drug Name | PMIDs |
| Page: 1 |

Copyright 2023-Present -The University of Texas Health Science Center at Houston |