
|
|||||
|
 | |
| |
| |
| |
| |
| |
|
Gene: SYTL2 |
Gene summary for SYTL2 |
| Gene information | Species | Human | Gene symbol | SYTL2 | Gene ID | 54843 |
| Gene name | synaptotagmin like 2 | |
| Gene Alias | CHR11SYT | |
| Cytomap | 11q14.1 | |
| Gene Type | protein-coding | GO ID | GO:0006810 | UniProtAcc | Q9HCH5 |
Top |
Malignant transformation analysis |
| Identification of the aberrant gene expression in precancerous and cancerous lesions by comparing the gene expression of stem-like cells in diseased tissues with normal stem cells |
| Entrez ID | Symbol | Replicates | Species | Organ | Tissue | Adj P-value | Log2FC | Malignancy |
| 54843 | SYTL2 | HTA11_3410_2000001011 | Human | Colorectum | AD | 1.02e-15 | -5.75e-01 | 0.0155 |
| 54843 | SYTL2 | HTA11_2951_2000001011 | Human | Colorectum | AD | 5.83e-06 | -8.55e-01 | 0.0216 |
| 54843 | SYTL2 | HTA11_78_2000001011 | Human | Colorectum | AD | 1.15e-15 | 1.17e+00 | -0.1088 |
| 54843 | SYTL2 | HTA11_347_2000001011 | Human | Colorectum | AD | 2.56e-23 | 1.11e+00 | -0.1954 |
| 54843 | SYTL2 | HTA11_411_2000001011 | Human | Colorectum | SER | 3.39e-13 | 1.65e+00 | -0.2602 |
| 54843 | SYTL2 | HTA11_2112_2000001011 | Human | Colorectum | SER | 1.23e-10 | 1.13e+00 | -0.2196 |
| 54843 | SYTL2 | HTA11_9341_2000001011 | Human | Colorectum | SER | 3.22e-02 | -7.47e-01 | -0.00410000000000005 |
| 54843 | SYTL2 | HTA11_866_3004761011 | Human | Colorectum | AD | 1.12e-06 | -4.40e-01 | 0.096 |
| 54843 | SYTL2 | HTA11_8622_2000001021 | Human | Colorectum | SER | 2.82e-04 | -5.75e-01 | 0.0528 |
| 54843 | SYTL2 | HTA11_7663_2000001011 | Human | Colorectum | SER | 3.78e-04 | -5.87e-01 | 0.0131 |
| 54843 | SYTL2 | HTA11_7696_3000711011 | Human | Colorectum | AD | 1.29e-04 | -3.90e-01 | 0.0674 |
| 54843 | SYTL2 | HTA11_99999970781_79442 | Human | Colorectum | MSS | 4.78e-07 | -4.25e-01 | 0.294 |
| 54843 | SYTL2 | HTA11_99999971662_82457 | Human | Colorectum | MSS | 1.62e-10 | -4.97e-01 | 0.3859 |
| 54843 | SYTL2 | HTA11_99999973899_84307 | Human | Colorectum | MSS | 3.64e-09 | -6.67e-01 | 0.2585 |
| 54843 | SYTL2 | HTA11_99999974143_84620 | Human | Colorectum | MSS | 1.49e-30 | -7.52e-01 | 0.3005 |
| 54843 | SYTL2 | F007 | Human | Colorectum | FAP | 9.97e-05 | 2.80e-01 | 0.1176 |
| 54843 | SYTL2 | A002-C-010 | Human | Colorectum | FAP | 2.72e-03 | 2.12e-01 | 0.242 |
| 54843 | SYTL2 | A001-C-207 | Human | Colorectum | FAP | 3.09e-07 | 3.28e-01 | 0.1278 |
| 54843 | SYTL2 | A015-C-203 | Human | Colorectum | FAP | 2.29e-29 | -7.05e-02 | -0.1294 |
| 54843 | SYTL2 | A015-C-204 | Human | Colorectum | FAP | 7.25e-07 | 1.08e-02 | -0.0228 |
| Page: 1 2 3 4 5 6 |
| Tissue | Expression Dynamics | Abbreviation |
| Colorectum (GSE201348) |  | FAP: Familial adenomatous polyposis |
| CRC: Colorectal cancer | ||
| Colorectum (HTA11) |  | AD: Adenomas |
| SER: Sessile serrated lesions | ||
| MSI-H: Microsatellite-high colorectal cancer | ||
| MSS: Microsatellite stable colorectal cancer | ||
| Esophagus |  | ESCC: Esophageal squamous cell carcinoma |
| HGIN: High-grade intraepithelial neoplasias | ||
| LGIN: Low-grade intraepithelial neoplasias | ||
| GC |  | CAG: Chronic atrophic gastritis |
| CAG with IM: Chronic atrophic gastritis with intestinal metaplasia | ||
| CSG: Chronic superficial gastritis | ||
| GC: Gastric cancer | ||
| SIM: Severe intestinal metaplasia | ||
| WIM: Wild intestinal metaplasia | ||
| Lung | 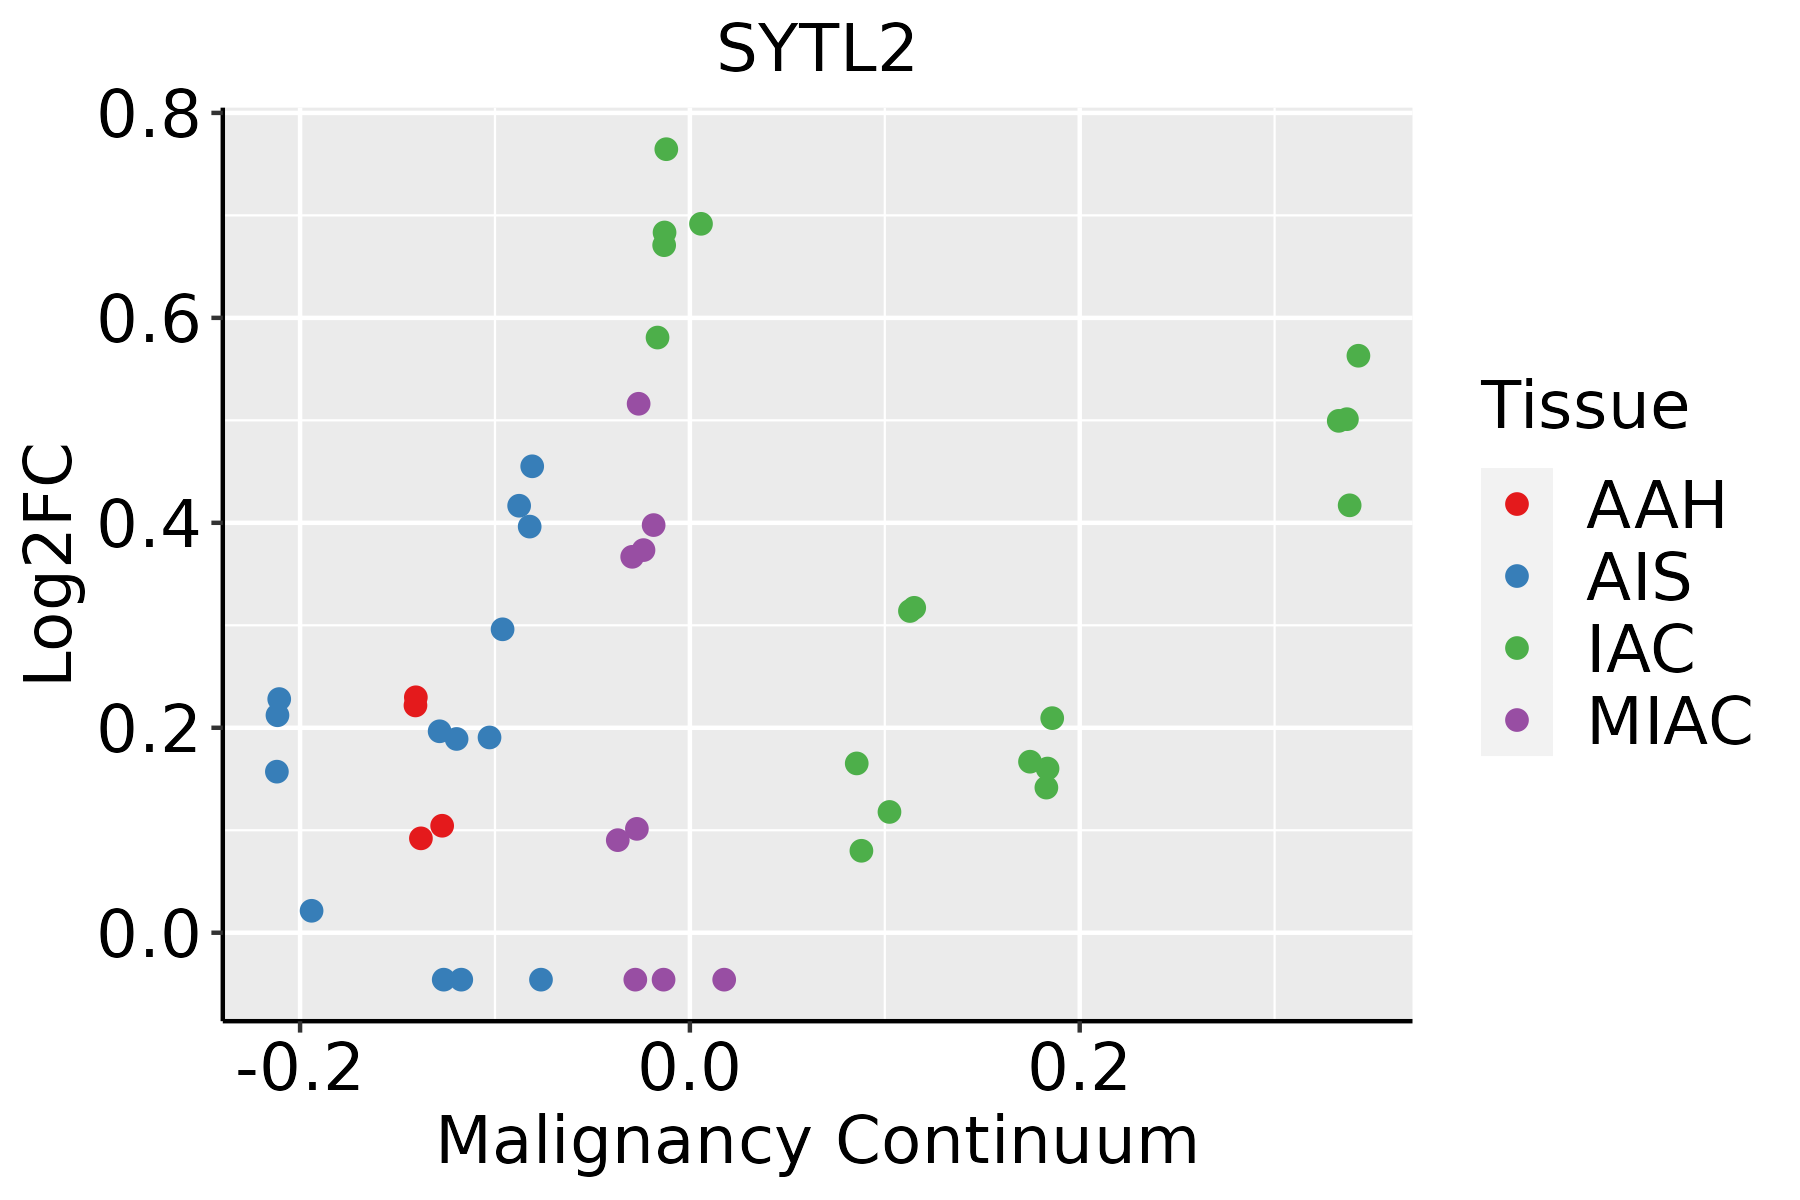 | AAH: Atypical adenomatous hyperplasia |
| AIS: Adenocarcinoma in situ | ||
| IAC: Invasive lung adenocarcinoma | ||
| MIA: Minimally invasive adenocarcinoma | ||
| Prostate | 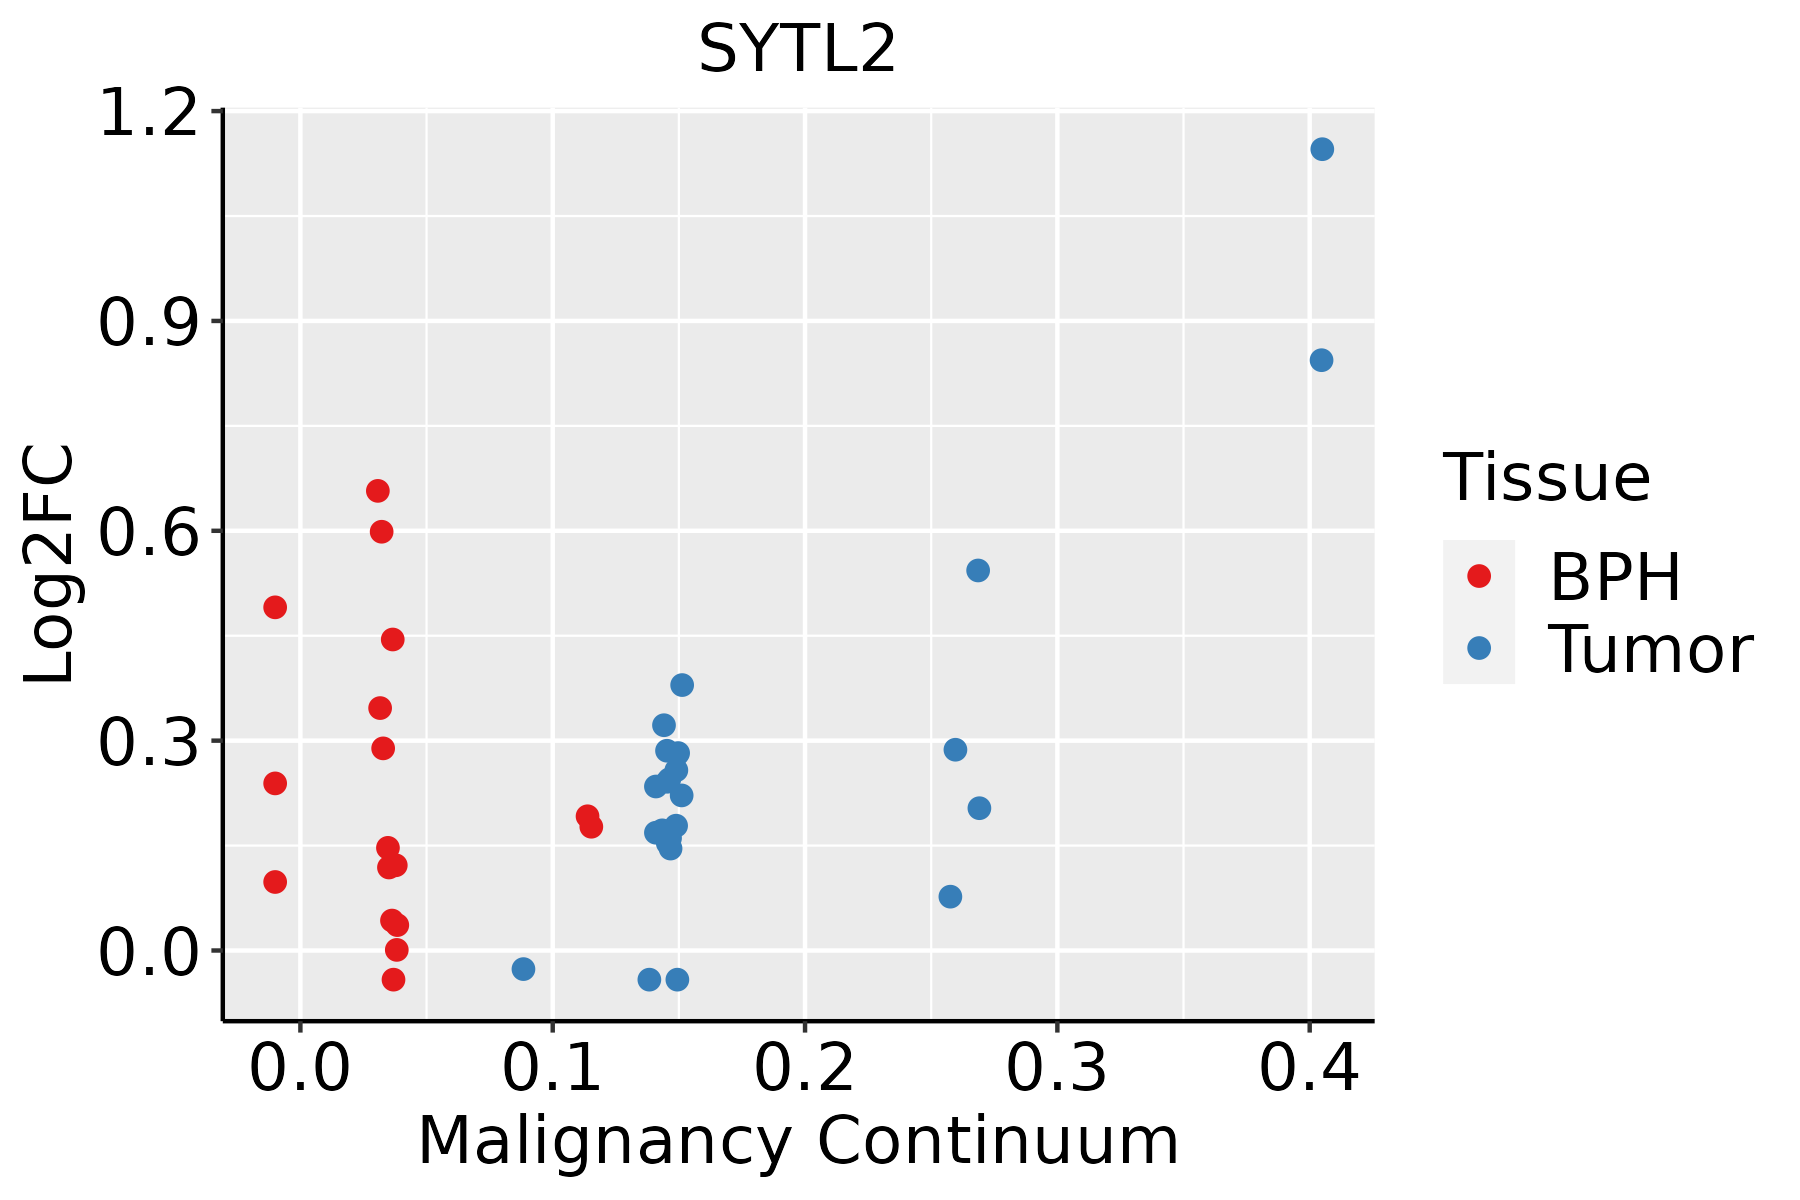 | BPH: Benign Prostatic Hyperplasia |
| Thyroid | 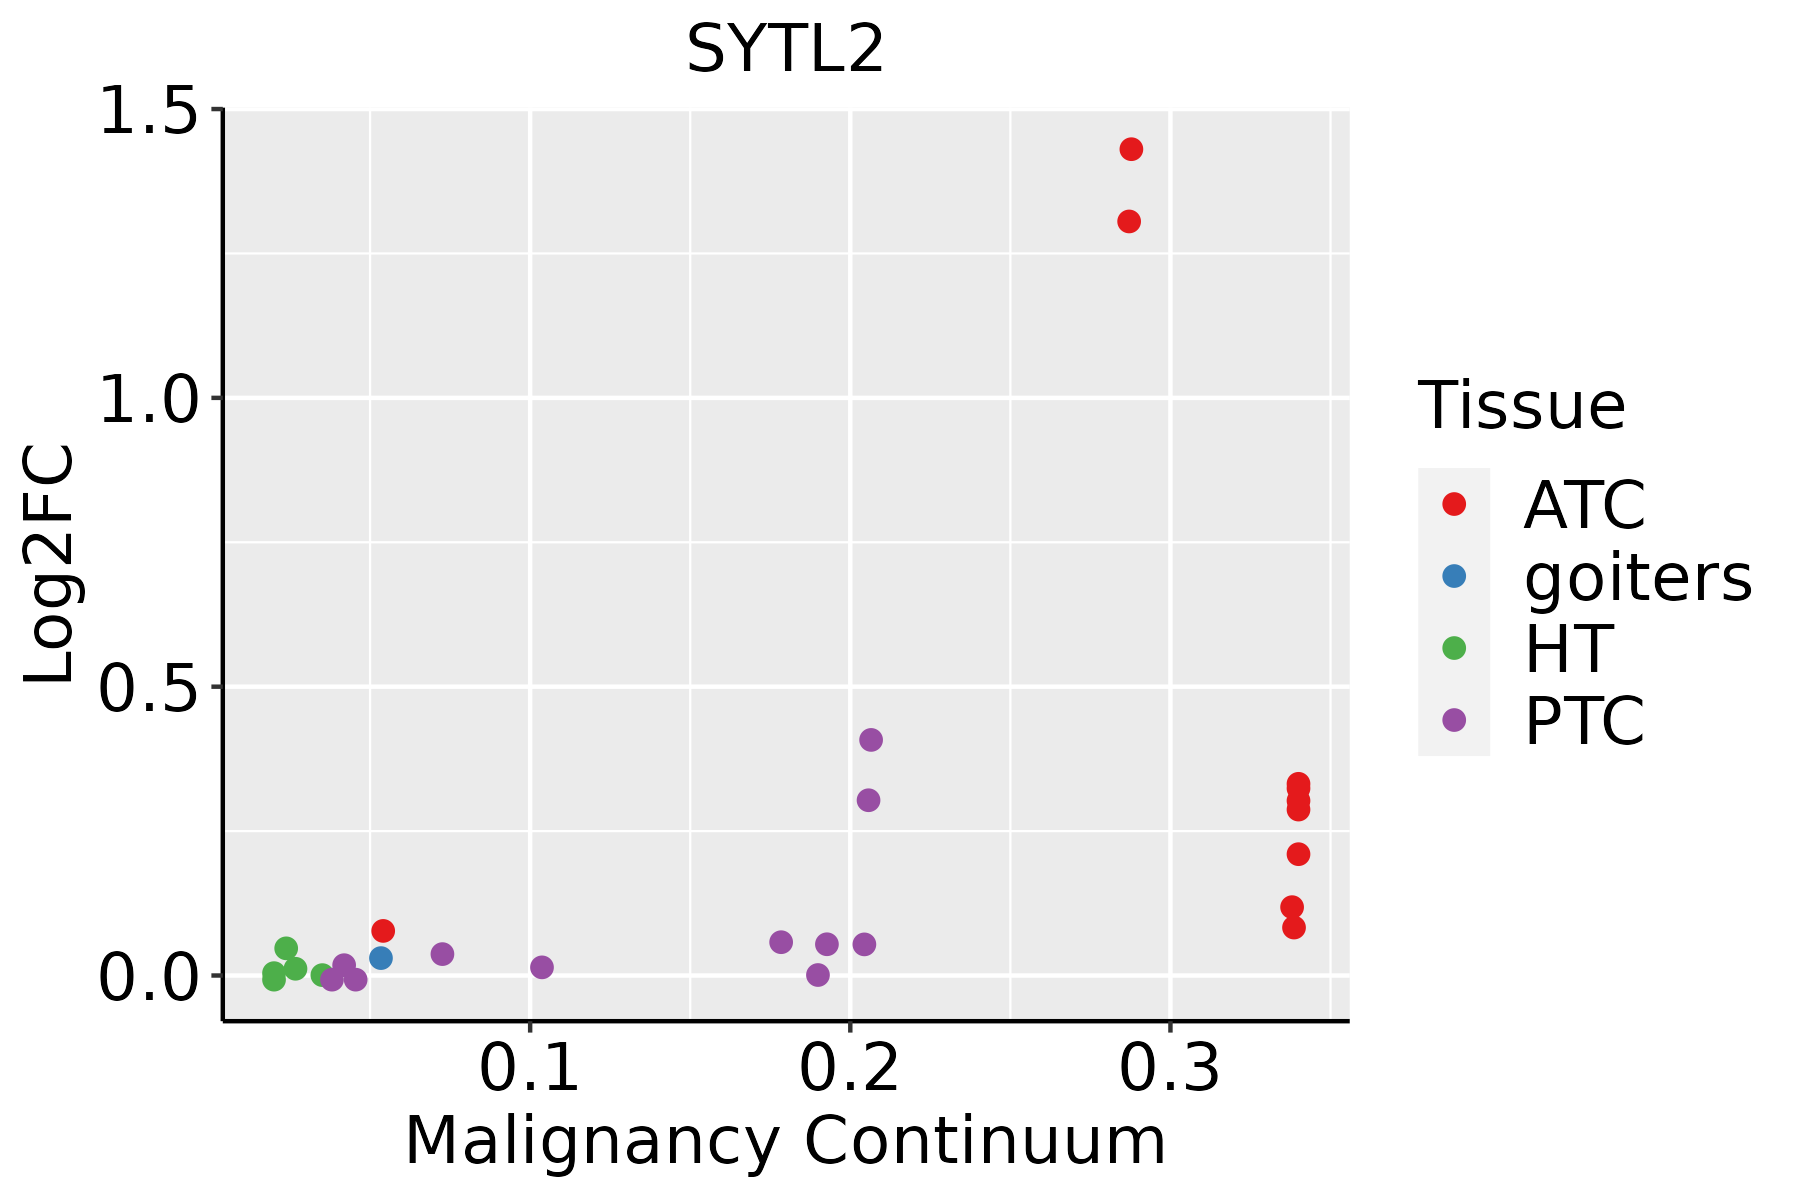 | ATC: Anaplastic thyroid cancer |
| HT: Hashimoto's thyroiditis | ||
| PTC: Papillary thyroid cancer |
| ∗log2FC in expression of this searched gene in stem-like cells from each diseased tissue sample relative to stem-like cells in normal samples in each tissue plotted against the malignancy continuum. Samples are colored based on if they are from different disease stage. |
Top |
Malignant transformation related pathway analysis |
| Find out the enriched GO biological processes and KEGG pathways involved in transition from healthy to precancer to cancer |
| Tissue | Disease Stage | Enriched GO biological Processes |
| Colorectum | AD |  |
| Colorectum | SER |  |
| Colorectum | MSS |  |
| Colorectum | MSI-H |  |
| Colorectum | FAP |  |
| ∗Top 15 enriched GO BP terms are showed in the bar plot of each disease state in each tissue. Each row represents a significant GO biological process which is colored according to the -log10(p.adjust). |
| Page: 1 2 3 4 5 6 7 8 9 |
| GO ID | Tissue | Disease Stage | Description | Gene Ratio | Bg Ratio | pvalue | p.adjust | Count |
| GO:0022406 | Colorectum | AD | membrane docking | 31/3918 | 86/18723 | 8.67e-04 | 8.45e-03 | 31 |
| GO:0140056 | Colorectum | AD | organelle localization by membrane tethering | 28/3918 | 77/18723 | 1.29e-03 | 1.14e-02 | 28 |
| GO:0006887 | Colorectum | AD | exocytosis | 96/3918 | 352/18723 | 2.48e-03 | 1.90e-02 | 96 |
| GO:00224061 | Colorectum | SER | membrane docking | 25/2897 | 86/18723 | 9.88e-04 | 1.17e-02 | 25 |
| GO:00068871 | Colorectum | SER | exocytosis | 75/2897 | 352/18723 | 2.05e-03 | 2.03e-02 | 75 |
| GO:01400561 | Colorectum | SER | organelle localization by membrane tethering | 22/2897 | 77/18723 | 2.46e-03 | 2.32e-02 | 22 |
| GO:00224062 | Colorectum | MSS | membrane docking | 28/3467 | 86/18723 | 1.27e-03 | 1.21e-02 | 28 |
| GO:01400562 | Colorectum | MSS | organelle localization by membrane tethering | 25/3467 | 77/18723 | 2.34e-03 | 1.91e-02 | 25 |
| GO:00224063 | Colorectum | FAP | membrane docking | 22/2622 | 86/18723 | 3.11e-03 | 2.33e-02 | 22 |
| GO:01400563 | Colorectum | FAP | organelle localization by membrane tethering | 19/2622 | 77/18723 | 8.67e-03 | 4.98e-02 | 19 |
| GO:00224064 | Colorectum | CRC | membrane docking | 20/2078 | 86/18723 | 9.78e-04 | 1.17e-02 | 20 |
| GO:01400564 | Colorectum | CRC | organelle localization by membrane tethering | 17/2078 | 77/18723 | 4.05e-03 | 3.35e-02 | 17 |
| GO:00068872 | Colorectum | CRC | exocytosis | 55/2078 | 352/18723 | 5.62e-03 | 4.24e-02 | 55 |
| GO:00224069 | Esophagus | ESCC | membrane docking | 62/8552 | 86/18723 | 5.93e-07 | 7.79e-06 | 62 |
| GO:01400567 | Esophagus | ESCC | organelle localization by membrane tethering | 53/8552 | 77/18723 | 3.33e-05 | 2.74e-04 | 53 |
| GO:00482781 | Esophagus | ESCC | vesicle docking | 38/8552 | 59/18723 | 2.86e-03 | 1.21e-02 | 38 |
| GO:00224066 | Lung | IAC | membrane docking | 18/2061 | 86/18723 | 5.26e-03 | 3.99e-02 | 18 |
| GO:00224067 | Prostate | BPH | membrane docking | 23/3107 | 86/18723 | 1.15e-02 | 4.68e-02 | 23 |
| GO:002240612 | Prostate | Tumor | membrane docking | 26/3246 | 86/18723 | 2.29e-03 | 1.29e-02 | 26 |
| GO:002240615 | Thyroid | PTC | membrane docking | 48/5968 | 86/18723 | 3.72e-06 | 4.73e-05 | 48 |
| Page: 1 2 |
| Pathway ID | Tissue | Disease Stage | Description | Gene Ratio | Bg Ratio | pvalue | p.adjust | qvalue | Count |
| Page: 1 |
Top |
Cell-cell communication analysis |
| Identification of potential cell-cell interactions between two cell types and their ligand-receptor pairs for different disease states |
| Ligand | Receptor | LRpair | Pathway | Tissue | Disease Stage |
| Page: 1 |
Top |
Single-cell gene regulatory network inference analysis |
| Find out the significant the regulons (TFs) and the target genes of each regulon across cell types for different disease states |
| TF | Cell Type | Tissue | Disease Stage | Target Gene | RSS | Regulon Activity |
| ∗The dot plots of a searched regulon are shown for all cell subpopulations in each disease state of each tissue based on the regulon specific score inferred using pySCENIC and by calculating the average expression. |
| Page: 1 |
Top |
Somatic mutation of malignant transformation related genes |
| Annotation of somatic variants for genes involved in malignant transformation |
| Hugo Symbol | Variant Class | Variant Classification | dbSNP RS | HGVSc | HGVSp | HGVSp Short | SWISSPROT | BIOTYPE | SIFT | PolyPhen | Tumor Sample Barcode | Tissue | Histology | Sex | Age | Stage | Therapy Types | Drugs | Outcome |
| SYTL2 | SNV | Missense_Mutation | rs761827215 | c.1216G>A | p.Glu406Lys | p.E406K | Q9HCH5 | protein_coding | tolerated(0.17) | benign(0.42) | TCGA-A8-A07R-01 | Breast | breast invasive carcinoma | Female | >=65 | III/IV | Ancillary | zoledronic | SD |
| SYTL2 | SNV | Missense_Mutation | novel | c.693N>G | p.Ile231Met | p.I231M | Q9HCH5 | protein_coding | tolerated(0.05) | benign(0.042) | TCGA-AC-A6IW-01 | Breast | breast invasive carcinoma | Female | >=65 | I/II | Unknown | Unknown | SD |
| SYTL2 | SNV | Missense_Mutation | rs372798070 | c.2095N>A | p.Glu699Lys | p.E699K | Q9HCH5 | protein_coding | deleterious(0) | probably_damaging(0.988) | TCGA-AN-A046-01 | Breast | breast invasive carcinoma | Female | >=65 | I/II | Unknown | Unknown | SD |
| SYTL2 | SNV | Missense_Mutation | rs183225195 | c.721N>G | p.Met241Val | p.M241V | Q9HCH5 | protein_coding | tolerated(0.23) | benign(0.007) | TCGA-AN-A0AK-01 | Breast | breast invasive carcinoma | Female | >=65 | I/II | Unknown | Unknown | SD |
| SYTL2 | SNV | Missense_Mutation | novel | c.1483N>G | p.Pro495Ala | p.P495A | Q9HCH5 | protein_coding | deleterious(0.04) | benign(0.045) | TCGA-AN-A0FT-01 | Breast | breast invasive carcinoma | Female | <65 | I/II | Unknown | Unknown | SD |
| SYTL2 | SNV | Missense_Mutation | c.1021N>A | p.Glu341Lys | p.E341K | Q9HCH5 | protein_coding | tolerated(0.21) | benign(0.014) | TCGA-EW-A1J5-01 | Breast | breast invasive carcinoma | Female | <65 | I/II | Chemotherapy | adriamycin | SD | |
| SYTL2 | insertion | Frame_Shift_Ins | novel | c.984_985insTACTGCTTTTCCCTGCTAACTAGCCTTGTCTTGAAGGTCTTAC | p.Pro329TyrfsTer27 | p.P329Yfs*27 | Q9HCH5 | protein_coding | TCGA-A8-A08H-01 | Breast | breast invasive carcinoma | Female | >=65 | I/II | Unknown | Unknown | SD | ||
| SYTL2 | insertion | Nonsense_Mutation | novel | c.719_720insCCCCGTCTCTACTAAAAATACAAAAAATTAGCCGGGCGC | p.Lys240delinsAsnProValSerThrLysAsnThrLysAsnTerProGlyAla | p.K240delinsNPVSTKNTKN*PGA | Q9HCH5 | protein_coding | TCGA-AN-A0AK-01 | Breast | breast invasive carcinoma | Female | >=65 | I/II | Unknown | Unknown | SD | ||
| SYTL2 | insertion | Nonsense_Mutation | novel | c.900_901insTGTTCTTAGGCTTTAAAAGCCCTGAAGGCACTTTCTCCTTCA | p.Ile300_Val301insCysSerTerAlaLeuLysAlaLeuLysAlaLeuSerProSer | p.I300_V301insCS*ALKALKALSPS | Q9HCH5 | protein_coding | TCGA-AO-A03P-01 | Breast | breast invasive carcinoma | Female | <65 | I/II | Hormone Therapy | letrozole | PD | ||
| SYTL2 | insertion | Frame_Shift_Ins | novel | c.1132_1133insCTGTTCATATCCTTCACCCACTTTTTAATGGGGTTGTT | p.Phe378SerfsTer47 | p.F378Sfs*47 | Q9HCH5 | protein_coding | TCGA-BH-A0HX-01 | Breast | breast invasive carcinoma | Female | <65 | I/II | Chemotherapy | adrimycin | SD |
| Page: 1 2 3 4 5 6 7 8 9 10 11 12 |
Top |
Related drugs of malignant transformation related genes |
| Identification of chemicals and drugs interact with genes involved in malignant transfromation |
| (DGIdb 4.0) |
| Entrez ID | Symbol | Category | Interaction Types | Drug Claim Name | Drug Name | PMIDs |
| Page: 1 |

Copyright 2023-Present -The University of Texas Health Science Center at Houston |