
|
|||||
|
 | |
| |
| |
| |
| |
| |
|
Gene: SYTL1 |
Gene summary for SYTL1 |
| Gene information | Species | Human | Gene symbol | SYTL1 | Gene ID | 84958 |
| Gene name | synaptotagmin like 1 | |
| Gene Alias | JFC1 | |
| Cytomap | 1p36.11 | |
| Gene Type | protein-coding | GO ID | GO:0006810 | UniProtAcc | Q8IYJ3 |
Top |
Malignant transformation analysis |
| Identification of the aberrant gene expression in precancerous and cancerous lesions by comparing the gene expression of stem-like cells in diseased tissues with normal stem cells |
| Entrez ID | Symbol | Replicates | Species | Organ | Tissue | Adj P-value | Log2FC | Malignancy |
| 84958 | SYTL1 | LZE4T | Human | Esophagus | ESCC | 3.66e-07 | 7.94e-02 | 0.0811 |
| 84958 | SYTL1 | LZE8T | Human | Esophagus | ESCC | 6.62e-12 | 4.61e-02 | 0.067 |
| 84958 | SYTL1 | LZE20T | Human | Esophagus | ESCC | 4.76e-15 | 7.72e-01 | 0.0662 |
| 84958 | SYTL1 | LZE22D1 | Human | Esophagus | HGIN | 3.03e-08 | 5.76e-01 | 0.0595 |
| 84958 | SYTL1 | LZE22T | Human | Esophagus | ESCC | 6.57e-05 | 3.73e-01 | 0.068 |
| 84958 | SYTL1 | LZE21T | Human | Esophagus | ESCC | 4.99e-09 | 3.02e-01 | 0.0655 |
| 84958 | SYTL1 | LZE6T | Human | Esophagus | ESCC | 4.02e-03 | -1.29e-01 | 0.0845 |
| 84958 | SYTL1 | P1T-E | Human | Esophagus | ESCC | 2.80e-12 | 9.77e-01 | 0.0875 |
| 84958 | SYTL1 | P2T-E | Human | Esophagus | ESCC | 1.22e-16 | 4.41e-01 | 0.1177 |
| 84958 | SYTL1 | P4T-E | Human | Esophagus | ESCC | 1.48e-17 | 4.32e-01 | 0.1323 |
| 84958 | SYTL1 | P5T-E | Human | Esophagus | ESCC | 3.28e-10 | 2.64e-01 | 0.1327 |
| 84958 | SYTL1 | P8T-E | Human | Esophagus | ESCC | 1.21e-25 | 7.09e-01 | 0.0889 |
| 84958 | SYTL1 | P9T-E | Human | Esophagus | ESCC | 2.40e-08 | 2.56e-01 | 0.1131 |
| 84958 | SYTL1 | P10T-E | Human | Esophagus | ESCC | 8.21e-43 | 1.01e+00 | 0.116 |
| 84958 | SYTL1 | P12T-E | Human | Esophagus | ESCC | 2.37e-09 | 4.90e-01 | 0.1122 |
| 84958 | SYTL1 | P15T-E | Human | Esophagus | ESCC | 7.77e-32 | 7.83e-01 | 0.1149 |
| 84958 | SYTL1 | P16T-E | Human | Esophagus | ESCC | 2.32e-13 | 1.67e-02 | 0.1153 |
| 84958 | SYTL1 | P17T-E | Human | Esophagus | ESCC | 1.08e-07 | 4.02e-01 | 0.1278 |
| 84958 | SYTL1 | P20T-E | Human | Esophagus | ESCC | 3.44e-47 | 1.31e+00 | 0.1124 |
| 84958 | SYTL1 | P21T-E | Human | Esophagus | ESCC | 2.83e-23 | 5.12e-01 | 0.1617 |
| Page: 1 2 3 4 5 6 |
| Tissue | Expression Dynamics | Abbreviation |
| Esophagus | 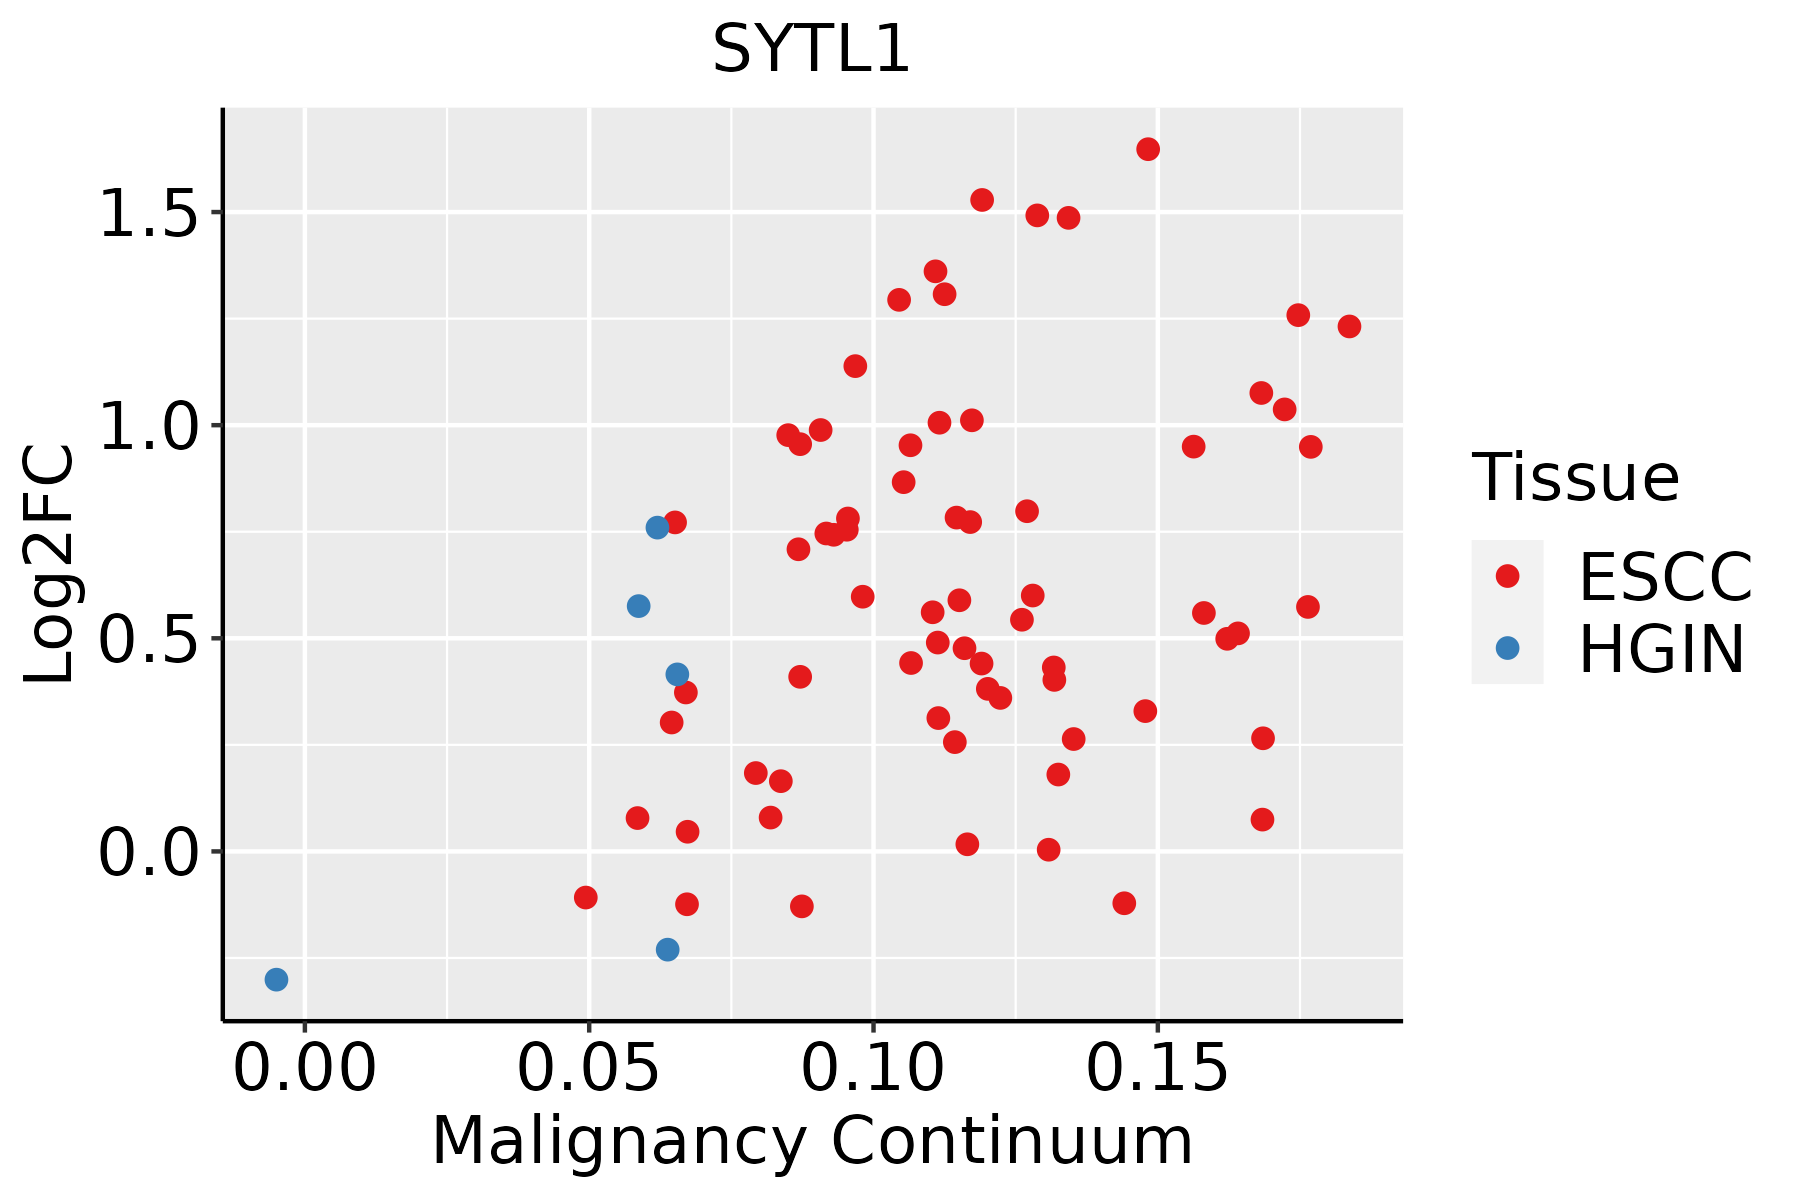 | ESCC: Esophageal squamous cell carcinoma |
| HGIN: High-grade intraepithelial neoplasias | ||
| LGIN: Low-grade intraepithelial neoplasias | ||
| Oral Cavity | 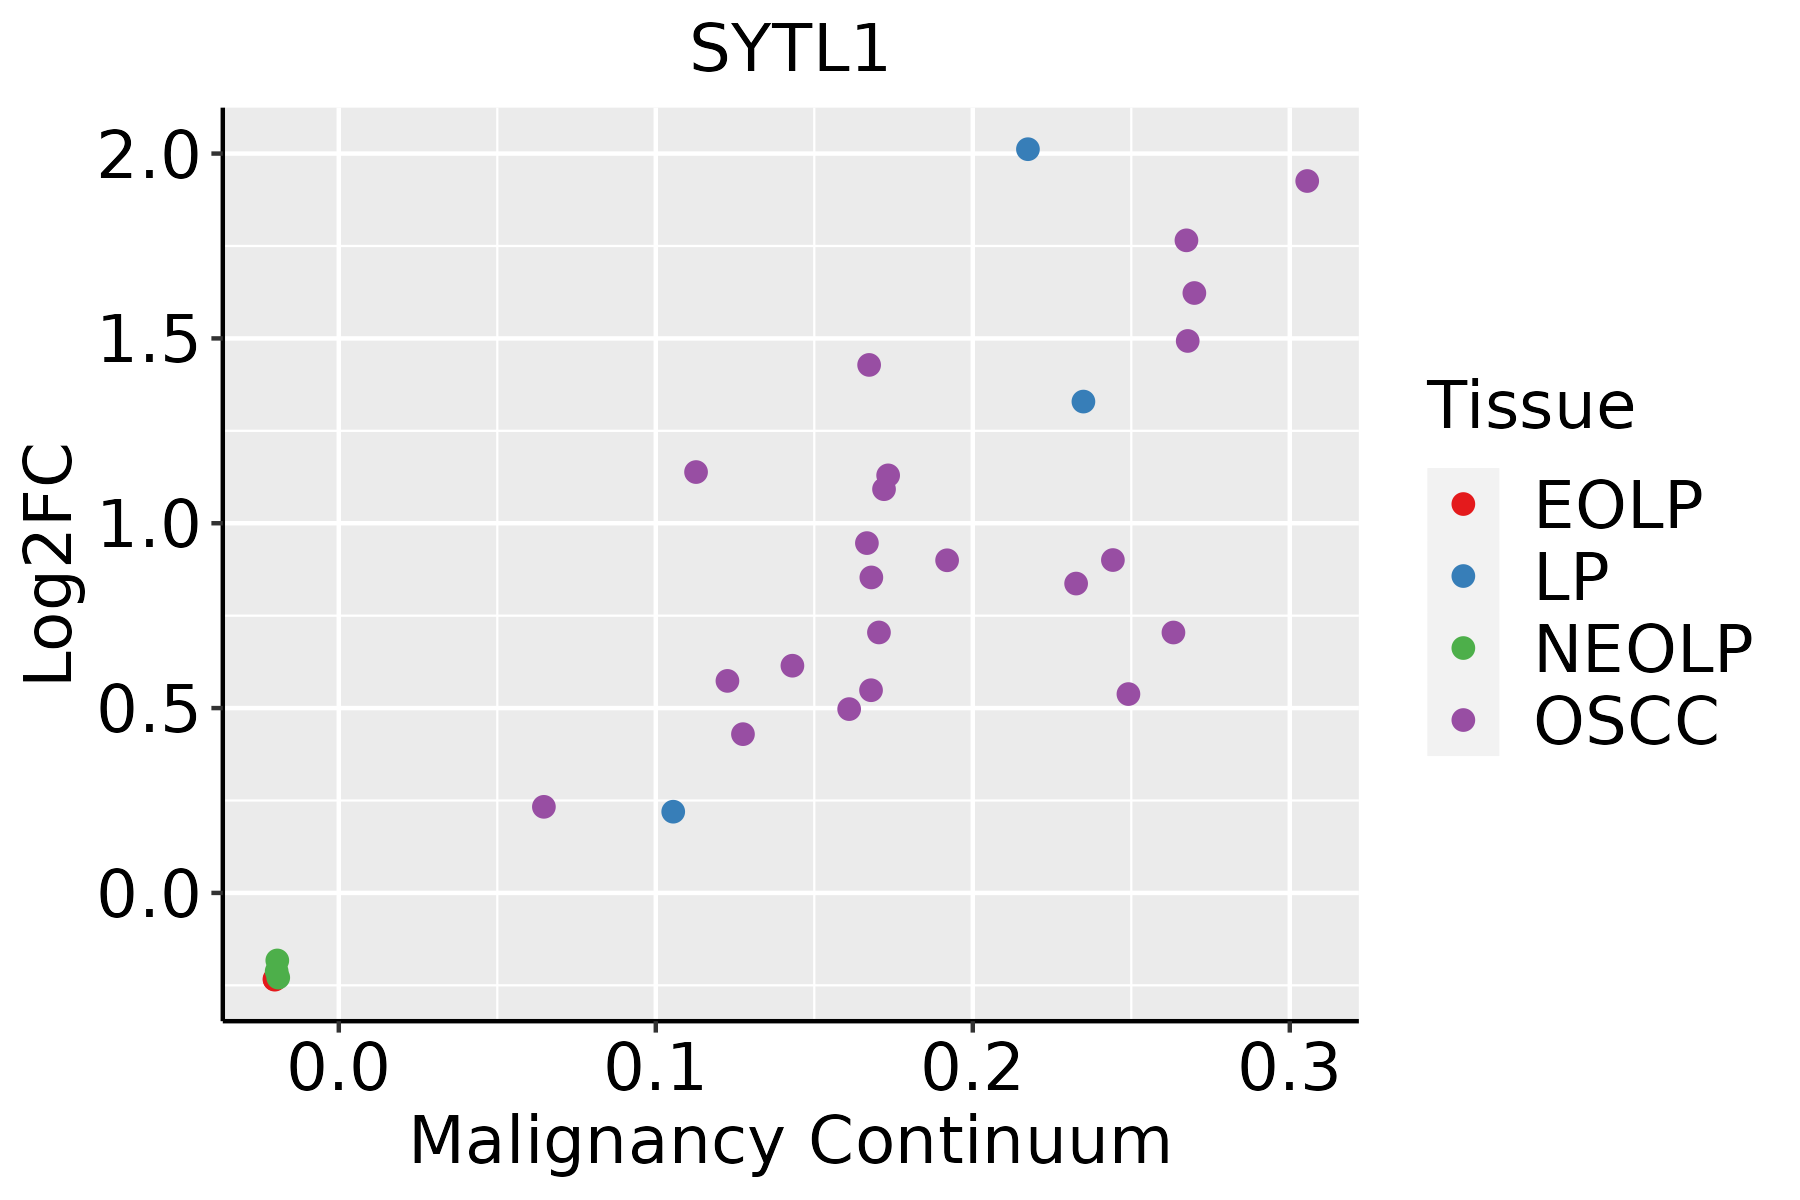 | EOLP: Erosive Oral lichen planus |
| LP: leukoplakia | ||
| NEOLP: Non-erosive oral lichen planus | ||
| OSCC: Oral squamous cell carcinoma | ||
| Prostate | 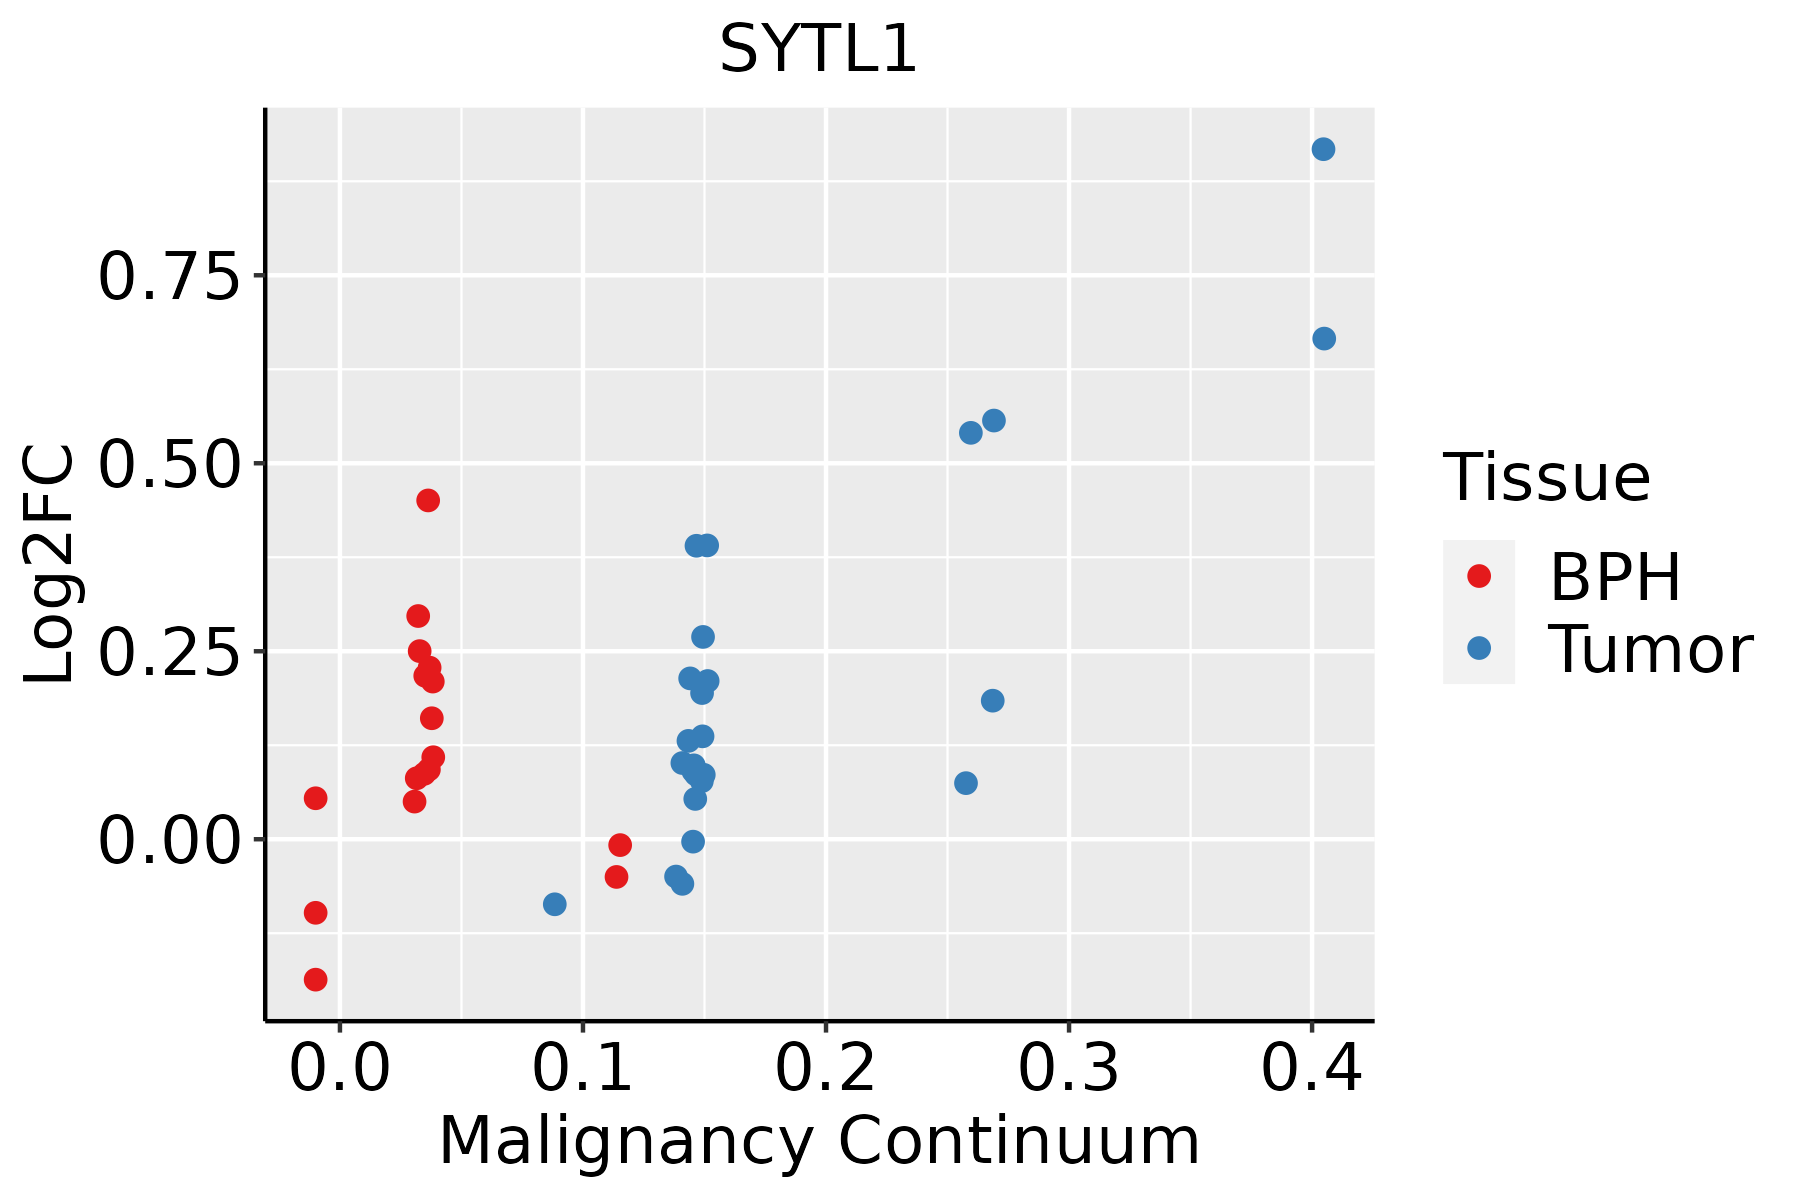 | BPH: Benign Prostatic Hyperplasia |
| Skin | 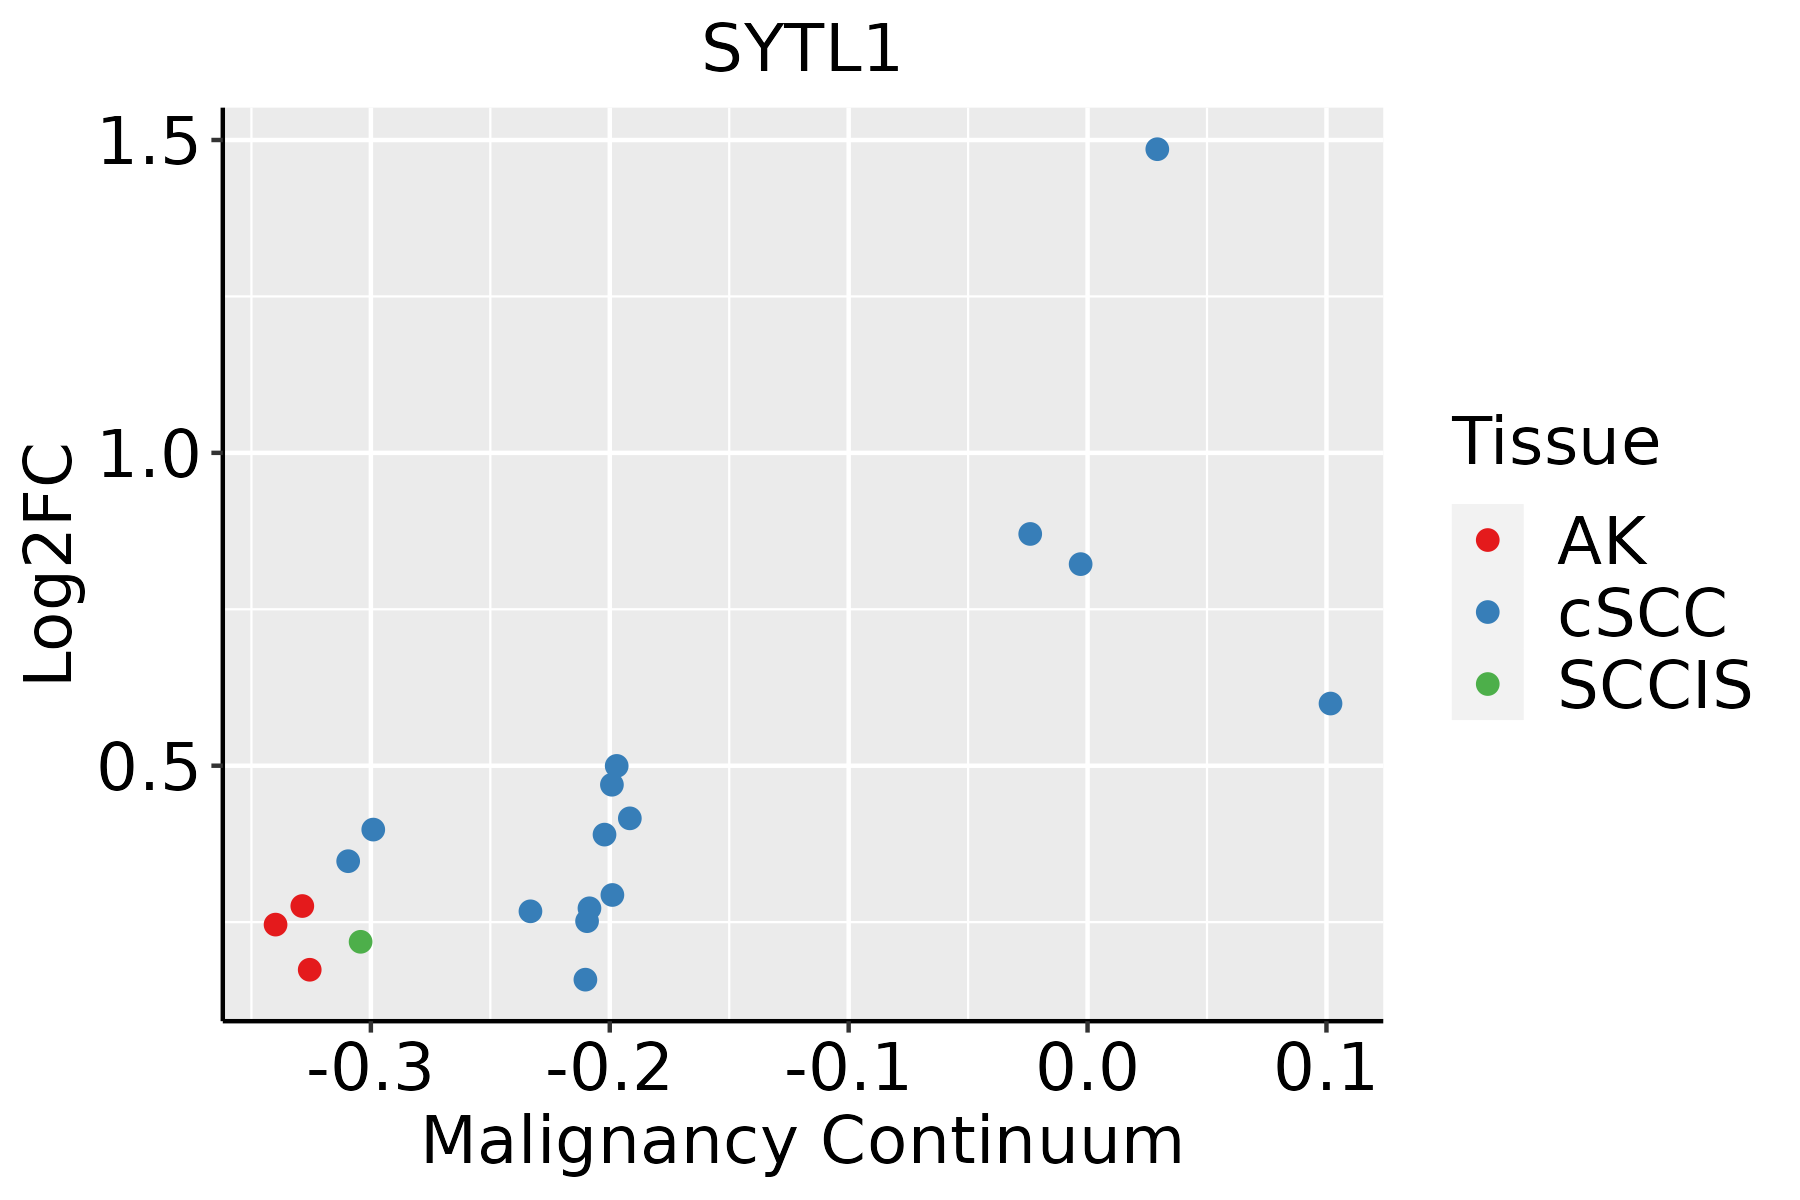 | AK: Actinic keratosis |
| cSCC: Cutaneous squamous cell carcinoma | ||
| SCCIS:squamous cell carcinoma in situ | ||
| Thyroid | 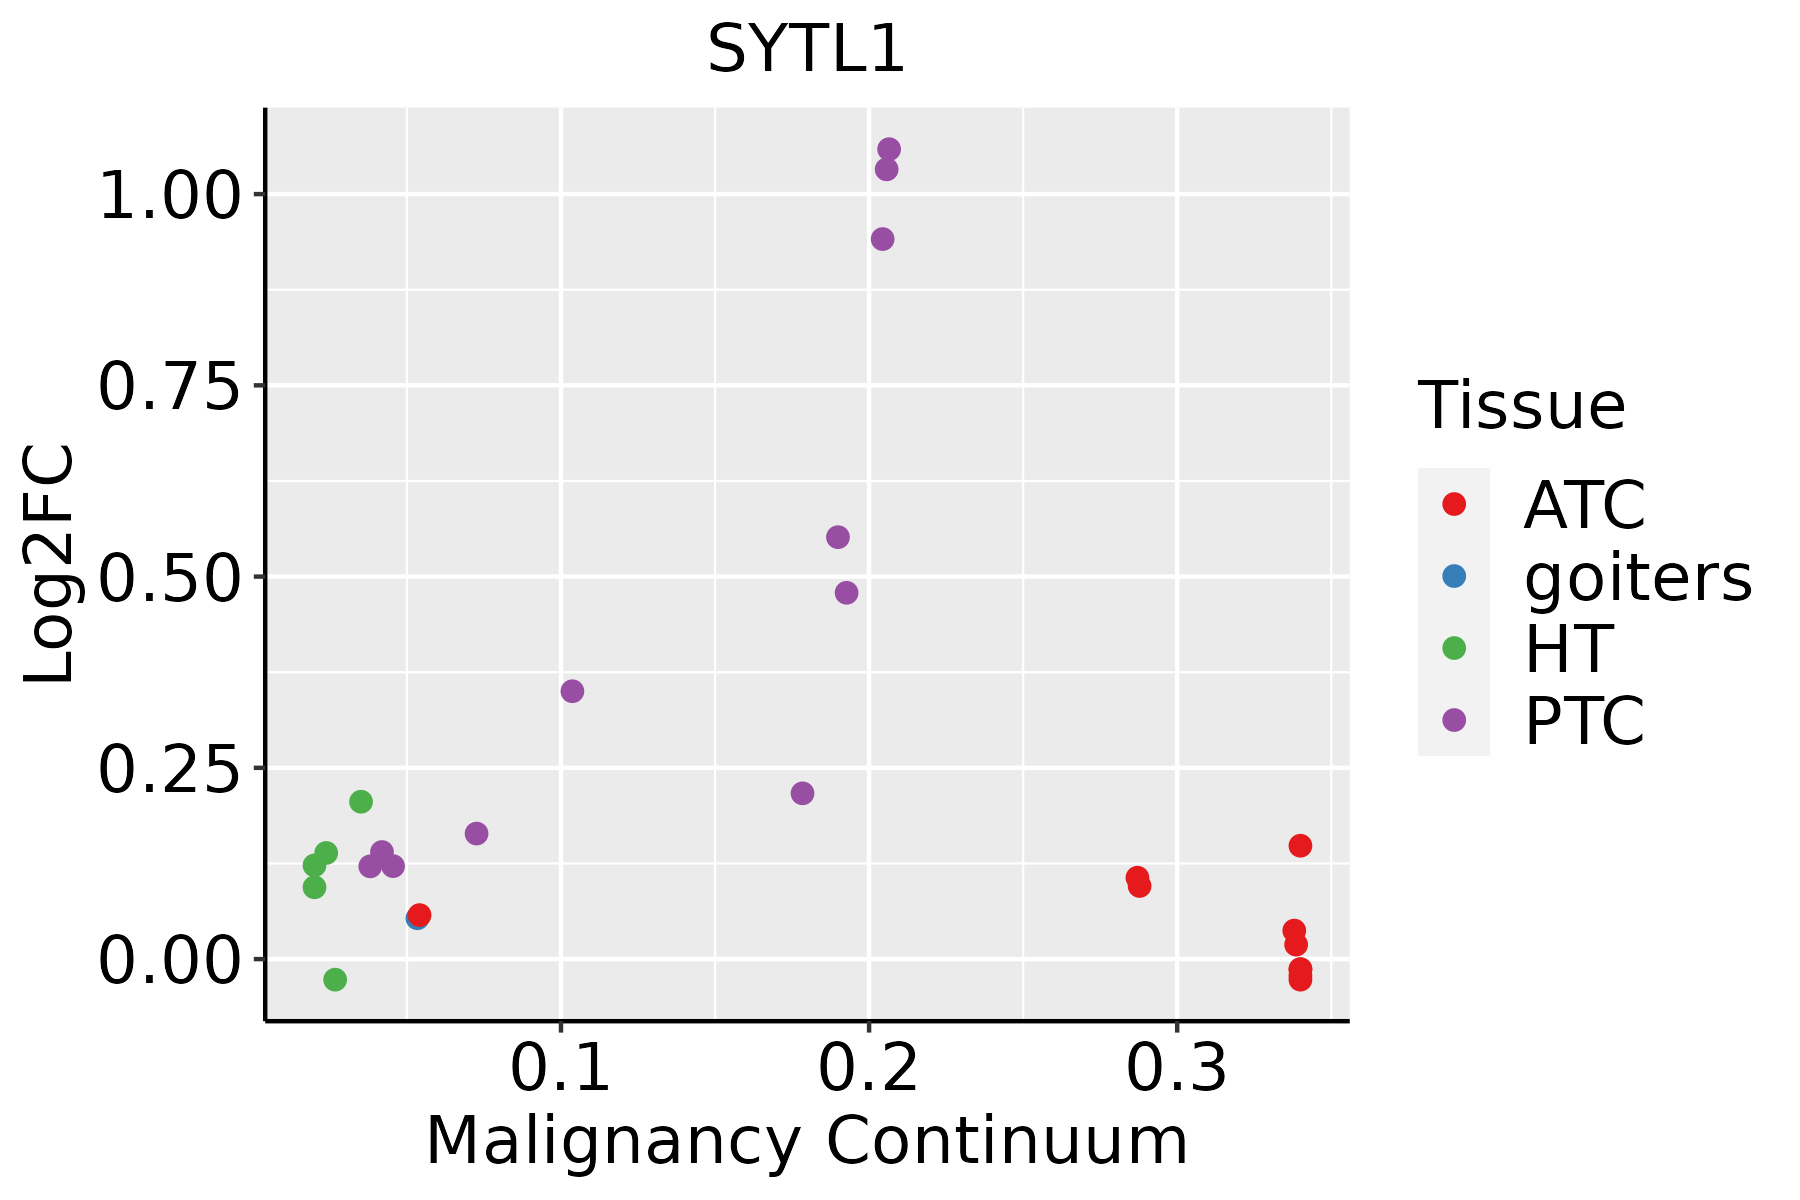 | ATC: Anaplastic thyroid cancer |
| HT: Hashimoto's thyroiditis | ||
| PTC: Papillary thyroid cancer |
| ∗log2FC in expression of this searched gene in stem-like cells from each diseased tissue sample relative to stem-like cells in normal samples in each tissue plotted against the malignancy continuum. Samples are colored based on if they are from different disease stage. |
Top |
Malignant transformation related pathway analysis |
| Find out the enriched GO biological processes and KEGG pathways involved in transition from healthy to precancer to cancer |
| Tissue | Disease Stage | Enriched GO biological Processes |
| Colorectum | AD |  |
| Colorectum | SER |  |
| Colorectum | MSS |  |
| Colorectum | MSI-H |  |
| Colorectum | FAP |  |
| ∗Top 15 enriched GO BP terms are showed in the bar plot of each disease state in each tissue. Each row represents a significant GO biological process which is colored according to the -log10(p.adjust). |
| Page: 1 2 3 4 5 6 7 8 9 |
| GO ID | Tissue | Disease Stage | Description | Gene Ratio | Bg Ratio | pvalue | p.adjust | Count |
| GO:00068874 | Oral cavity | EOLP | exocytosis | 60/2218 | 352/18723 | 2.32e-03 | 1.43e-02 | 60 |
| Page: 1 |
| Pathway ID | Tissue | Disease Stage | Description | Gene Ratio | Bg Ratio | pvalue | p.adjust | qvalue | Count |
| Page: 1 |
Top |
Cell-cell communication analysis |
| Identification of potential cell-cell interactions between two cell types and their ligand-receptor pairs for different disease states |
| Ligand | Receptor | LRpair | Pathway | Tissue | Disease Stage |
| Page: 1 |
Top |
Single-cell gene regulatory network inference analysis |
| Find out the significant the regulons (TFs) and the target genes of each regulon across cell types for different disease states |
| TF | Cell Type | Tissue | Disease Stage | Target Gene | RSS | Regulon Activity |
| ∗The dot plots of a searched regulon are shown for all cell subpopulations in each disease state of each tissue based on the regulon specific score inferred using pySCENIC and by calculating the average expression. |
| Page: 1 |
Top |
Somatic mutation of malignant transformation related genes |
| Annotation of somatic variants for genes involved in malignant transformation |
| Hugo Symbol | Variant Class | Variant Classification | dbSNP RS | HGVSc | HGVSp | HGVSp Short | SWISSPROT | BIOTYPE | SIFT | PolyPhen | Tumor Sample Barcode | Tissue | Histology | Sex | Age | Stage | Therapy Types | Drugs | Outcome |
| SYTL1 | SNV | Missense_Mutation | c.252C>G | p.Phe84Leu | p.F84L | Q8IYJ3 | protein_coding | deleterious(0) | probably_damaging(0.958) | TCGA-AC-A23H-01 | Breast | breast invasive carcinoma | Female | >=65 | I/II | Unknown | Unknown | PD | |
| SYTL1 | insertion | Frame_Shift_Ins | novel | c.457_458insCCATAGCAGGAAAAATACA | p.Glu153AlafsTer10 | p.E153Afs*10 | Q8IYJ3 | protein_coding | TCGA-AN-A0XT-01 | Breast | breast invasive carcinoma | Female | <65 | III/IV | Unknown | Unknown | SD | ||
| SYTL1 | SNV | Missense_Mutation | novel | c.1400G>A | p.Arg467His | p.R467H | Q8IYJ3 | protein_coding | tolerated(0.32) | benign(0.226) | TCGA-2W-A8YY-01 | Cervix | cervical & endocervical cancer | Female | <65 | I/II | Chemotherapy | cisplatin | CR |
| SYTL1 | SNV | Missense_Mutation | novel | c.388G>C | p.Glu130Gln | p.E130Q | Q8IYJ3 | protein_coding | tolerated(0.18) | benign(0.134) | TCGA-DS-A1OB-01 | Cervix | cervical & endocervical cancer | Female | <65 | I/II | Chemotherapy | carboplatin | PD |
| SYTL1 | SNV | Missense_Mutation | novel | c.722N>T | p.Ser241Leu | p.S241L | Q8IYJ3 | protein_coding | deleterious(0) | probably_damaging(0.922) | TCGA-VS-A952-01 | Cervix | cervical & endocervical cancer | Female | >=65 | I/II | Unknown | Unknown | SD |
| SYTL1 | SNV | Missense_Mutation | rs376143341 | c.949N>T | p.Arg317Cys | p.R317C | Q8IYJ3 | protein_coding | deleterious(0) | probably_damaging(1) | TCGA-AA-3672-01 | Colorectum | colon adenocarcinoma | Female | >=65 | III/IV | Unknown | Unknown | SD |
| SYTL1 | SNV | Missense_Mutation | rs148530866 | c.1348N>A | p.Val450Met | p.V450M | Q8IYJ3 | protein_coding | deleterious(0) | probably_damaging(0.96) | TCGA-AA-3821-01 | Colorectum | colon adenocarcinoma | Female | >=65 | I/II | Unknown | Unknown | SD |
| SYTL1 | SNV | Missense_Mutation | c.1136A>C | p.Glu379Ala | p.E379A | Q8IYJ3 | protein_coding | tolerated(0.1) | benign(0.039) | TCGA-AA-3864-01 | Colorectum | colon adenocarcinoma | Male | >=65 | I/II | Unknown | Unknown | SD | |
| SYTL1 | SNV | Missense_Mutation | rs774540763 | c.1462N>T | p.Arg488Cys | p.R488C | Q8IYJ3 | protein_coding | tolerated(0.06) | benign(0.035) | TCGA-AA-3984-01 | Colorectum | colon adenocarcinoma | Female | <65 | I/II | Unknown | Unknown | SD |
| SYTL1 | SNV | Missense_Mutation | c.958G>A | p.Ala320Thr | p.A320T | Q8IYJ3 | protein_coding | tolerated(0.35) | benign(0.026) | TCGA-CM-6168-01 | Colorectum | colon adenocarcinoma | Female | >=65 | I/II | Unknown | Unknown | SD |
| Page: 1 2 3 4 5 |
Top |
Related drugs of malignant transformation related genes |
| Identification of chemicals and drugs interact with genes involved in malignant transfromation |
| (DGIdb 4.0) |
| Entrez ID | Symbol | Category | Interaction Types | Drug Claim Name | Drug Name | PMIDs |
| Page: 1 |

Copyright 2023-Present -The University of Texas Health Science Center at Houston |