
|
|||||
|
 | |
| |
| |
| |
| |
| |
|
Gene: SYT8 |
Gene summary for SYT8 |
| Gene information | Species | Human | Gene symbol | SYT8 | Gene ID | 90019 |
| Gene name | synaptotagmin 8 | |
| Gene Alias | SYT8 | |
| Cytomap | 11p15.5 | |
| Gene Type | protein-coding | GO ID | GO:0001505 | UniProtAcc | Q8NBV8 |
Top |
Malignant transformation analysis |
| Identification of the aberrant gene expression in precancerous and cancerous lesions by comparing the gene expression of stem-like cells in diseased tissues with normal stem cells |
| Entrez ID | Symbol | Replicates | Species | Organ | Tissue | Adj P-value | Log2FC | Malignancy |
| 90019 | SYT8 | LZE8T | Human | Esophagus | ESCC | 1.66e-38 | 1.70e+00 | 0.067 |
| 90019 | SYT8 | LZE22D1 | Human | Esophagus | HGIN | 2.91e-02 | 1.58e-01 | 0.0595 |
| 90019 | SYT8 | P5T-E | Human | Esophagus | ESCC | 9.92e-07 | -1.63e-01 | 0.1327 |
| 90019 | SYT8 | P9T-E | Human | Esophagus | ESCC | 3.25e-02 | -1.44e-01 | 0.1131 |
| 90019 | SYT8 | P10T-E | Human | Esophagus | ESCC | 4.17e-06 | -7.49e-02 | 0.116 |
| 90019 | SYT8 | P12T-E | Human | Esophagus | ESCC | 9.14e-06 | -1.41e-01 | 0.1122 |
| 90019 | SYT8 | P16T-E | Human | Esophagus | ESCC | 9.86e-06 | -1.78e-01 | 0.1153 |
| 90019 | SYT8 | P20T-E | Human | Esophagus | ESCC | 8.37e-05 | -1.41e-01 | 0.1124 |
| 90019 | SYT8 | P22T-E | Human | Esophagus | ESCC | 9.49e-11 | 5.08e-02 | 0.1236 |
| 90019 | SYT8 | P26T-E | Human | Esophagus | ESCC | 7.96e-11 | -9.04e-02 | 0.1276 |
| 90019 | SYT8 | P27T-E | Human | Esophagus | ESCC | 4.14e-02 | -1.38e-01 | 0.1055 |
| 90019 | SYT8 | P28T-E | Human | Esophagus | ESCC | 1.30e-02 | -5.46e-02 | 0.1149 |
| 90019 | SYT8 | P30T-E | Human | Esophagus | ESCC | 5.72e-04 | -8.32e-02 | 0.137 |
| 90019 | SYT8 | P31T-E | Human | Esophagus | ESCC | 1.48e-09 | -1.61e-01 | 0.1251 |
| 90019 | SYT8 | P32T-E | Human | Esophagus | ESCC | 1.40e-04 | -1.98e-01 | 0.1666 |
| 90019 | SYT8 | P39T-E | Human | Esophagus | ESCC | 1.54e-05 | -1.73e-01 | 0.0894 |
| 90019 | SYT8 | P42T-E | Human | Esophagus | ESCC | 4.01e-05 | -1.11e-01 | 0.1175 |
| 90019 | SYT8 | P61T-E | Human | Esophagus | ESCC | 3.99e-08 | -5.21e-02 | 0.099 |
| 90019 | SYT8 | P62T-E | Human | Esophagus | ESCC | 3.39e-04 | -2.90e-02 | 0.1302 |
| 90019 | SYT8 | P65T-E | Human | Esophagus | ESCC | 1.26e-24 | 1.02e+00 | 0.0978 |
| Page: 1 2 3 |
| Tissue | Expression Dynamics | Abbreviation |
| Esophagus | 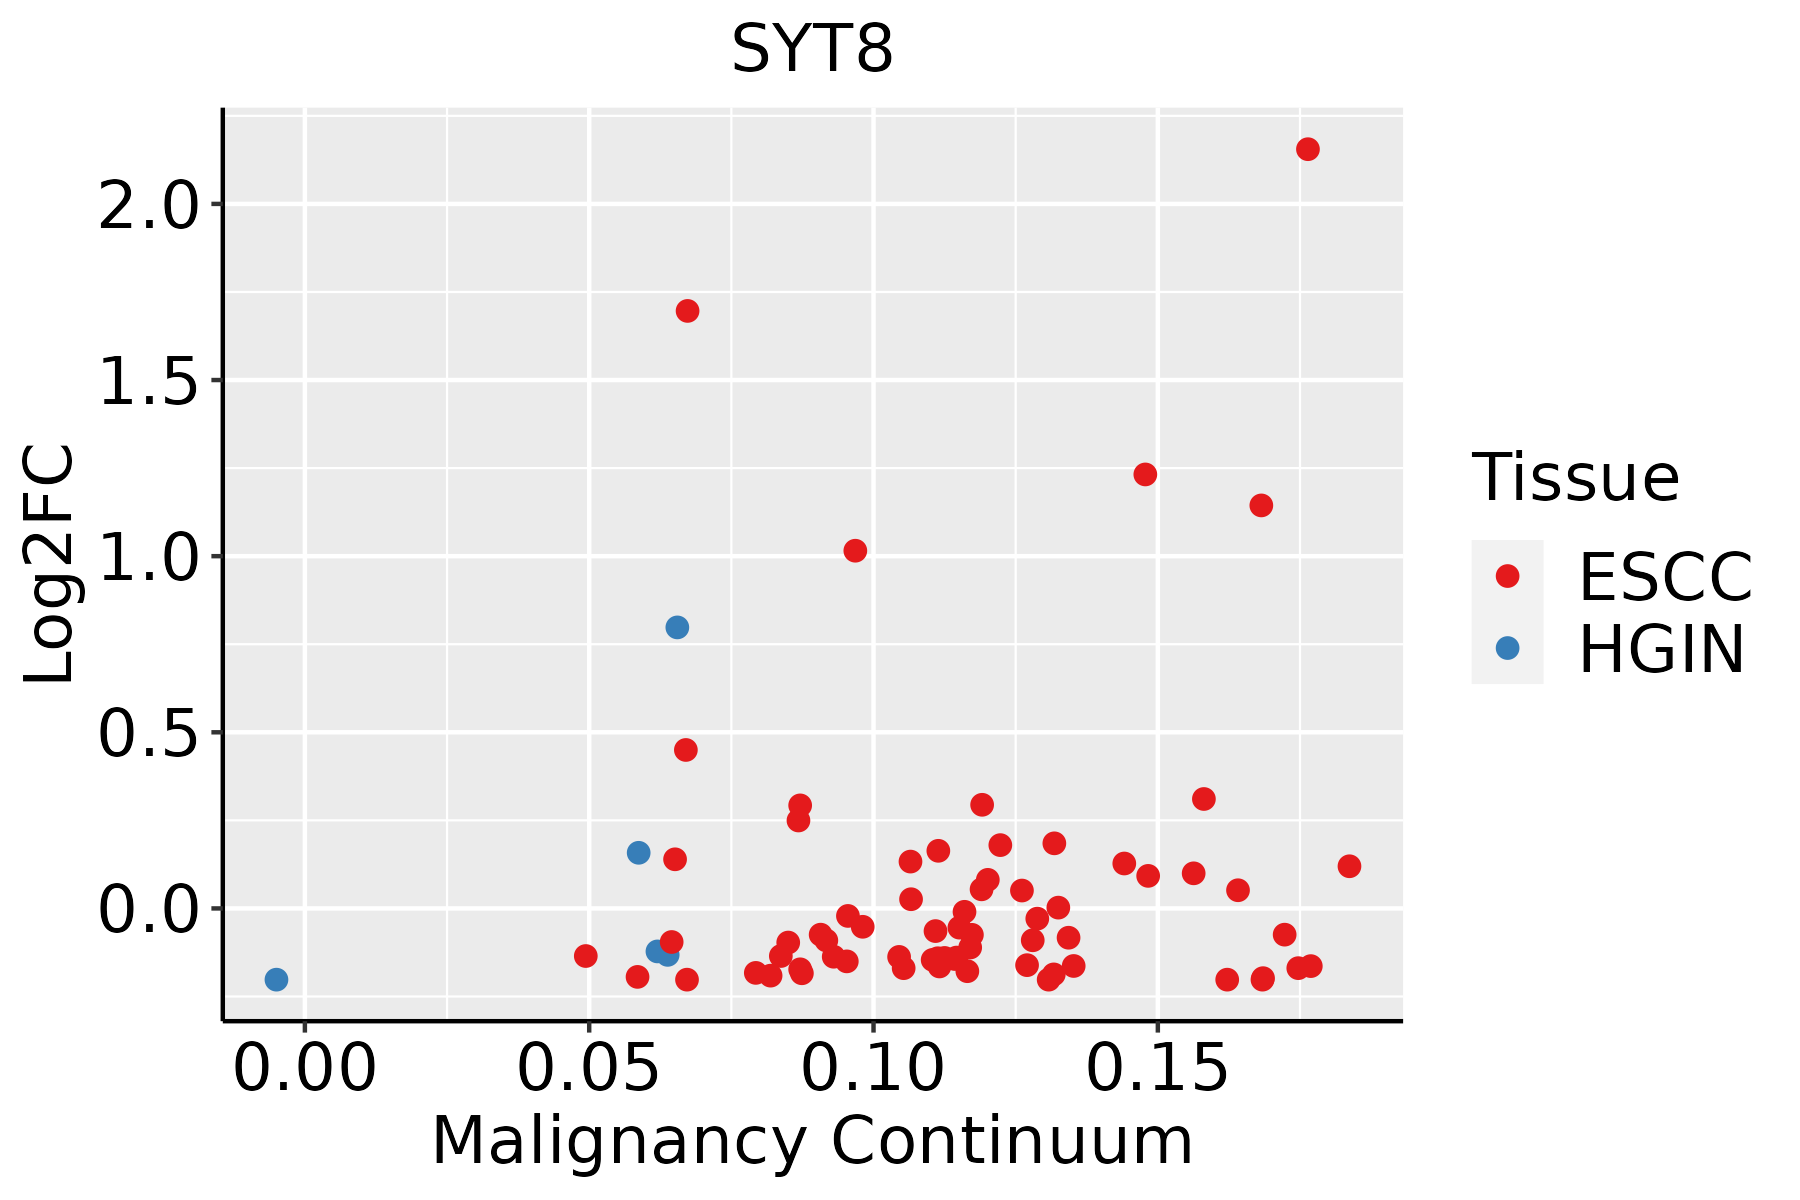 | ESCC: Esophageal squamous cell carcinoma |
| HGIN: High-grade intraepithelial neoplasias | ||
| LGIN: Low-grade intraepithelial neoplasias | ||
| Oral Cavity | 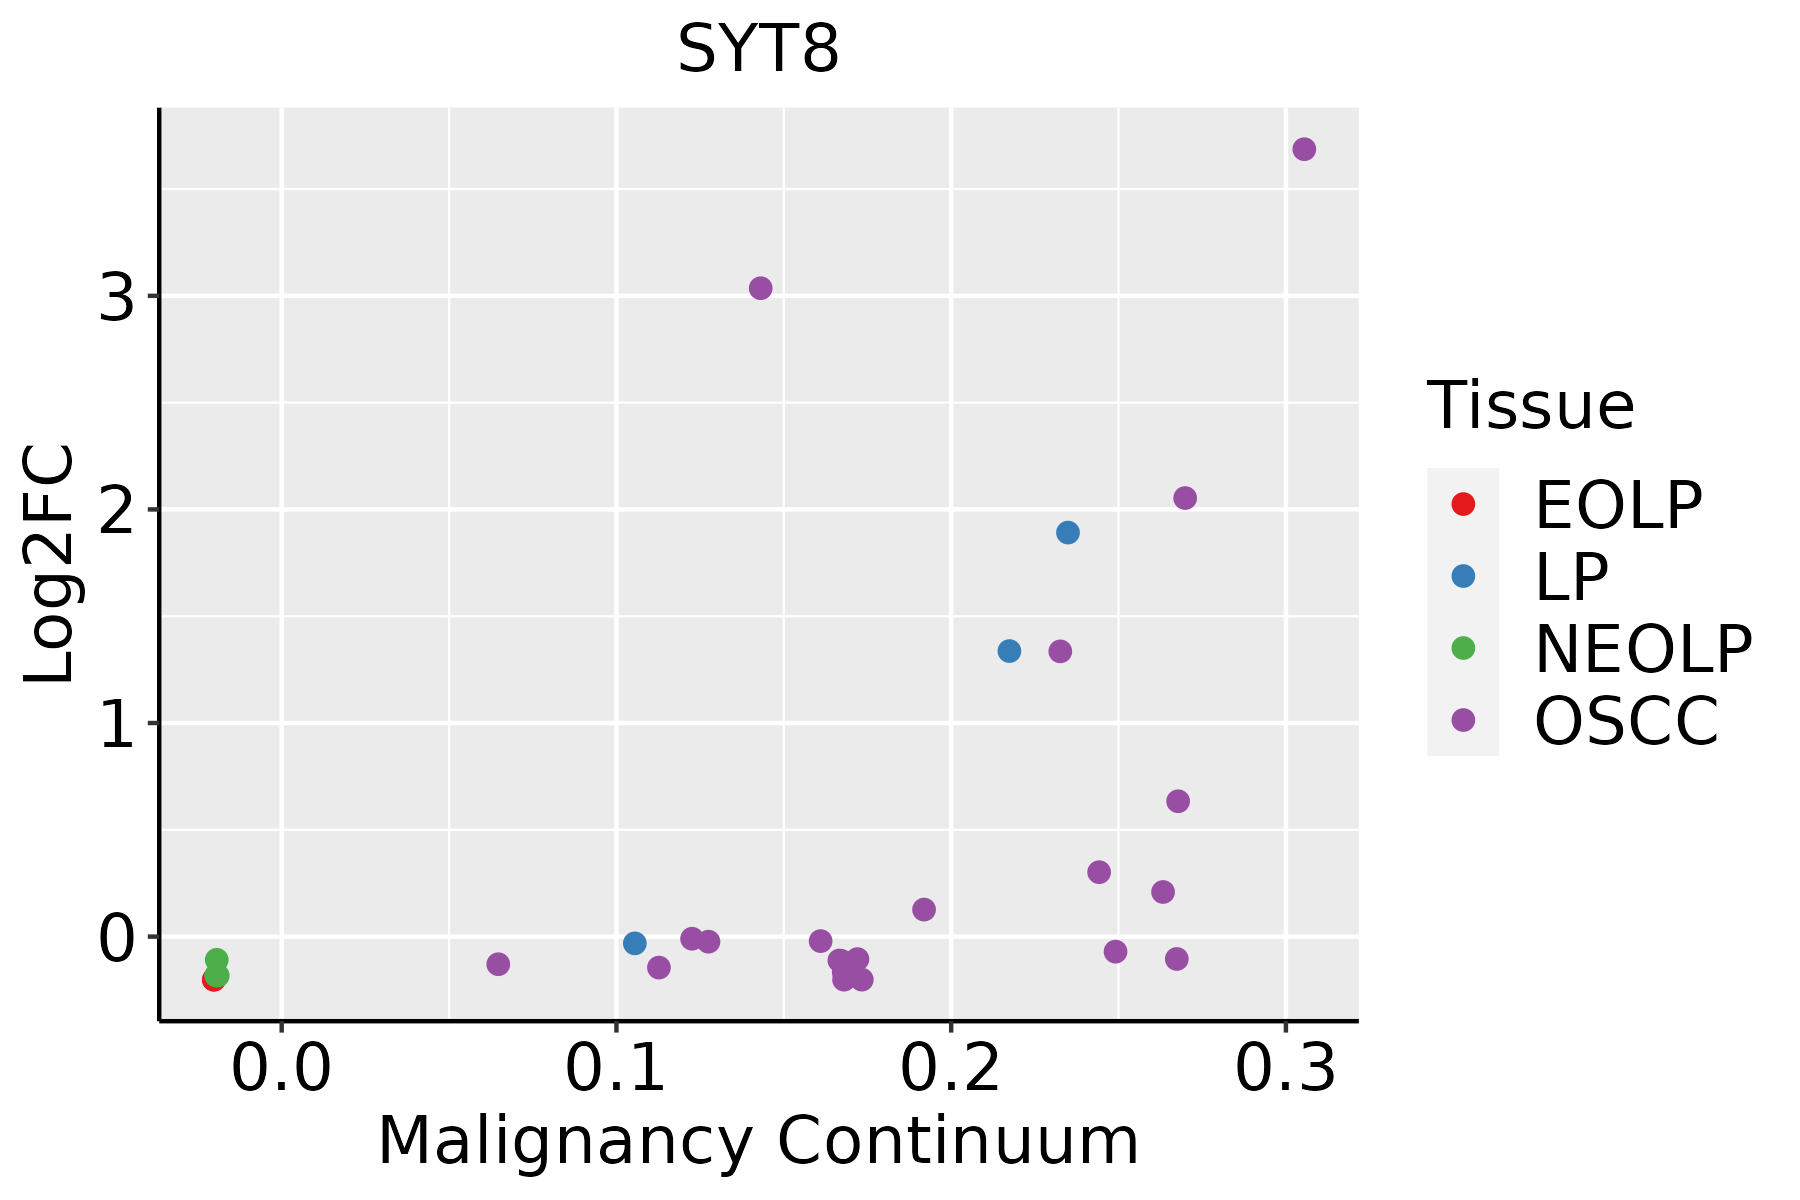 | EOLP: Erosive Oral lichen planus |
| LP: leukoplakia | ||
| NEOLP: Non-erosive oral lichen planus | ||
| OSCC: Oral squamous cell carcinoma | ||
| Skin | 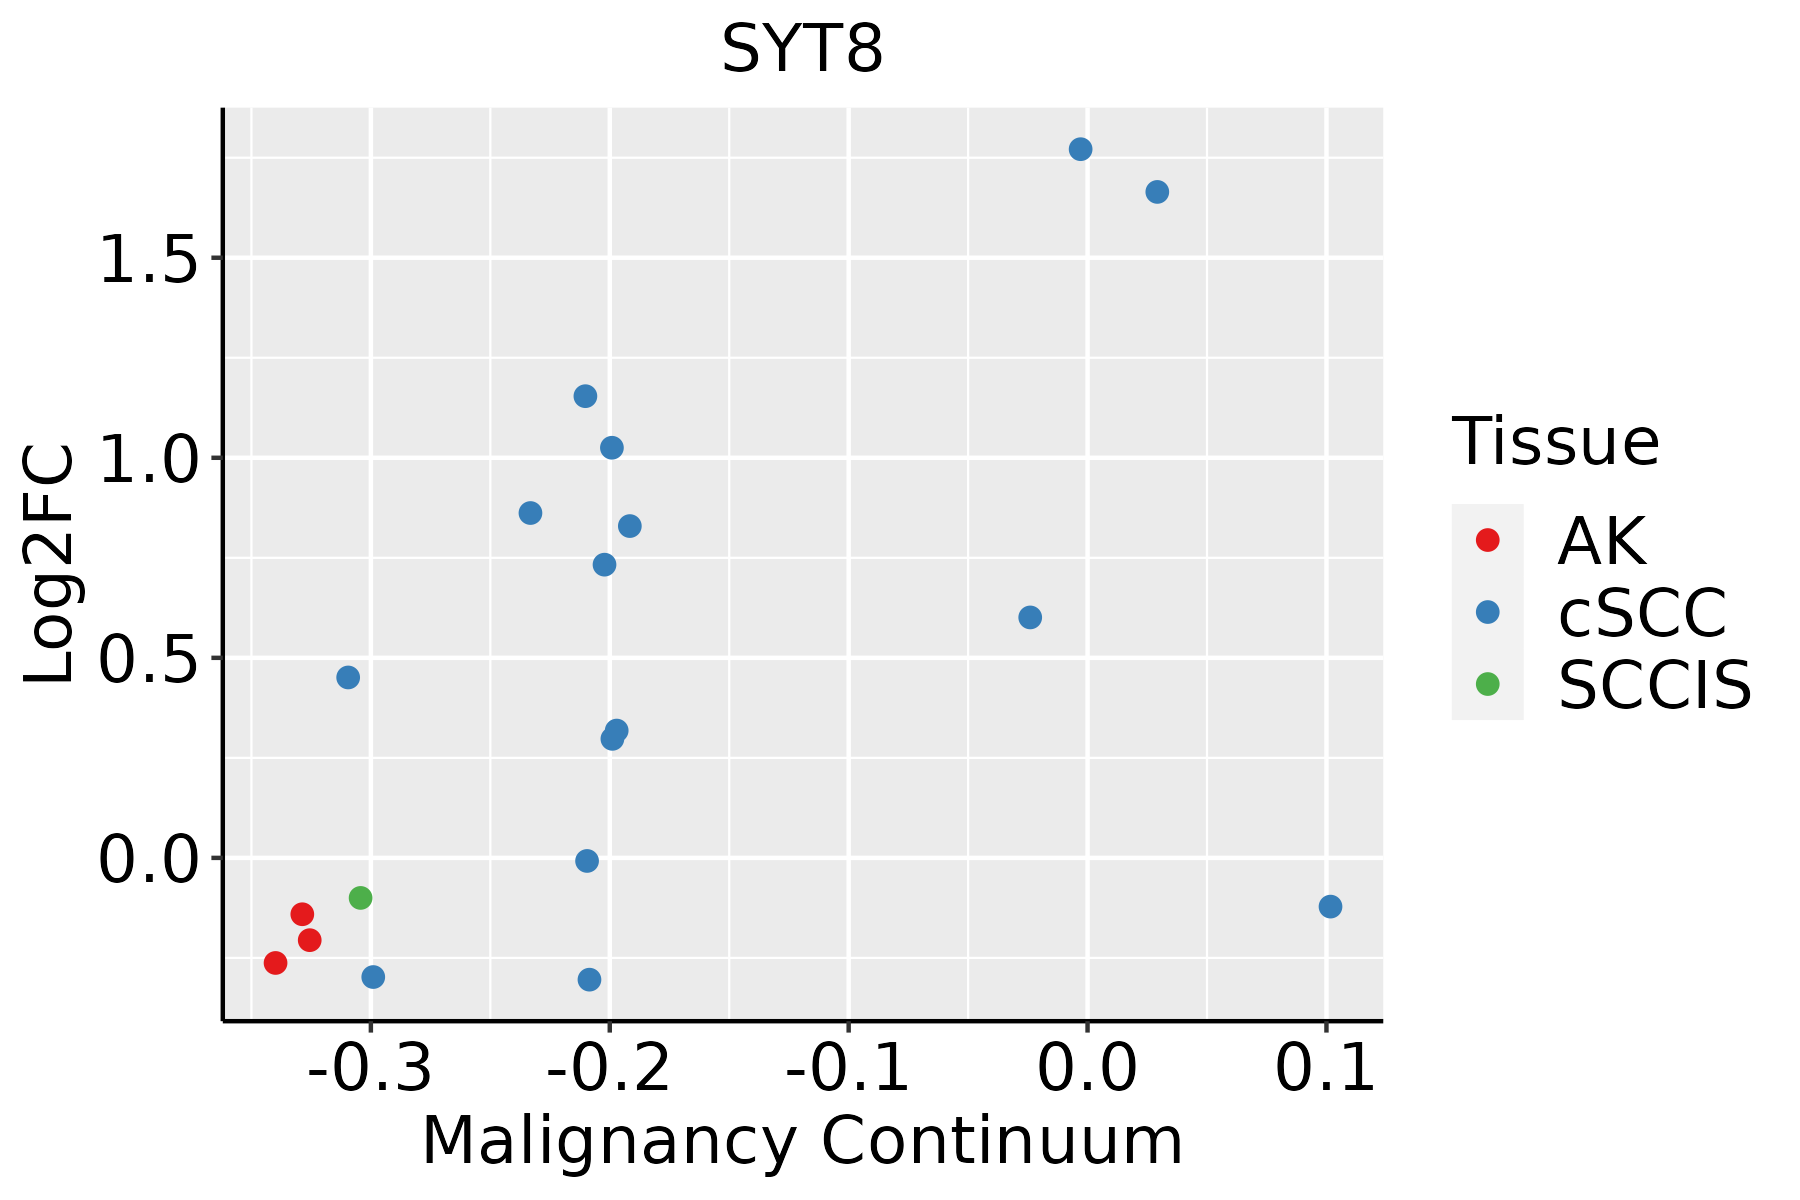 | AK: Actinic keratosis |
| cSCC: Cutaneous squamous cell carcinoma | ||
| SCCIS:squamous cell carcinoma in situ |
| ∗log2FC in expression of this searched gene in stem-like cells from each diseased tissue sample relative to stem-like cells in normal samples in each tissue plotted against the malignancy continuum. Samples are colored based on if they are from different disease stage. |
Top |
Malignant transformation related pathway analysis |
| Find out the enriched GO biological processes and KEGG pathways involved in transition from healthy to precancer to cancer |
| Tissue | Disease Stage | Enriched GO biological Processes |
| Colorectum | AD |  |
| Colorectum | SER |  |
| Colorectum | MSS |  |
| Colorectum | MSI-H |  |
| Colorectum | FAP |  |
| ∗Top 15 enriched GO BP terms are showed in the bar plot of each disease state in each tissue. Each row represents a significant GO biological process which is colored according to the -log10(p.adjust). |
| Page: 1 2 3 4 5 6 7 8 9 |
| GO ID | Tissue | Disease Stage | Description | Gene Ratio | Bg Ratio | pvalue | p.adjust | Count |
| GO:001003827 | Esophagus | ESCC | response to metal ion | 208/8552 | 373/18723 | 5.02e-05 | 3.90e-04 | 208 |
| GO:007124117 | Esophagus | ESCC | cellular response to inorganic substance | 125/8552 | 226/18723 | 2.17e-03 | 9.67e-03 | 125 |
| GO:001003820 | Oral cavity | OSCC | response to metal ion | 188/7305 | 373/18723 | 4.34e-06 | 5.00e-05 | 188 |
| GO:007124115 | Oral cavity | OSCC | cellular response to inorganic substance | 111/7305 | 226/18723 | 1.22e-03 | 6.10e-03 | 111 |
| GO:007124816 | Oral cavity | OSCC | cellular response to metal ion | 93/7305 | 197/18723 | 1.14e-02 | 3.85e-02 | 93 |
| GO:0010038110 | Oral cavity | LP | response to metal ion | 124/4623 | 373/18723 | 1.09e-04 | 1.31e-03 | 124 |
| GO:001003826 | Oral cavity | EOLP | response to metal ion | 71/2218 | 373/18723 | 3.32e-05 | 4.65e-04 | 71 |
| GO:00515929 | Oral cavity | EOLP | response to calcium ion | 33/2218 | 149/18723 | 2.62e-04 | 2.54e-03 | 33 |
| GO:00990035 | Oral cavity | EOLP | vesicle-mediated transport in synapse | 39/2218 | 200/18723 | 1.14e-03 | 8.29e-03 | 39 |
| GO:007124116 | Oral cavity | EOLP | cellular response to inorganic substance | 42/2218 | 226/18723 | 2.00e-03 | 1.28e-02 | 42 |
| GO:00068874 | Oral cavity | EOLP | exocytosis | 60/2218 | 352/18723 | 2.32e-03 | 1.43e-02 | 60 |
| GO:00995044 | Oral cavity | EOLP | synaptic vesicle cycle | 34/2218 | 181/18723 | 4.25e-03 | 2.33e-02 | 34 |
| GO:00484885 | Oral cavity | EOLP | synaptic vesicle endocytosis | 15/2218 | 62/18723 | 5.00e-03 | 2.64e-02 | 15 |
| GO:01402385 | Oral cavity | EOLP | presynaptic endocytosis | 15/2218 | 62/18723 | 5.00e-03 | 2.64e-02 | 15 |
| GO:007124817 | Oral cavity | EOLP | cellular response to metal ion | 35/2218 | 197/18723 | 9.17e-03 | 4.17e-02 | 35 |
| GO:001003829 | Skin | cSCC | response to metal ion | 132/4864 | 373/18723 | 3.11e-05 | 3.42e-04 | 132 |
| GO:005159217 | Skin | cSCC | response to calcium ion | 52/4864 | 149/18723 | 9.63e-03 | 4.31e-02 | 52 |
| Page: 1 |
| Pathway ID | Tissue | Disease Stage | Description | Gene Ratio | Bg Ratio | pvalue | p.adjust | qvalue | Count |
| Page: 1 |
Top |
Cell-cell communication analysis |
| Identification of potential cell-cell interactions between two cell types and their ligand-receptor pairs for different disease states |
| Ligand | Receptor | LRpair | Pathway | Tissue | Disease Stage |
| Page: 1 |
Top |
Single-cell gene regulatory network inference analysis |
| Find out the significant the regulons (TFs) and the target genes of each regulon across cell types for different disease states |
| TF | Cell Type | Tissue | Disease Stage | Target Gene | RSS | Regulon Activity |
| ∗The dot plots of a searched regulon are shown for all cell subpopulations in each disease state of each tissue based on the regulon specific score inferred using pySCENIC and by calculating the average expression. |
| Page: 1 |
Top |
Somatic mutation of malignant transformation related genes |
| Annotation of somatic variants for genes involved in malignant transformation |
| Hugo Symbol | Variant Class | Variant Classification | dbSNP RS | HGVSc | HGVSp | HGVSp Short | SWISSPROT | BIOTYPE | SIFT | PolyPhen | Tumor Sample Barcode | Tissue | Histology | Sex | Age | Stage | Therapy Types | Drugs | Outcome |
| SYT8 | deletion | Frame_Shift_Del | c.336delN | p.Asp114MetfsTer25 | p.D114Mfs*25 | Q8NBV8 | protein_coding | TCGA-D8-A1Y1-01 | Breast | breast invasive carcinoma | Female | >=65 | III/IV | Hormone Therapy | tamoxiphen | PD | |||
| SYT8 | SNV | Missense_Mutation | c.220N>C | p.Cys74Arg | p.C74R | Q8NBV8 | protein_coding | tolerated(0.4) | benign(0.003) | TCGA-A6-5665-01 | Colorectum | colon adenocarcinoma | Female | >=65 | I/II | Unknown | Unknown | PD | |
| SYT8 | SNV | Missense_Mutation | c.449N>C | p.Val150Ala | p.V150A | Q8NBV8 | protein_coding | tolerated(0.69) | benign(0) | TCGA-AD-6964-01 | Colorectum | colon adenocarcinoma | Male | <65 | III/IV | Chemotherapy | folfox | PD | |
| SYT8 | SNV | Missense_Mutation | c.86N>T | p.Gly29Val | p.G29V | Q8NBV8 | protein_coding | deleterious(0.03) | benign(0.278) | TCGA-D5-6540-01 | Colorectum | colon adenocarcinoma | Male | >=65 | I/II | Unknown | Unknown | SD | |
| SYT8 | SNV | Missense_Mutation | c.359N>T | p.Cys120Phe | p.C120F | Q8NBV8 | protein_coding | deleterious(0) | benign(0) | TCGA-AH-6644-01 | Colorectum | rectum adenocarcinoma | Male | >=65 | III/IV | Unknown | Unknown | SD | |
| SYT8 | SNV | Missense_Mutation | novel | c.884G>T | p.Arg295Ile | p.R295I | Q8NBV8 | protein_coding | deleterious(0) | possibly_damaging(0.69) | TCGA-F5-6814-01 | Colorectum | rectum adenocarcinoma | Male | <65 | I/II | Unknown | Unknown | SD |
| SYT8 | deletion | Frame_Shift_Del | novel | c.918delC | p.Tyr307ThrfsTer36 | p.Y307Tfs*36 | Q8NBV8 | protein_coding | TCGA-AA-3947-01 | Colorectum | colon adenocarcinoma | Female | <65 | I/II | Unknown | Unknown | SD | ||
| SYT8 | SNV | Missense_Mutation | novel | c.265C>A | p.Leu89Met | p.L89M | Q8NBV8 | protein_coding | tolerated(0.18) | benign(0.177) | TCGA-A5-A0G1-01 | Endometrium | uterine corpus endometrioid carcinoma | Female | >=65 | I/II | Unknown | Unknown | SD |
| SYT8 | SNV | Missense_Mutation | c.104G>A | p.Gly35Glu | p.G35E | Q8NBV8 | protein_coding | tolerated(0.11) | benign(0.376) | TCGA-AP-A0LM-01 | Endometrium | uterine corpus endometrioid carcinoma | Female | <65 | III/IV | Chemotherapy | cisplatin | SD | |
| SYT8 | SNV | Missense_Mutation | rs769119263 | c.911N>T | p.Ala304Val | p.A304V | Q8NBV8 | protein_coding | tolerated(0.33) | benign(0.202) | TCGA-AX-A2HD-01 | Endometrium | uterine corpus endometrioid carcinoma | Female | >=65 | III/IV | Unknown | Unknown | SD |
| Page: 1 2 3 |
Top |
Related drugs of malignant transformation related genes |
| Identification of chemicals and drugs interact with genes involved in malignant transfromation |
| (DGIdb 4.0) |
| Entrez ID | Symbol | Category | Interaction Types | Drug Claim Name | Drug Name | PMIDs |
| Page: 1 |

Copyright 2023-Present -The University of Texas Health Science Center at Houston |