
|
|||||
|
 | |
| |
| |
| |
| |
| |
|
Gene: SYT14 |
Gene summary for SYT14 |
| Gene information | Species | Human | Gene symbol | SYT14 | Gene ID | 255928 |
| Gene name | synaptotagmin 14 | |
| Gene Alias | SCAR11 | |
| Cytomap | 1q32.2 | |
| Gene Type | protein-coding | GO ID | GO:0005575 | UniProtAcc | A1L3Y1 |
Top |
Malignant transformation analysis |
| Identification of the aberrant gene expression in precancerous and cancerous lesions by comparing the gene expression of stem-like cells in diseased tissues with normal stem cells |
| Entrez ID | Symbol | Replicates | Species | Organ | Tissue | Adj P-value | Log2FC | Malignancy |
| 255928 | SYT14 | HTA12-15-2 | Human | Pancreas | PDAC | 3.78e-09 | 6.04e-01 | 0.2315 |
| 255928 | SYT14 | HTA12-23-1 | Human | Pancreas | PDAC | 3.85e-13 | 8.86e-01 | 0.3405 |
| 255928 | SYT14 | HTA12-25-1 | Human | Pancreas | PDAC | 1.33e-13 | 7.49e-01 | 0.313 |
| 255928 | SYT14 | HTA12-26-1 | Human | Pancreas | PDAC | 8.10e-29 | 1.07e+00 | 0.3728 |
| 255928 | SYT14 | HTA12-29-1 | Human | Pancreas | PDAC | 5.92e-54 | 1.01e+00 | 0.3722 |
| 255928 | SYT14 | HTA12-30-1 | Human | Pancreas | PDAC | 2.27e-04 | 9.17e-01 | 0.3671 |
| 255928 | SYT14 | male-WTA | Human | Thyroid | PTC | 2.45e-12 | 7.96e-02 | 0.1037 |
| 255928 | SYT14 | PTC01 | Human | Thyroid | PTC | 2.31e-04 | 7.27e-02 | 0.1899 |
| 255928 | SYT14 | PTC03 | Human | Thyroid | PTC | 1.77e-11 | 5.68e-01 | 0.1784 |
| 255928 | SYT14 | PTC04 | Human | Thyroid | PTC | 6.23e-08 | 1.90e-01 | 0.1927 |
| 255928 | SYT14 | PTC05 | Human | Thyroid | PTC | 8.19e-18 | 8.00e-01 | 0.2065 |
| 255928 | SYT14 | PTC06 | Human | Thyroid | PTC | 1.52e-21 | 3.93e-01 | 0.2057 |
| 255928 | SYT14 | PTC07 | Human | Thyroid | PTC | 7.79e-20 | 3.85e-01 | 0.2044 |
| 255928 | SYT14 | ATC12 | Human | Thyroid | ATC | 2.61e-07 | 3.03e-01 | 0.34 |
| 255928 | SYT14 | ATC13 | Human | Thyroid | ATC | 1.07e-28 | 4.72e-01 | 0.34 |
| 255928 | SYT14 | ATC4 | Human | Thyroid | ATC | 2.59e-11 | 3.77e-01 | 0.34 |
| 255928 | SYT14 | ATC5 | Human | Thyroid | ATC | 7.61e-28 | 5.25e-01 | 0.34 |
| Page: 1 |
| Tissue | Expression Dynamics | Abbreviation |
| Thyroid | 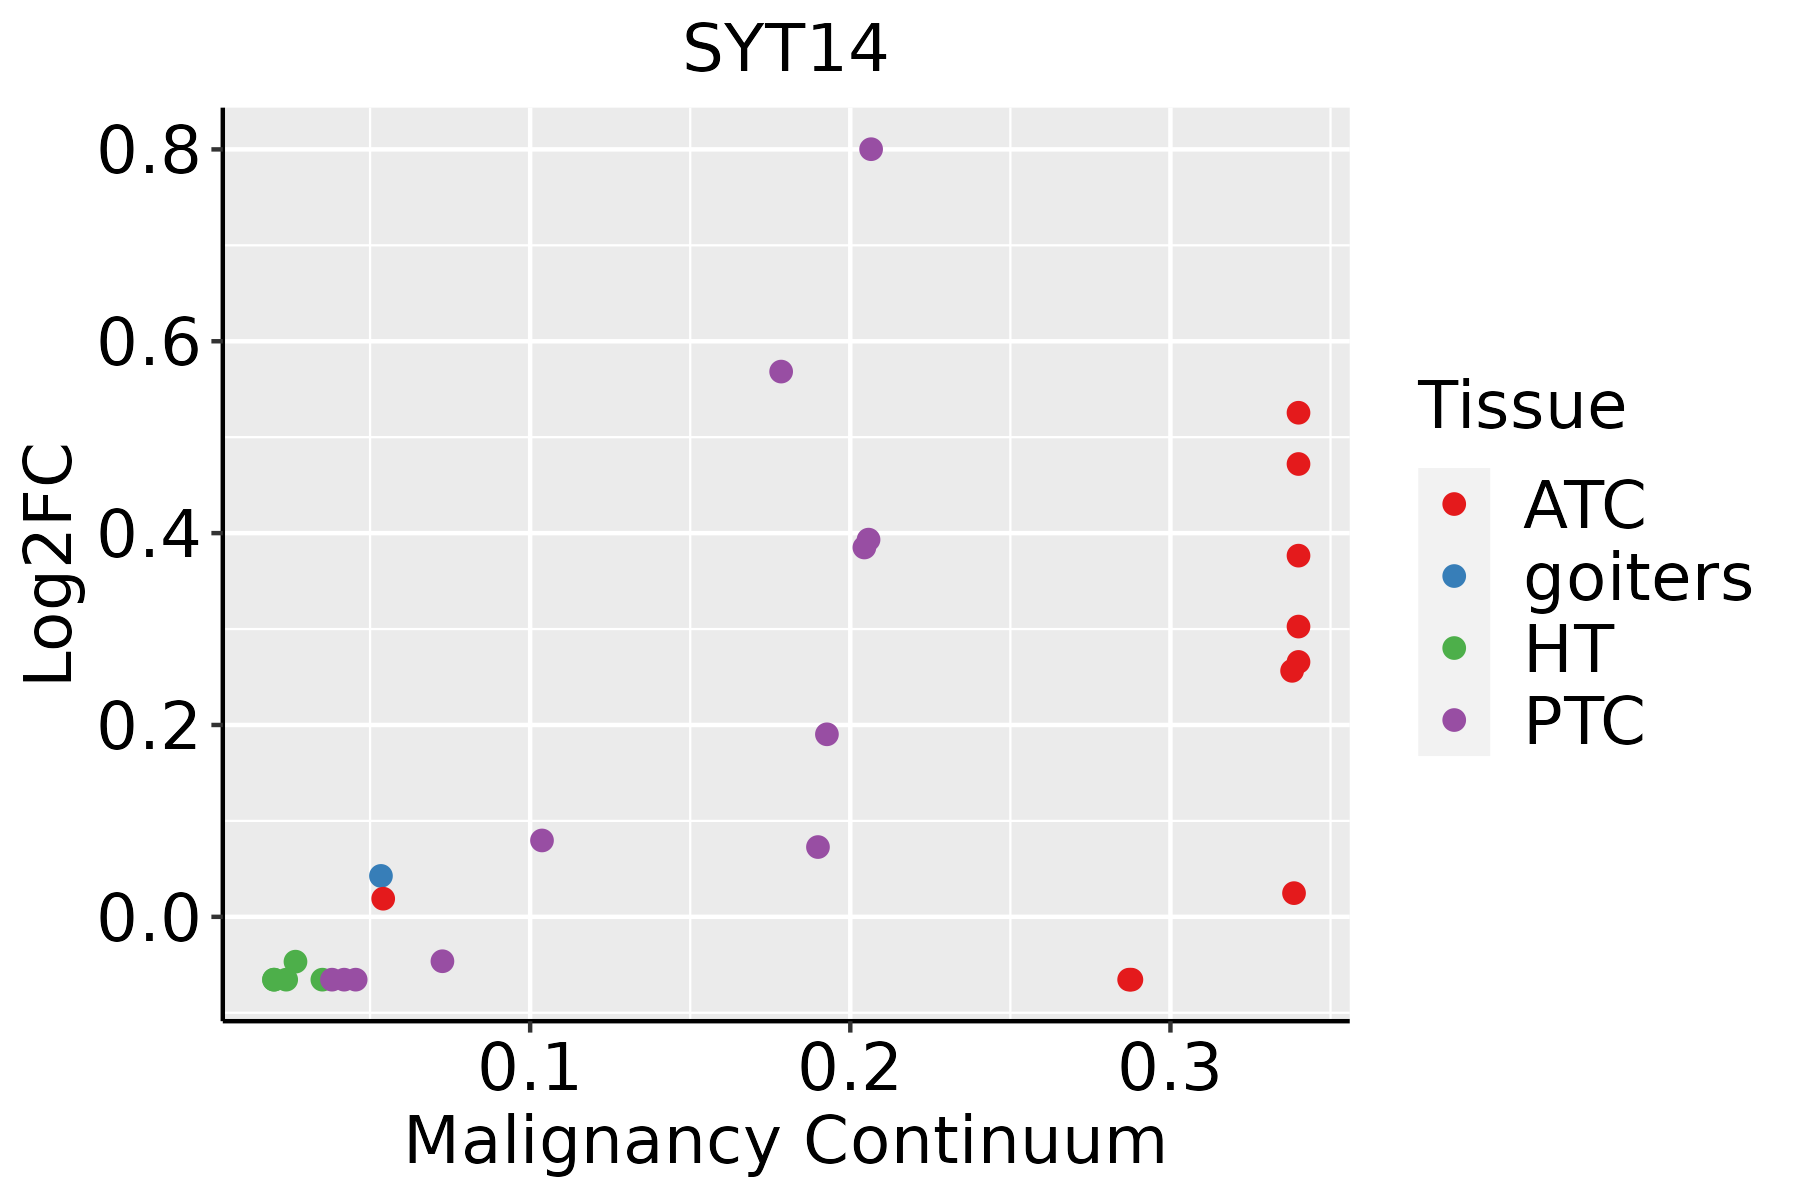 | ATC: Anaplastic thyroid cancer |
| HT: Hashimoto's thyroiditis | ||
| PTC: Papillary thyroid cancer |
| ∗log2FC in expression of this searched gene in stem-like cells from each diseased tissue sample relative to stem-like cells in normal samples in each tissue plotted against the malignancy continuum. Samples are colored based on if they are from different disease stage. |
Top |
Malignant transformation related pathway analysis |
| Find out the enriched GO biological processes and KEGG pathways involved in transition from healthy to precancer to cancer |
| Tissue | Disease Stage | Enriched GO biological Processes |
| Colorectum | AD |  |
| Colorectum | SER |  |
| Colorectum | MSS |  |
| Colorectum | MSI-H |  |
| Colorectum | FAP |  |
| ∗Top 15 enriched GO BP terms are showed in the bar plot of each disease state in each tissue. Each row represents a significant GO biological process which is colored according to the -log10(p.adjust). |
| Page: 1 2 3 4 5 6 7 8 9 |
| GO ID | Tissue | Disease Stage | Description | Gene Ratio | Bg Ratio | pvalue | p.adjust | Count |
| Page: 1 |
| Pathway ID | Tissue | Disease Stage | Description | Gene Ratio | Bg Ratio | pvalue | p.adjust | qvalue | Count |
| Page: 1 |
Top |
Cell-cell communication analysis |
| Identification of potential cell-cell interactions between two cell types and their ligand-receptor pairs for different disease states |
| Ligand | Receptor | LRpair | Pathway | Tissue | Disease Stage |
| Page: 1 |
Top |
Single-cell gene regulatory network inference analysis |
| Find out the significant the regulons (TFs) and the target genes of each regulon across cell types for different disease states |
| TF | Cell Type | Tissue | Disease Stage | Target Gene | RSS | Regulon Activity |
| ∗The dot plots of a searched regulon are shown for all cell subpopulations in each disease state of each tissue based on the regulon specific score inferred using pySCENIC and by calculating the average expression. |
| Page: 1 |
Top |
Somatic mutation of malignant transformation related genes |
| Annotation of somatic variants for genes involved in malignant transformation |
| Hugo Symbol | Variant Class | Variant Classification | dbSNP RS | HGVSc | HGVSp | HGVSp Short | SWISSPROT | BIOTYPE | SIFT | PolyPhen | Tumor Sample Barcode | Tissue | Histology | Sex | Age | Stage | Therapy Types | Drugs | Outcome |
| SYT14 | SNV | Missense_Mutation | novel | c.960N>C | p.Gln320His | p.Q320H | protein_coding | deleterious(0.03) | benign(0.43) | TCGA-5L-AAT0-01 | Breast | breast invasive carcinoma | Female | <65 | I/II | Hormone Therapy | tamoxiphen | SD | |
| SYT14 | SNV | Missense_Mutation | c.1194G>A | p.Met398Ile | p.M398I | protein_coding | deleterious(0.03) | benign(0.06) | TCGA-AC-A23H-01 | Breast | breast invasive carcinoma | Female | >=65 | I/II | Unknown | Unknown | PD | ||
| SYT14 | SNV | Missense_Mutation | c.1366C>G | p.Leu456Val | p.L456V | protein_coding | tolerated(0.17) | benign(0.083) | TCGA-AC-A23H-01 | Breast | breast invasive carcinoma | Female | >=65 | I/II | Unknown | Unknown | PD | ||
| SYT14 | SNV | Missense_Mutation | novel | c.1647A>C | p.Glu549Asp | p.E549D | protein_coding | deleterious(0) | probably_damaging(1) | TCGA-AN-A046-01 | Breast | breast invasive carcinoma | Female | >=65 | I/II | Unknown | Unknown | SD | |
| SYT14 | SNV | Missense_Mutation | c.1703N>G | p.Ser568Cys | p.S568C | protein_coding | deleterious(0) | probably_damaging(0.996) | TCGA-BH-A1EV-01 | Breast | breast invasive carcinoma | Female | <65 | III/IV | Unknown | Unknown | PD | ||
| SYT14 | SNV | Missense_Mutation | novel | c.833C>T | p.Ala278Val | p.A278V | protein_coding | deleterious(0) | possibly_damaging(0.614) | TCGA-D8-A27M-01 | Breast | breast invasive carcinoma | Female | <65 | I/II | Chemotherapy | methotrexate+5 | SD | |
| SYT14 | SNV | Missense_Mutation | c.1133N>C | p.Val378Ala | p.V378A | protein_coding | deleterious(0) | benign(0.209) | TCGA-E9-A1NE-01 | Breast | breast invasive carcinoma | Female | <65 | I/II | Chemotherapy | doxorubicin | CR | ||
| SYT14 | SNV | Missense_Mutation | rs751630321 | c.1718N>A | p.Arg573His | p.R573H | protein_coding | deleterious(0) | probably_damaging(0.996) | TCGA-EA-A410-01 | Cervix | cervical & endocervical cancer | Female | <65 | I/II | Unknown | Unknown | SD | |
| SYT14 | SNV | Missense_Mutation | c.46N>A | p.Glu16Lys | p.E16K | protein_coding | probably_damaging(0.969) | TCGA-IR-A3LA-01 | Cervix | cervical & endocervical cancer | Female | <65 | I/II | Chemotherapy | cisplatin | CR | |||
| SYT14 | SNV | Missense_Mutation | c.415N>A | p.Glu139Lys | p.E139K | protein_coding | tolerated(0.06) | possibly_damaging(0.778) | TCGA-IR-A3LI-01 | Cervix | cervical & endocervical cancer | Female | <65 | I/II | Chemotherapy | cisplatin | CR |
| Page: 1 2 3 4 5 6 7 8 |
Top |
Related drugs of malignant transformation related genes |
| Identification of chemicals and drugs interact with genes involved in malignant transfromation |
| (DGIdb 4.0) |
| Entrez ID | Symbol | Category | Interaction Types | Drug Claim Name | Drug Name | PMIDs |
| Page: 1 |

Copyright 2023-Present -The University of Texas Health Science Center at Houston |