
|
|||||
|
 | |
| |
| |
| |
| |
| |
|
Gene: SYT12 |
Gene summary for SYT12 |
| Gene information | Species | Human | Gene symbol | SYT12 | Gene ID | 91683 |
| Gene name | synaptotagmin 12 | |
| Gene Alias | SYT11 | |
| Cytomap | 11q13.2 | |
| Gene Type | protein-coding | GO ID | GO:0001505 | UniProtAcc | B0AZL9 |
Top |
Malignant transformation analysis |
| Identification of the aberrant gene expression in precancerous and cancerous lesions by comparing the gene expression of stem-like cells in diseased tissues with normal stem cells |
| Entrez ID | Symbol | Replicates | Species | Organ | Tissue | Adj P-value | Log2FC | Malignancy |
| 91683 | SYT12 | male-WTA | Human | Thyroid | PTC | 1.17e-31 | 4.14e-01 | 0.1037 |
| 91683 | SYT12 | PTC01 | Human | Thyroid | PTC | 3.77e-15 | 3.25e-01 | 0.1899 |
| 91683 | SYT12 | PTC04 | Human | Thyroid | PTC | 2.77e-07 | 1.72e-01 | 0.1927 |
| 91683 | SYT12 | PTC05 | Human | Thyroid | PTC | 5.09e-25 | 9.26e-01 | 0.2065 |
| 91683 | SYT12 | PTC06 | Human | Thyroid | PTC | 2.39e-47 | 1.07e+00 | 0.2057 |
| 91683 | SYT12 | PTC07 | Human | Thyroid | PTC | 1.15e-38 | 6.71e-01 | 0.2044 |
| Page: 1 |
| Tissue | Expression Dynamics | Abbreviation |
| Thyroid | 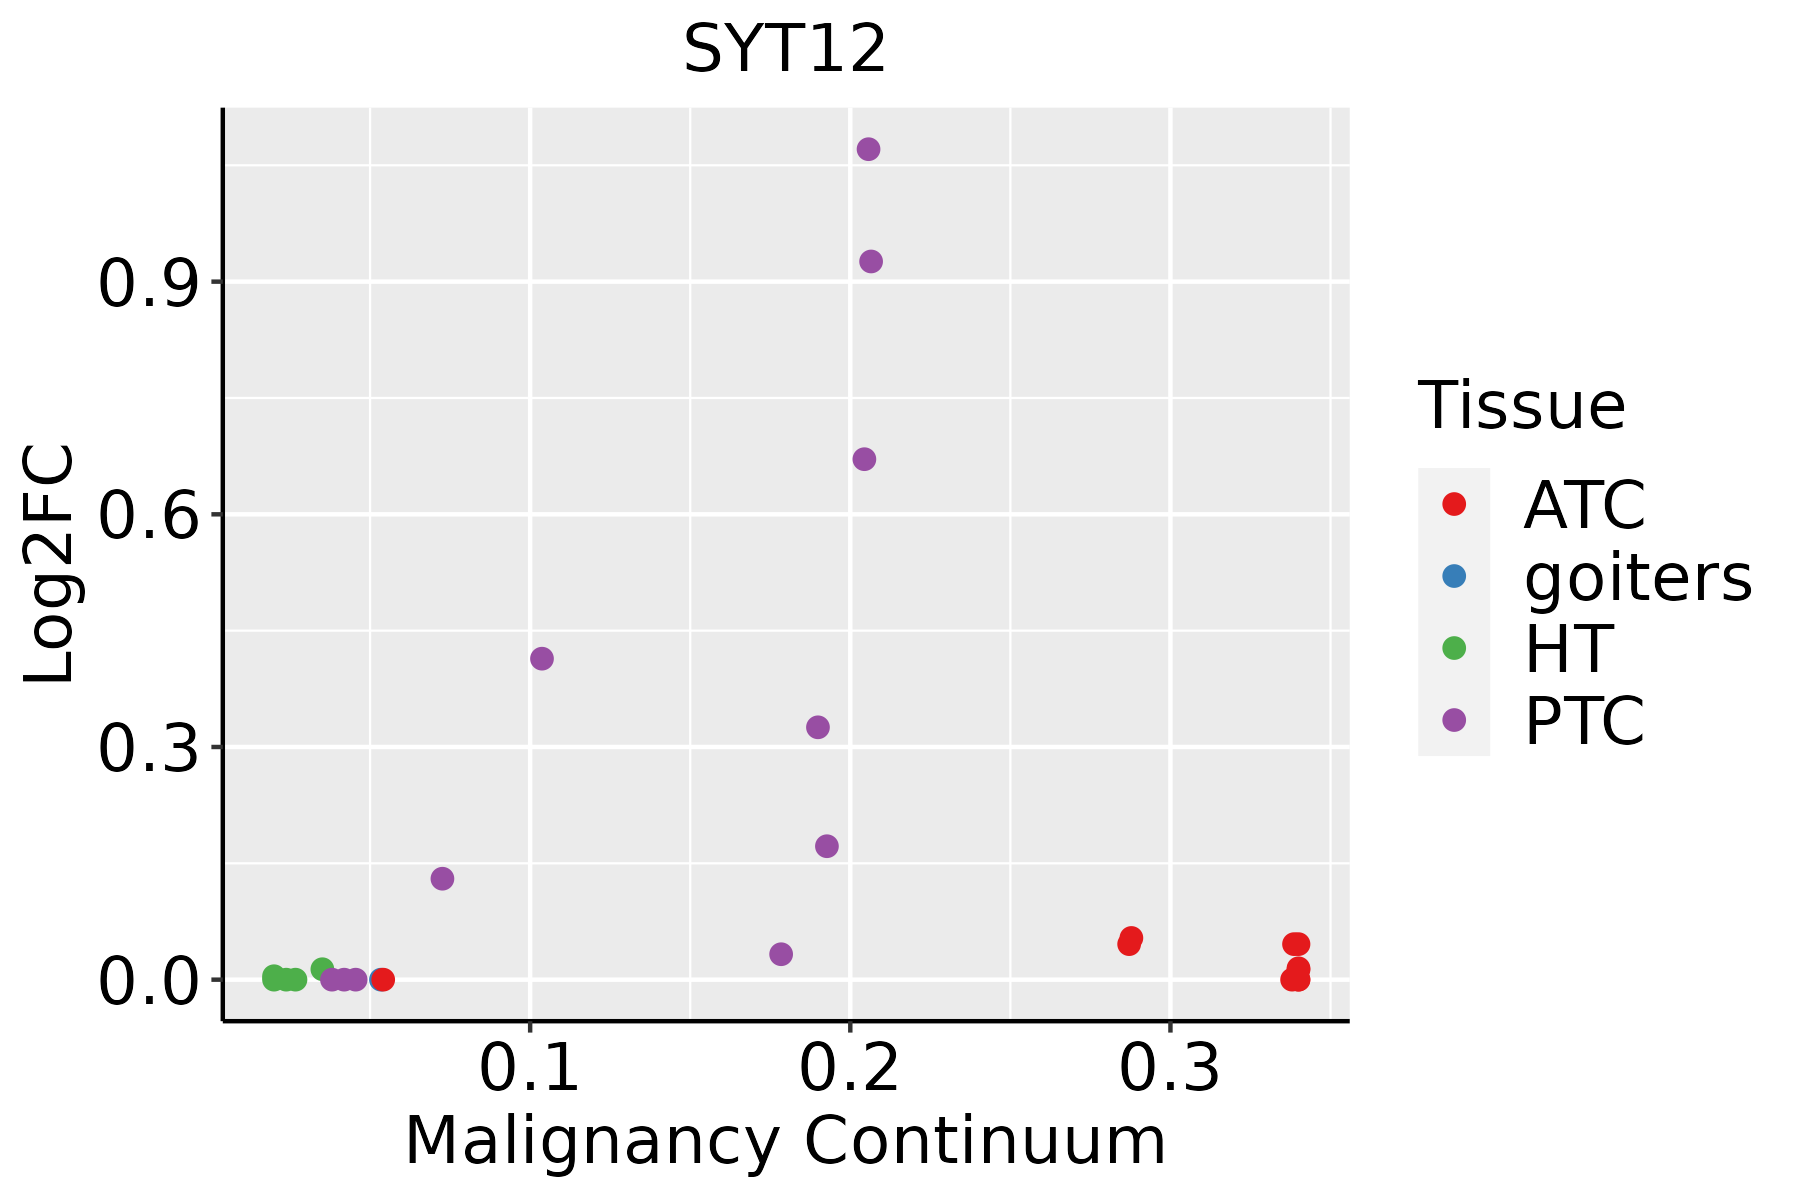 | ATC: Anaplastic thyroid cancer |
| HT: Hashimoto's thyroiditis | ||
| PTC: Papillary thyroid cancer |
| ∗log2FC in expression of this searched gene in stem-like cells from each diseased tissue sample relative to stem-like cells in normal samples in each tissue plotted against the malignancy continuum. Samples are colored based on if they are from different disease stage. |
Top |
Malignant transformation related pathway analysis |
| Find out the enriched GO biological processes and KEGG pathways involved in transition from healthy to precancer to cancer |
| Tissue | Disease Stage | Enriched GO biological Processes |
| Colorectum | AD |  |
| Colorectum | SER |  |
| Colorectum | MSS |  |
| Colorectum | MSI-H |  |
| Colorectum | FAP |  |
| ∗Top 15 enriched GO BP terms are showed in the bar plot of each disease state in each tissue. Each row represents a significant GO biological process which is colored according to the -log10(p.adjust). |
| Page: 1 2 3 4 5 6 7 8 9 |
| GO ID | Tissue | Disease Stage | Description | Gene Ratio | Bg Ratio | pvalue | p.adjust | Count |
| GO:0010038112 | Thyroid | PTC | response to metal ion | 157/5968 | 373/18723 | 1.80e-05 | 1.86e-04 | 157 |
| GO:005159219 | Thyroid | PTC | response to calcium ion | 65/5968 | 149/18723 | 1.67e-03 | 9.16e-03 | 65 |
| GO:0071241110 | Thyroid | PTC | cellular response to inorganic substance | 92/5968 | 226/18723 | 3.01e-03 | 1.49e-02 | 92 |
| GO:0071248110 | Thyroid | PTC | cellular response to metal ion | 78/5968 | 197/18723 | 1.29e-02 | 4.98e-02 | 78 |
| Page: 1 |
| Pathway ID | Tissue | Disease Stage | Description | Gene Ratio | Bg Ratio | pvalue | p.adjust | qvalue | Count |
| Page: 1 |
Top |
Cell-cell communication analysis |
| Identification of potential cell-cell interactions between two cell types and their ligand-receptor pairs for different disease states |
| Ligand | Receptor | LRpair | Pathway | Tissue | Disease Stage |
| Page: 1 |
Top |
Single-cell gene regulatory network inference analysis |
| Find out the significant the regulons (TFs) and the target genes of each regulon across cell types for different disease states |
| TF | Cell Type | Tissue | Disease Stage | Target Gene | RSS | Regulon Activity |
| ∗The dot plots of a searched regulon are shown for all cell subpopulations in each disease state of each tissue based on the regulon specific score inferred using pySCENIC and by calculating the average expression. |
| Page: 1 |
Top |
Somatic mutation of malignant transformation related genes |
| Annotation of somatic variants for genes involved in malignant transformation |
| Hugo Symbol | Variant Class | Variant Classification | dbSNP RS | HGVSc | HGVSp | HGVSp Short | SWISSPROT | BIOTYPE | SIFT | PolyPhen | Tumor Sample Barcode | Tissue | Histology | Sex | Age | Stage | Therapy Types | Drugs | Outcome |
| SYT12 | SNV | Missense_Mutation | novel | c.814C>A | p.Leu272Ile | p.L272I | Q8IV01 | protein_coding | tolerated(0.21) | benign(0.062) | TCGA-A8-A09E-01 | Breast | breast invasive carcinoma | Female | >=65 | III/IV | Hormone Therapy | anastrozole | SD |
| SYT12 | SNV | Missense_Mutation | novel | c.815T>G | p.Leu272Arg | p.L272R | Q8IV01 | protein_coding | deleterious(0) | probably_damaging(0.914) | TCGA-A8-A09E-01 | Breast | breast invasive carcinoma | Female | >=65 | III/IV | Hormone Therapy | anastrozole | SD |
| SYT12 | SNV | Missense_Mutation | c.808N>T | p.Gly270Cys | p.G270C | Q8IV01 | protein_coding | tolerated(0.07) | benign(0.428) | TCGA-E2-A14O-01 | Breast | breast invasive carcinoma | Female | >=65 | III/IV | Hormone Therapy | arimidex | SD | |
| SYT12 | SNV | Missense_Mutation | c.313G>C | p.Glu105Gln | p.E105Q | Q8IV01 | protein_coding | deleterious_low_confidence(0.01) | benign(0.076) | TCGA-E2-A1IN-01 | Breast | breast invasive carcinoma | Female | <65 | I/II | Hormone Therapy | arimidex | SD | |
| SYT12 | SNV | Missense_Mutation | novel | c.776N>T | p.Ser259Phe | p.S259F | Q8IV01 | protein_coding | tolerated(0.05) | possibly_damaging(0.641) | TCGA-E2-A2P6-01 | Breast | breast invasive carcinoma | Female | >=65 | I/II | Hormone Therapy | anastrozole | SD |
| SYT12 | insertion | Nonsense_Mutation | novel | c.736_737insGCCTTTCTTTAAATATCACCAGGCAGTGACT | p.Glu246GlyfsTer10 | p.E246Gfs*10 | Q8IV01 | protein_coding | TCGA-A2-A0CP-01 | Breast | breast invasive carcinoma | Female | <65 | I/II | Chemotherapy | cytoxan | SD | ||
| SYT12 | insertion | Frame_Shift_Ins | novel | c.552_553insGCCAGCTTCGAGTCCTGCTTCATGCGCGTCA | p.Leu196GlnfsTer33 | p.L196Qfs*33 | Q8IV01 | protein_coding | TCGA-A7-A0DB-01 | Breast | breast invasive carcinoma | Female | <65 | I/II | Hormone Therapy | arimidex | SD | ||
| SYT12 | SNV | Missense_Mutation | novel | c.214G>C | p.Glu72Gln | p.E72Q | Q8IV01 | protein_coding | tolerated_low_confidence(0.12) | benign(0.005) | TCGA-C5-A8XJ-01 | Cervix | cervical & endocervical cancer | Female | >=65 | I/II | Chemotherapy | cisplatin | SD |
| SYT12 | SNV | Missense_Mutation | c.42N>C | p.Lys14Asn | p.K14N | Q8IV01 | protein_coding | tolerated_low_confidence(0.25) | benign(0.01) | TCGA-FU-A23K-01 | Cervix | cervical & endocervical cancer | Female | <65 | III/IV | Unknown | Unknown | SD | |
| SYT12 | SNV | Missense_Mutation | novel | c.481N>C | p.Glu161Gln | p.E161Q | Q8IV01 | protein_coding | tolerated(0.16) | benign(0.005) | TCGA-JW-A5VL-01 | Cervix | cervical & endocervical cancer | Female | <65 | I/II | Unknown | Unknown | SD |
| Page: 1 2 3 4 5 6 |
Top |
Related drugs of malignant transformation related genes |
| Identification of chemicals and drugs interact with genes involved in malignant transfromation |
| (DGIdb 4.0) |
| Entrez ID | Symbol | Category | Interaction Types | Drug Claim Name | Drug Name | PMIDs |
| Page: 1 |

Copyright 2023-Present -The University of Texas Health Science Center at Houston |