
|
|||||
|
 | |
| |
| |
| |
| |
| |
|
Gene: SYT1 |
Gene summary for SYT1 |
| Gene information | Species | Human | Gene symbol | SYT1 | Gene ID | 6857 |
| Gene name | synaptotagmin 1 | |
| Gene Alias | BAGOS | |
| Cytomap | 12q21.2 | |
| Gene Type | protein-coding | GO ID | GO:0000902 | UniProtAcc | A0A024RBE9 |
Top |
Malignant transformation analysis |
| Identification of the aberrant gene expression in precancerous and cancerous lesions by comparing the gene expression of stem-like cells in diseased tissues with normal stem cells |
| Entrez ID | Symbol | Replicates | Species | Organ | Tissue | Adj P-value | Log2FC | Malignancy |
| 6857 | SYT1 | LZE7T | Human | Esophagus | ESCC | 2.07e-15 | 6.94e-01 | 0.0667 |
| 6857 | SYT1 | LZE24T | Human | Esophagus | ESCC | 1.80e-03 | 1.16e-01 | 0.0596 |
| 6857 | SYT1 | P1T-E | Human | Esophagus | ESCC | 1.64e-05 | 2.73e-01 | 0.0875 |
| 6857 | SYT1 | P2T-E | Human | Esophagus | ESCC | 9.67e-18 | 3.08e-01 | 0.1177 |
| 6857 | SYT1 | P5T-E | Human | Esophagus | ESCC | 9.56e-08 | 1.86e-01 | 0.1327 |
| 6857 | SYT1 | P10T-E | Human | Esophagus | ESCC | 3.87e-34 | 6.93e-01 | 0.116 |
| 6857 | SYT1 | P20T-E | Human | Esophagus | ESCC | 4.38e-08 | 2.10e-01 | 0.1124 |
| 6857 | SYT1 | P22T-E | Human | Esophagus | ESCC | 1.66e-02 | 8.90e-02 | 0.1236 |
| 6857 | SYT1 | P23T-E | Human | Esophagus | ESCC | 2.89e-02 | 9.87e-02 | 0.108 |
| 6857 | SYT1 | P24T-E | Human | Esophagus | ESCC | 3.75e-03 | 9.10e-02 | 0.1287 |
| 6857 | SYT1 | P26T-E | Human | Esophagus | ESCC | 7.28e-26 | 4.66e-01 | 0.1276 |
| 6857 | SYT1 | P27T-E | Human | Esophagus | ESCC | 8.56e-12 | 2.35e-01 | 0.1055 |
| 6857 | SYT1 | P28T-E | Human | Esophagus | ESCC | 9.02e-11 | 2.45e-01 | 0.1149 |
| 6857 | SYT1 | P32T-E | Human | Esophagus | ESCC | 1.78e-03 | 1.14e-01 | 0.1666 |
| 6857 | SYT1 | P37T-E | Human | Esophagus | ESCC | 8.12e-10 | 2.19e-01 | 0.1371 |
| 6857 | SYT1 | P48T-E | Human | Esophagus | ESCC | 1.66e-02 | 8.30e-02 | 0.0959 |
| 6857 | SYT1 | P52T-E | Human | Esophagus | ESCC | 4.41e-07 | 1.68e-01 | 0.1555 |
| 6857 | SYT1 | P54T-E | Human | Esophagus | ESCC | 4.58e-05 | 1.46e-01 | 0.0975 |
| 6857 | SYT1 | P61T-E | Human | Esophagus | ESCC | 9.36e-10 | 2.18e-01 | 0.099 |
| 6857 | SYT1 | P62T-E | Human | Esophagus | ESCC | 2.29e-08 | 1.77e-01 | 0.1302 |
| Page: 1 2 3 |
| Tissue | Expression Dynamics | Abbreviation |
| Esophagus | 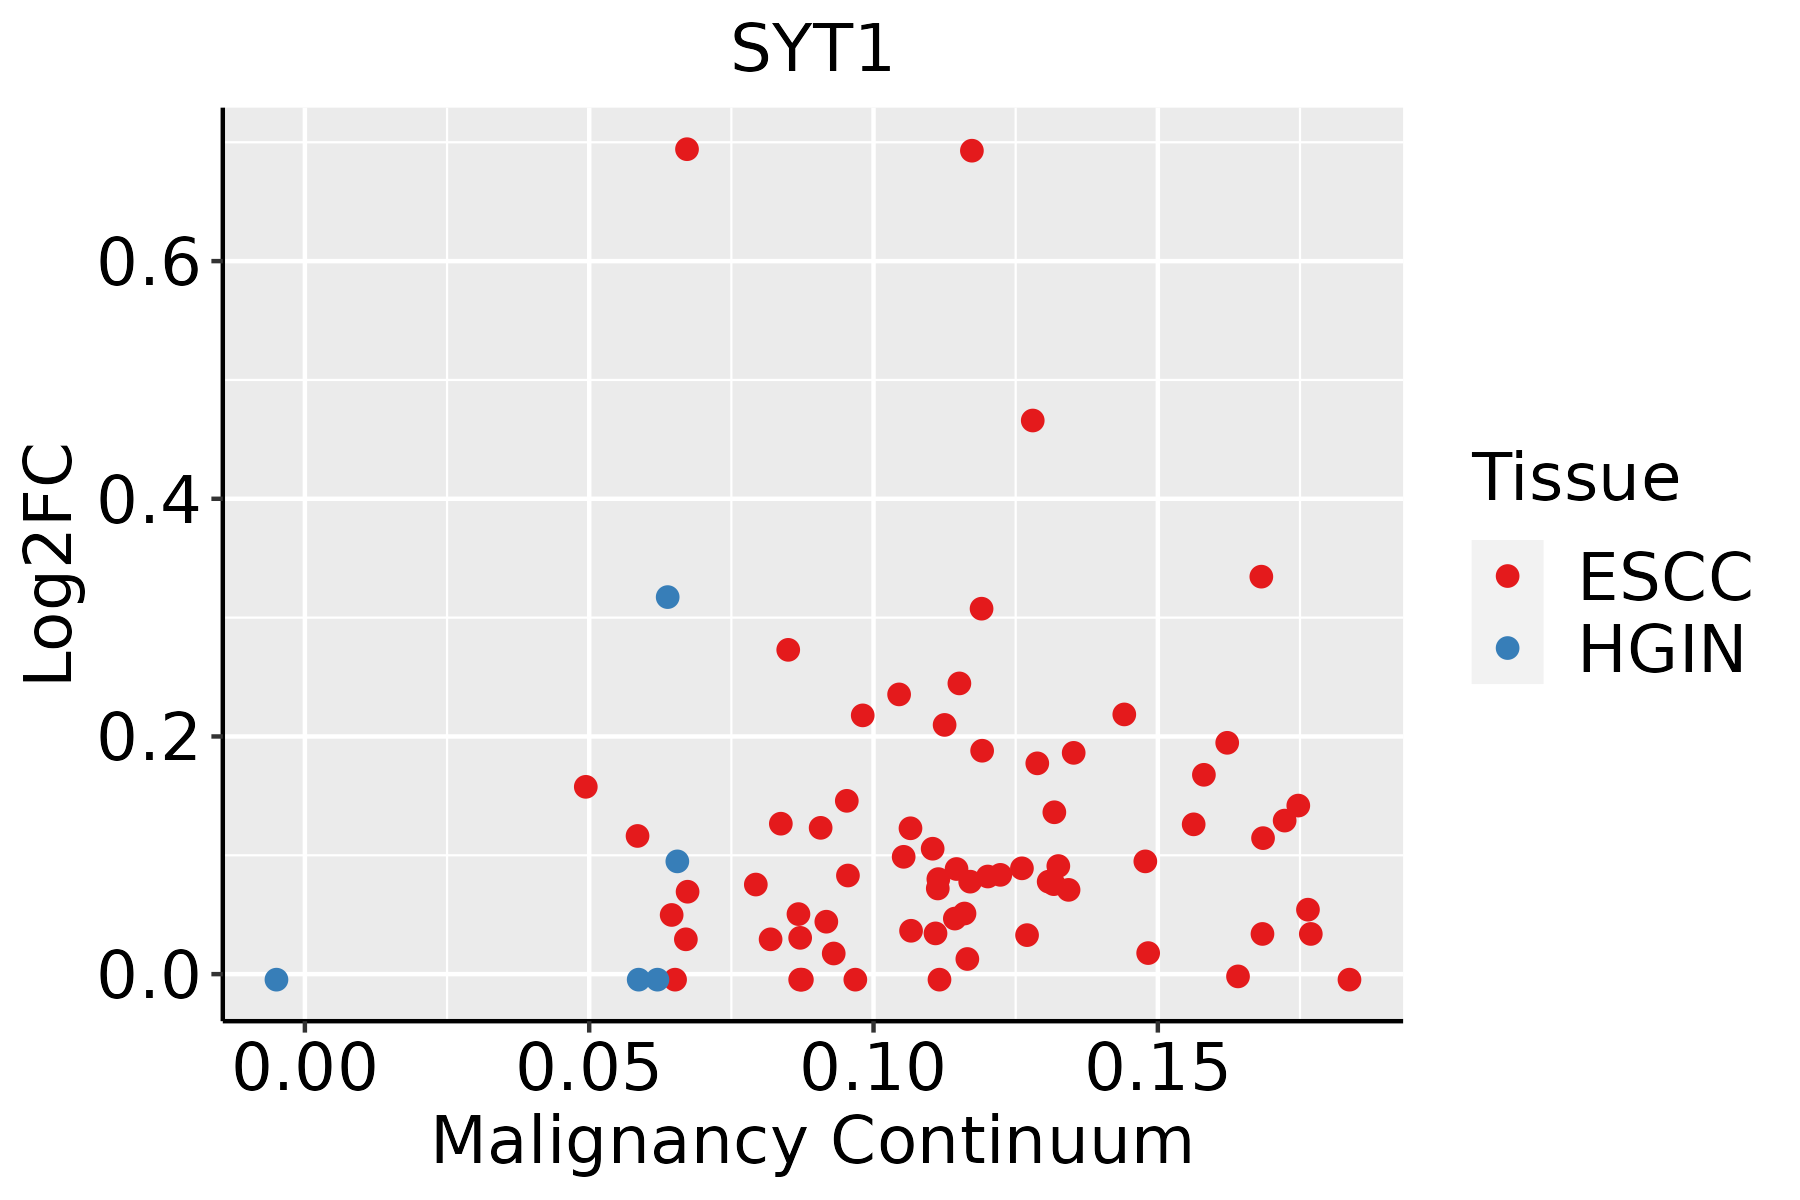 | ESCC: Esophageal squamous cell carcinoma |
| HGIN: High-grade intraepithelial neoplasias | ||
| LGIN: Low-grade intraepithelial neoplasias | ||
| Liver | 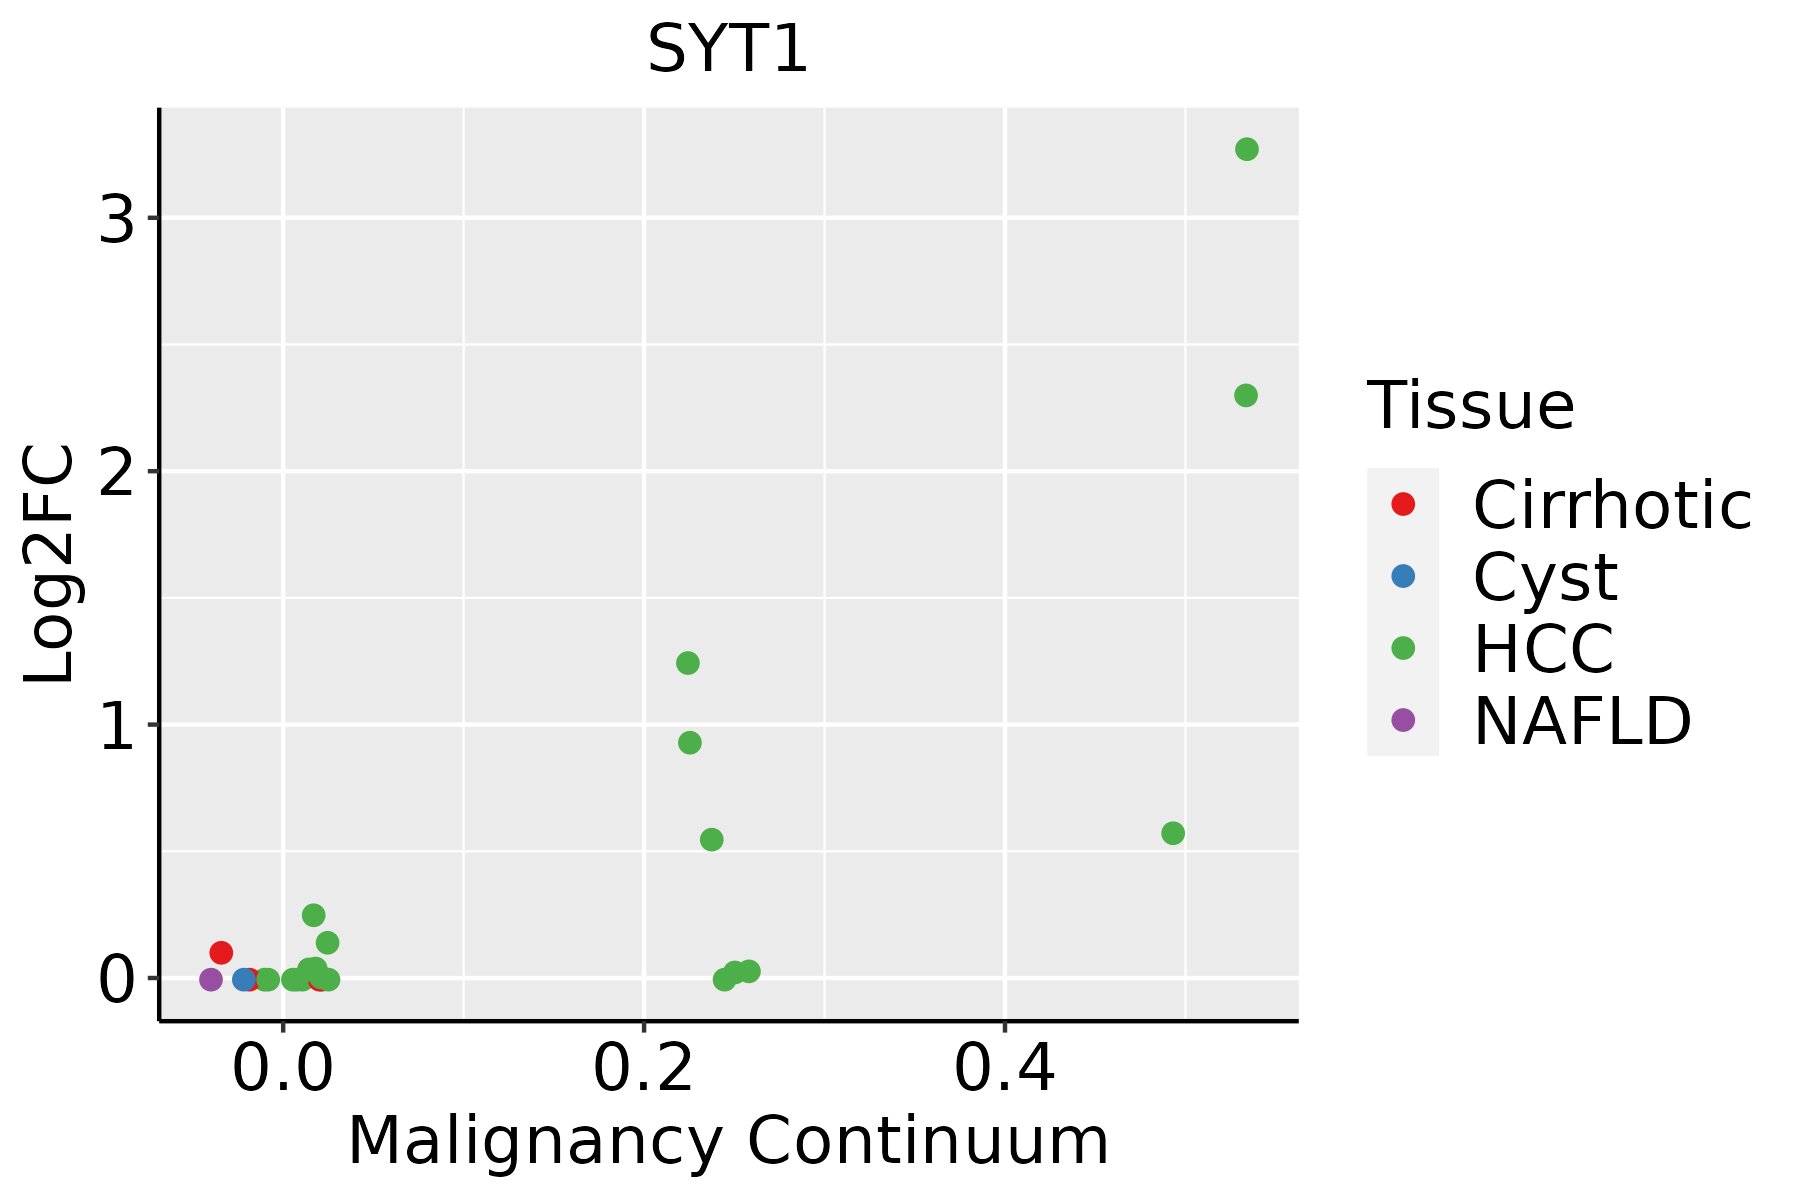 | HCC: Hepatocellular carcinoma |
| NAFLD: Non-alcoholic fatty liver disease | ||
| Oral Cavity | 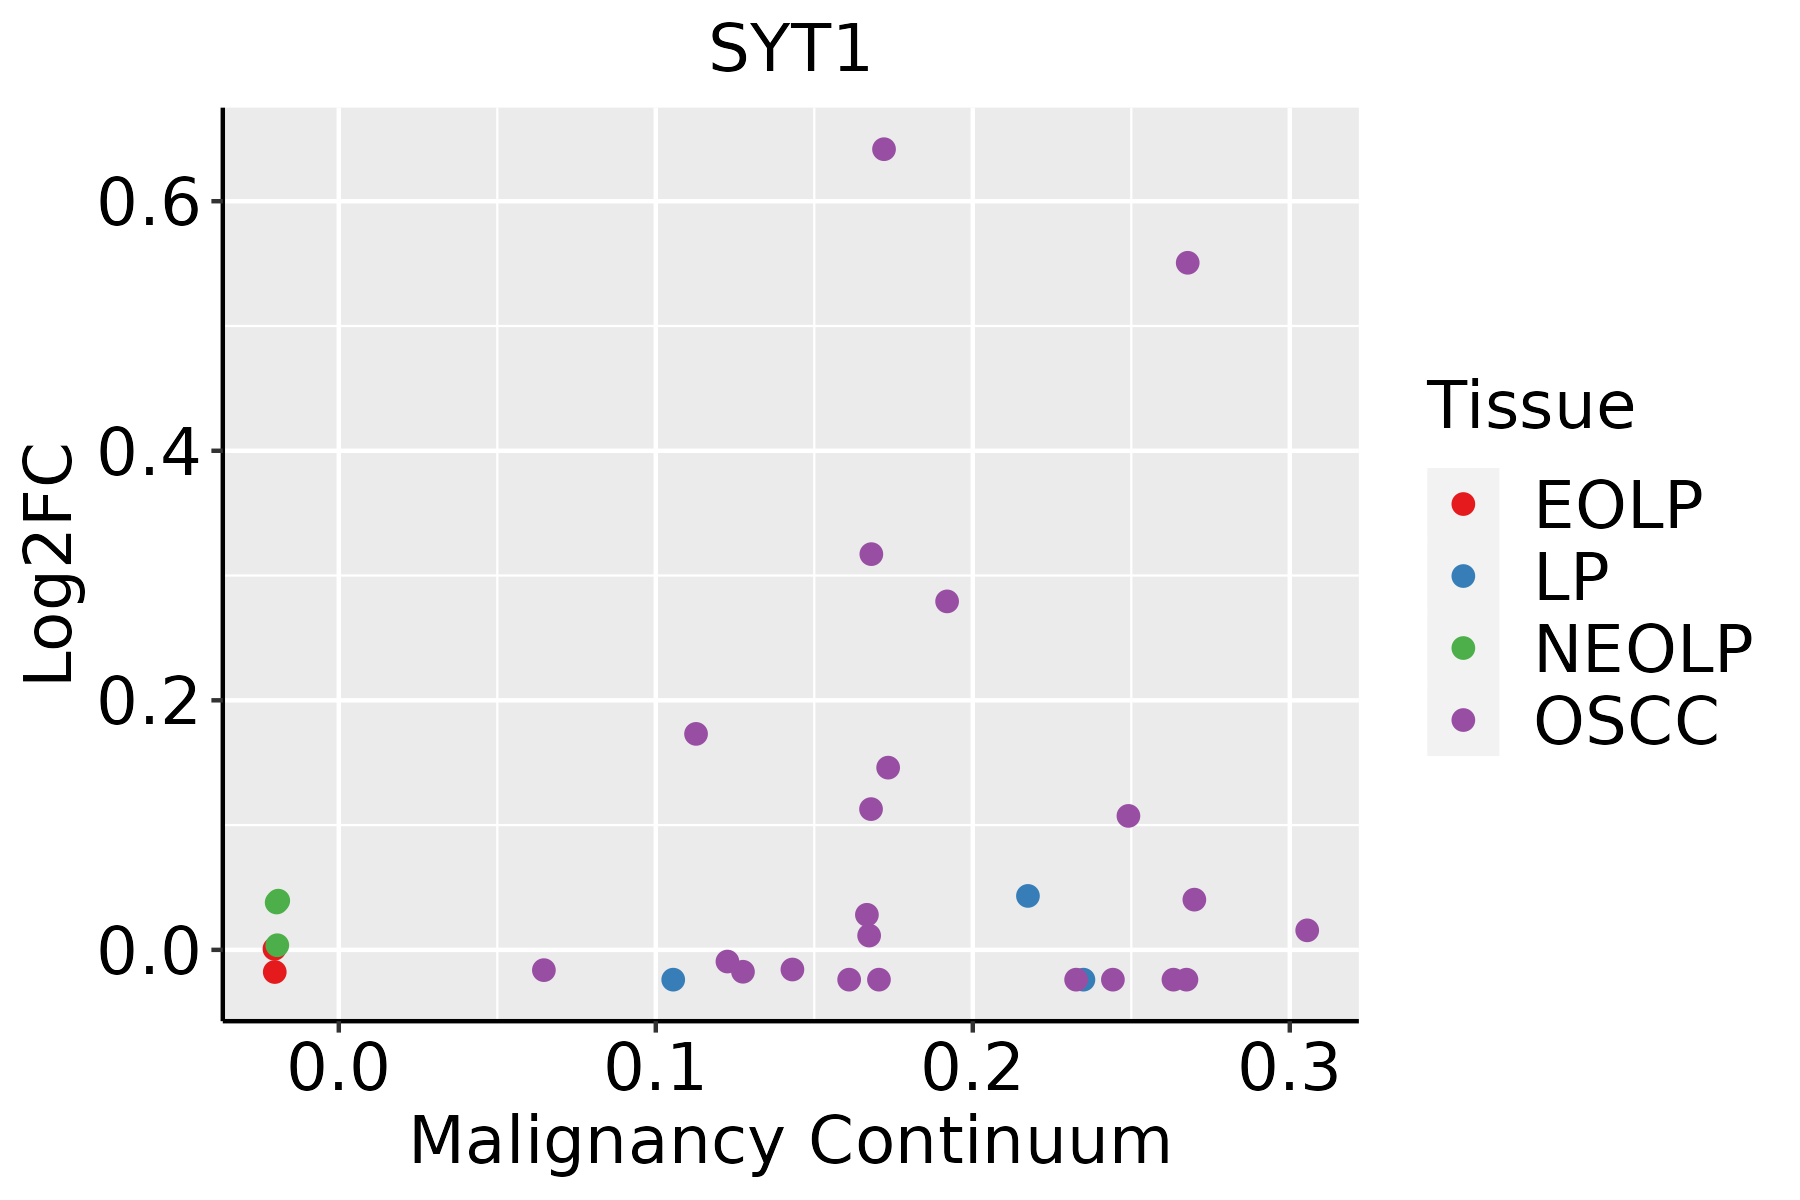 | EOLP: Erosive Oral lichen planus |
| LP: leukoplakia | ||
| NEOLP: Non-erosive oral lichen planus | ||
| OSCC: Oral squamous cell carcinoma | ||
| Thyroid | 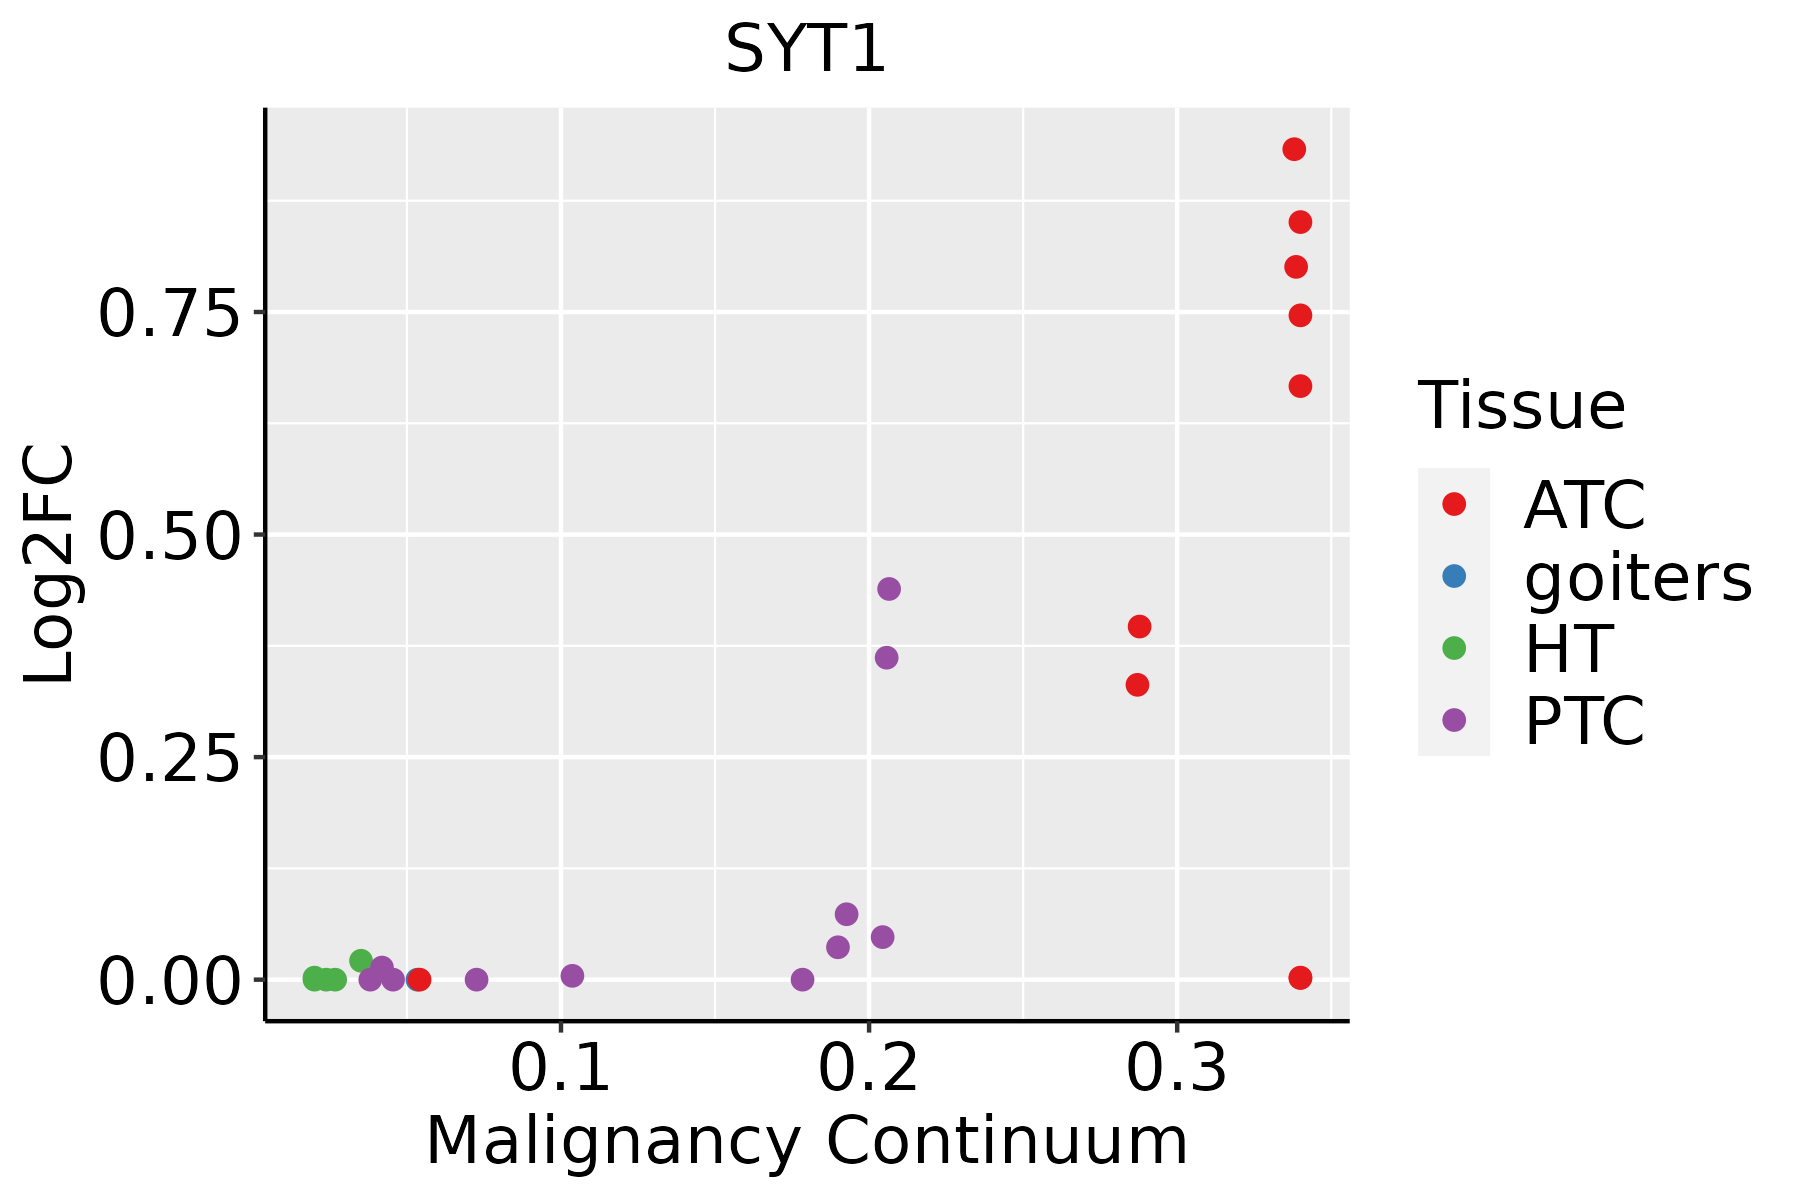 | ATC: Anaplastic thyroid cancer |
| HT: Hashimoto's thyroiditis | ||
| PTC: Papillary thyroid cancer |
| ∗log2FC in expression of this searched gene in stem-like cells from each diseased tissue sample relative to stem-like cells in normal samples in each tissue plotted against the malignancy continuum. Samples are colored based on if they are from different disease stage. |
Top |
Malignant transformation related pathway analysis |
| Find out the enriched GO biological processes and KEGG pathways involved in transition from healthy to precancer to cancer |
| Tissue | Disease Stage | Enriched GO biological Processes |
| Colorectum | AD |  |
| Colorectum | SER |  |
| Colorectum | MSS |  |
| Colorectum | MSI-H |  |
| Colorectum | FAP |  |
| ∗Top 15 enriched GO BP terms are showed in the bar plot of each disease state in each tissue. Each row represents a significant GO biological process which is colored according to the -log10(p.adjust). |
| Page: 1 2 3 4 5 6 7 8 9 |
| GO ID | Tissue | Disease Stage | Description | Gene Ratio | Bg Ratio | pvalue | p.adjust | Count |
| GO:005165617 | Esophagus | ESCC | establishment of organelle localization | 273/8552 | 390/18723 | 9.13e-23 | 1.81e-20 | 273 |
| GO:1903829111 | Esophagus | ESCC | positive regulation of cellular protein localization | 199/8552 | 276/18723 | 2.99e-19 | 3.45e-17 | 199 |
| GO:001605014 | Esophagus | ESCC | vesicle organization | 211/8552 | 300/18723 | 2.85e-18 | 2.87e-16 | 211 |
| GO:005165016 | Esophagus | ESCC | establishment of vesicle localization | 114/8552 | 161/18723 | 8.20e-11 | 2.53e-09 | 114 |
| GO:0016049110 | Esophagus | ESCC | cell growth | 289/8552 | 482/18723 | 1.29e-10 | 3.77e-09 | 289 |
| GO:000155819 | Esophagus | ESCC | regulation of cell growth | 248/8552 | 414/18723 | 2.97e-09 | 6.45e-08 | 248 |
| GO:005164815 | Esophagus | ESCC | vesicle localization | 119/8552 | 177/18723 | 5.16e-09 | 1.08e-07 | 119 |
| GO:000702914 | Esophagus | ESCC | endoplasmic reticulum organization | 65/8552 | 87/18723 | 3.28e-08 | 6.08e-07 | 65 |
| GO:003010018 | Esophagus | ESCC | regulation of endocytosis | 135/8552 | 211/18723 | 5.75e-08 | 1.02e-06 | 135 |
| GO:00482844 | Esophagus | ESCC | organelle fusion | 94/8552 | 141/18723 | 3.72e-07 | 5.16e-06 | 94 |
| GO:004206027 | Esophagus | ESCC | wound healing | 243/8552 | 422/18723 | 4.62e-07 | 6.25e-06 | 243 |
| GO:00224069 | Esophagus | ESCC | membrane docking | 62/8552 | 86/18723 | 5.93e-07 | 7.79e-06 | 62 |
| GO:00028318 | Esophagus | ESCC | regulation of response to biotic stimulus | 191/8552 | 327/18723 | 2.12e-06 | 2.45e-05 | 191 |
| GO:002260420 | Esophagus | ESCC | regulation of cell morphogenesis | 180/8552 | 309/18723 | 5.19e-06 | 5.45e-05 | 180 |
| GO:00901743 | Esophagus | ESCC | organelle membrane fusion | 73/8552 | 110/18723 | 9.29e-06 | 8.88e-05 | 73 |
| GO:00069063 | Esophagus | ESCC | vesicle fusion | 70/8552 | 106/18723 | 1.82e-05 | 1.60e-04 | 70 |
| GO:01400567 | Esophagus | ESCC | organelle localization by membrane tethering | 53/8552 | 77/18723 | 3.33e-05 | 2.74e-04 | 53 |
| GO:001003827 | Esophagus | ESCC | response to metal ion | 208/8552 | 373/18723 | 5.02e-05 | 3.90e-04 | 208 |
| GO:000689818 | Esophagus | ESCC | receptor-mediated endocytosis | 142/8552 | 244/18723 | 5.22e-05 | 4.05e-04 | 142 |
| GO:003030710 | Esophagus | ESCC | positive regulation of cell growth | 100/8552 | 166/18723 | 1.07e-04 | 7.55e-04 | 100 |
| Page: 1 2 3 4 5 6 7 8 |
| Pathway ID | Tissue | Disease Stage | Description | Gene Ratio | Bg Ratio | pvalue | p.adjust | qvalue | Count |
| Page: 1 |
Top |
Cell-cell communication analysis |
| Identification of potential cell-cell interactions between two cell types and their ligand-receptor pairs for different disease states |
| Ligand | Receptor | LRpair | Pathway | Tissue | Disease Stage |
| Page: 1 |
Top |
Single-cell gene regulatory network inference analysis |
| Find out the significant the regulons (TFs) and the target genes of each regulon across cell types for different disease states |
| TF | Cell Type | Tissue | Disease Stage | Target Gene | RSS | Regulon Activity |
| ∗The dot plots of a searched regulon are shown for all cell subpopulations in each disease state of each tissue based on the regulon specific score inferred using pySCENIC and by calculating the average expression. |
| Page: 1 |
Top |
Somatic mutation of malignant transformation related genes |
| Annotation of somatic variants for genes involved in malignant transformation |
| Hugo Symbol | Variant Class | Variant Classification | dbSNP RS | HGVSc | HGVSp | HGVSp Short | SWISSPROT | BIOTYPE | SIFT | PolyPhen | Tumor Sample Barcode | Tissue | Histology | Sex | Age | Stage | Therapy Types | Drugs | Outcome |
| SYT1 | SNV | Missense_Mutation | c.457N>T | p.Asp153Tyr | p.D153Y | P21579 | protein_coding | deleterious(0) | probably_damaging(0.968) | TCGA-AC-A23H-01 | Breast | breast invasive carcinoma | Female | >=65 | I/II | Unknown | Unknown | PD | |
| SYT1 | deletion | In_Frame_Del | c.545_556delNNNNNNNNNNNN | p.Lys183_Leu186del | p.K183_L186del | P21579 | protein_coding | TCGA-A7-A0DA-01 | Breast | breast invasive carcinoma | Female | <65 | I/II | Chemotherapy | adriamycin | SD | |||
| SYT1 | insertion | Frame_Shift_Ins | novel | c.497_498insAGGGTCTTACACCTATGTT | p.Ala167GlyfsTer19 | p.A167Gfs*19 | P21579 | protein_coding | TCGA-C8-A132-01 | Breast | breast invasive carcinoma | Female | <65 | I/II | Unknown | Unknown | SD | ||
| SYT1 | deletion | Frame_Shift_Del | c.292delN | p.Lys99ArgfsTer6 | p.K99Rfs*6 | P21579 | protein_coding | TCGA-D8-A1XT-01 | Breast | breast invasive carcinoma | Female | <65 | I/II | Chemotherapy | adriamycin+cyclophosphamide | SD | |||
| SYT1 | SNV | Missense_Mutation | c.883N>A | p.Leu295Met | p.L295M | P21579 | protein_coding | tolerated(0.07) | possibly_damaging(0.493) | TCGA-C5-A1BK-01 | Cervix | cervical & endocervical cancer | Female | <65 | I/II | Unknown | Unknown | SD | |
| SYT1 | SNV | Missense_Mutation | novel | c.367N>A | p.Asp123Asn | p.D123N | P21579 | protein_coding | tolerated(0.45) | possibly_damaging(0.552) | TCGA-C5-A2LZ-01 | Cervix | cervical & endocervical cancer | Female | >=65 | III/IV | Unknown | Unknown | PD |
| SYT1 | SNV | Missense_Mutation | c.569N>C | p.Lys190Thr | p.K190T | P21579 | protein_coding | deleterious(0.04) | probably_damaging(0.977) | TCGA-AA-3510-01 | Colorectum | colon adenocarcinoma | Male | >=65 | I/II | Unknown | Unknown | SD | |
| SYT1 | SNV | Missense_Mutation | c.544N>A | p.Val182Met | p.V182M | P21579 | protein_coding | deleterious(0) | probably_damaging(0.999) | TCGA-AA-3697-01 | Colorectum | colon adenocarcinoma | Male | >=65 | I/II | Unknown | Unknown | SD | |
| SYT1 | SNV | Missense_Mutation | c.173N>T | p.Pro58Leu | p.P58L | P21579 | protein_coding | tolerated(0.12) | benign(0.003) | TCGA-AD-A5EJ-01 | Colorectum | colon adenocarcinoma | Female | >=65 | I/II | Unknown | Unknown | SD | |
| SYT1 | SNV | Missense_Mutation | novel | c.607N>A | p.Leu203Ile | p.L203I | P21579 | protein_coding | deleterious(0.03) | probably_damaging(0.939) | TCGA-CA-6717-01 | Colorectum | colon adenocarcinoma | Male | <65 | I/II | Chemotherapy | oxaliplatin | CR |
| Page: 1 2 3 4 5 6 |
Top |
Related drugs of malignant transformation related genes |
| Identification of chemicals and drugs interact with genes involved in malignant transfromation |
| (DGIdb 4.0) |
| Entrez ID | Symbol | Category | Interaction Types | Drug Claim Name | Drug Name | PMIDs |
| 6857 | SYT1 | KINASE, TRANSPORTER | cocaine | COCAINE | 31059723 |
| Page: 1 |

Copyright 2023-Present -The University of Texas Health Science Center at Houston |