
|
|||||
|
 | |
| |
| |
| |
| |
| |
|
Gene: SYPL1 |
Gene summary for SYPL1 |
| Gene information | Species | Human | Gene symbol | SYPL1 | Gene ID | 6856 |
| Gene name | synaptophysin like 1 | |
| Gene Alias | H-SP1 | |
| Cytomap | 7q22.3 | |
| Gene Type | protein-coding | GO ID | GO:0007154 | UniProtAcc | A4D0R1 |
Top |
Malignant transformation analysis |
| Identification of the aberrant gene expression in precancerous and cancerous lesions by comparing the gene expression of stem-like cells in diseased tissues with normal stem cells |
| Entrez ID | Symbol | Replicates | Species | Organ | Tissue | Adj P-value | Log2FC | Malignancy |
| 6856 | SYPL1 | GSM4909293 | Human | Breast | IDC | 1.32e-03 | 2.61e-01 | 0.1581 |
| 6856 | SYPL1 | GSM4909294 | Human | Breast | IDC | 2.77e-04 | -8.03e-03 | 0.2022 |
| 6856 | SYPL1 | GSM4909296 | Human | Breast | IDC | 8.01e-17 | -2.44e-01 | 0.1524 |
| 6856 | SYPL1 | GSM4909297 | Human | Breast | IDC | 1.35e-14 | -4.73e-02 | 0.1517 |
| 6856 | SYPL1 | GSM4909301 | Human | Breast | IDC | 1.18e-07 | -2.87e-01 | 0.1577 |
| 6856 | SYPL1 | GSM4909308 | Human | Breast | IDC | 6.07e-18 | 5.34e-01 | 0.158 |
| 6856 | SYPL1 | GSM4909309 | Human | Breast | IDC | 4.41e-03 | -1.76e-01 | 0.0483 |
| 6856 | SYPL1 | GSM4909311 | Human | Breast | IDC | 5.38e-34 | -3.19e-01 | 0.1534 |
| 6856 | SYPL1 | GSM4909312 | Human | Breast | IDC | 1.60e-13 | 1.47e-02 | 0.1552 |
| 6856 | SYPL1 | GSM4909313 | Human | Breast | IDC | 3.06e-04 | 1.40e-01 | 0.0391 |
| 6856 | SYPL1 | GSM4909315 | Human | Breast | IDC | 1.47e-62 | 8.34e-01 | 0.21 |
| 6856 | SYPL1 | GSM4909316 | Human | Breast | IDC | 1.86e-28 | 8.49e-01 | 0.21 |
| 6856 | SYPL1 | GSM4909319 | Human | Breast | IDC | 7.76e-39 | -4.30e-01 | 0.1563 |
| 6856 | SYPL1 | GSM4909320 | Human | Breast | IDC | 1.13e-08 | -5.15e-01 | 0.1575 |
| 6856 | SYPL1 | GSM4909321 | Human | Breast | IDC | 1.06e-21 | -3.53e-01 | 0.1559 |
| 6856 | SYPL1 | brca1 | Human | Breast | Precancer | 9.43e-09 | 3.59e-01 | -0.0338 |
| 6856 | SYPL1 | brca2 | Human | Breast | Precancer | 1.57e-05 | 2.56e-01 | -0.024 |
| 6856 | SYPL1 | brca3 | Human | Breast | Precancer | 1.52e-07 | 3.72e-01 | -0.0263 |
| 6856 | SYPL1 | M2 | Human | Breast | IDC | 6.45e-03 | -2.53e-01 | 0.21 |
| 6856 | SYPL1 | NCCBC14 | Human | Breast | DCIS | 7.23e-13 | -2.52e-01 | 0.2021 |
| Page: 1 2 3 4 5 6 7 8 9 |
| Tissue | Expression Dynamics | Abbreviation |
| Breast | 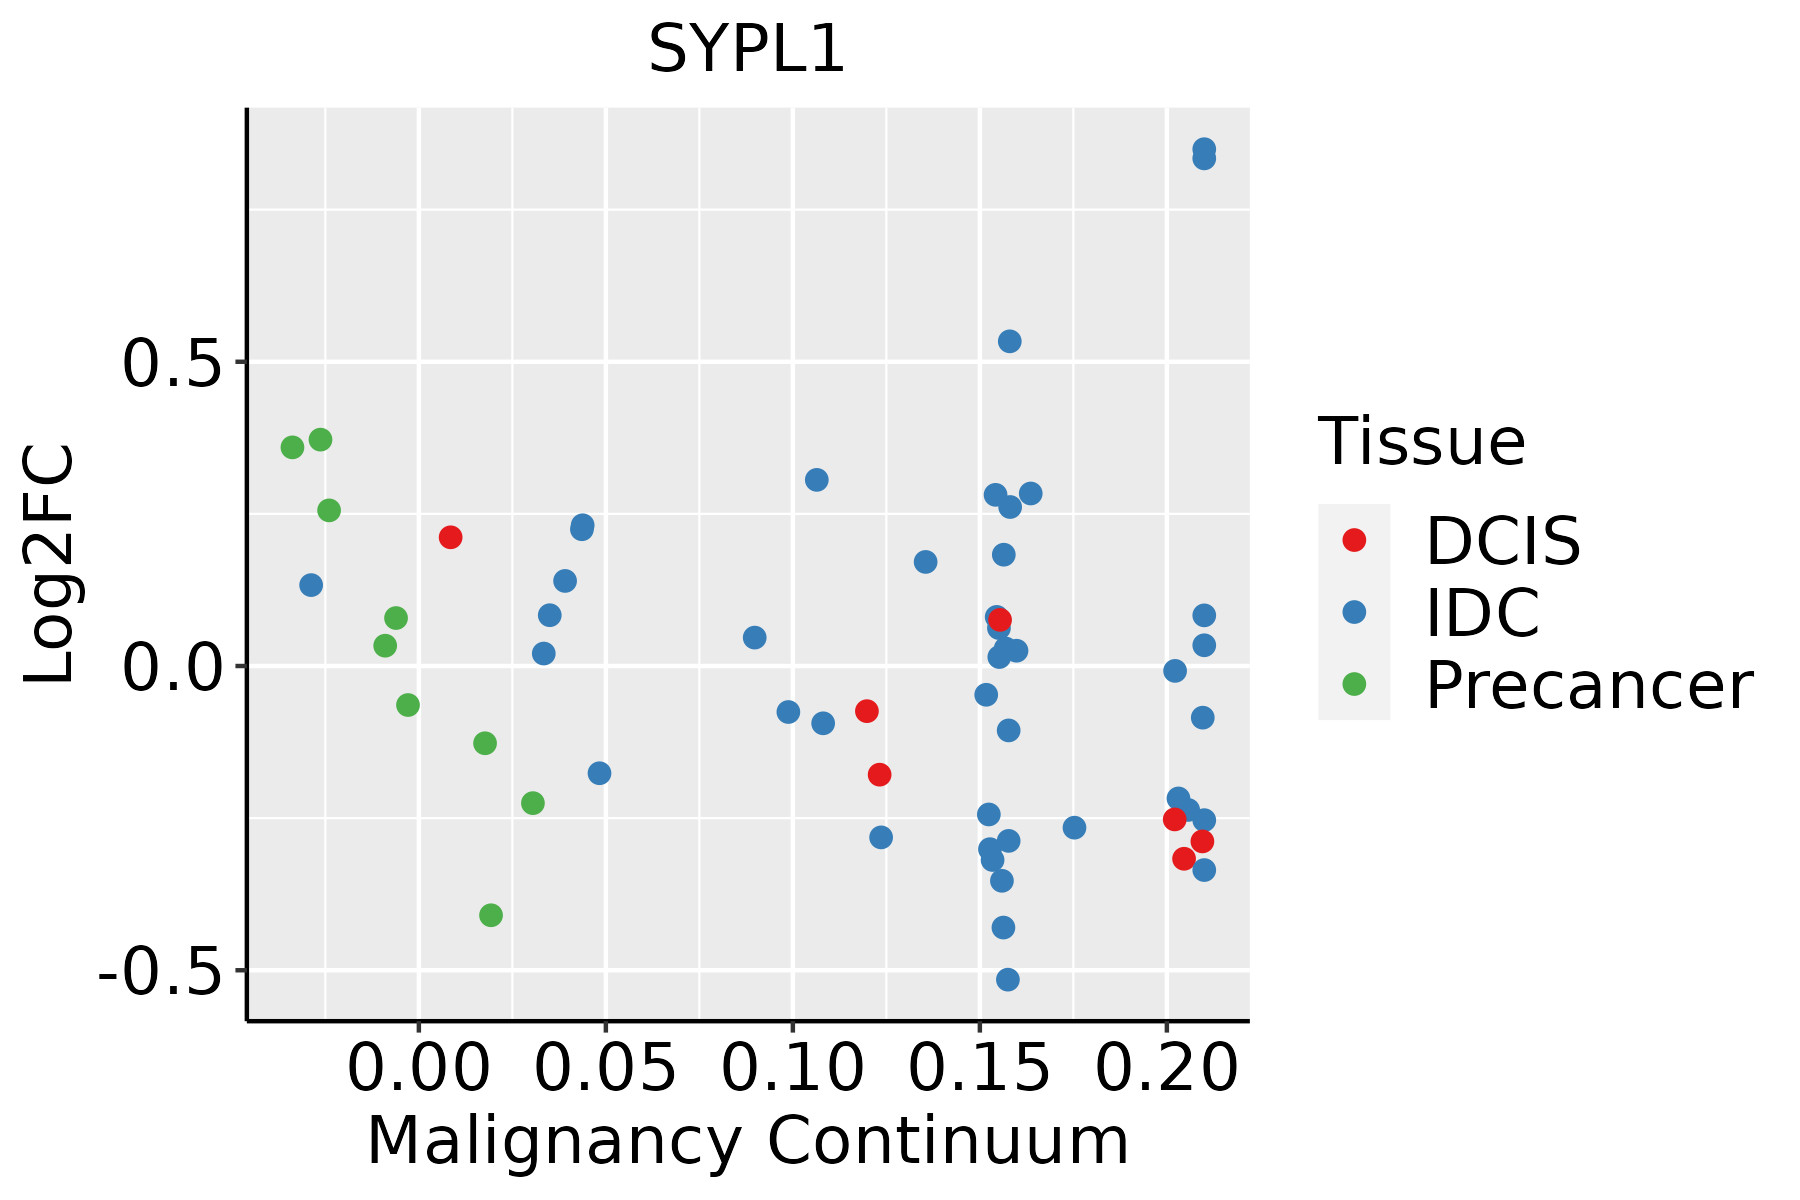 | IDC: Invasive ductal carcinoma |
| DCIS: Ductal carcinoma in situ | ||
| Precancer(BRCA1-mut): Precancerous lesion from BRCA1 mutation carriers | ||
| Cervix | 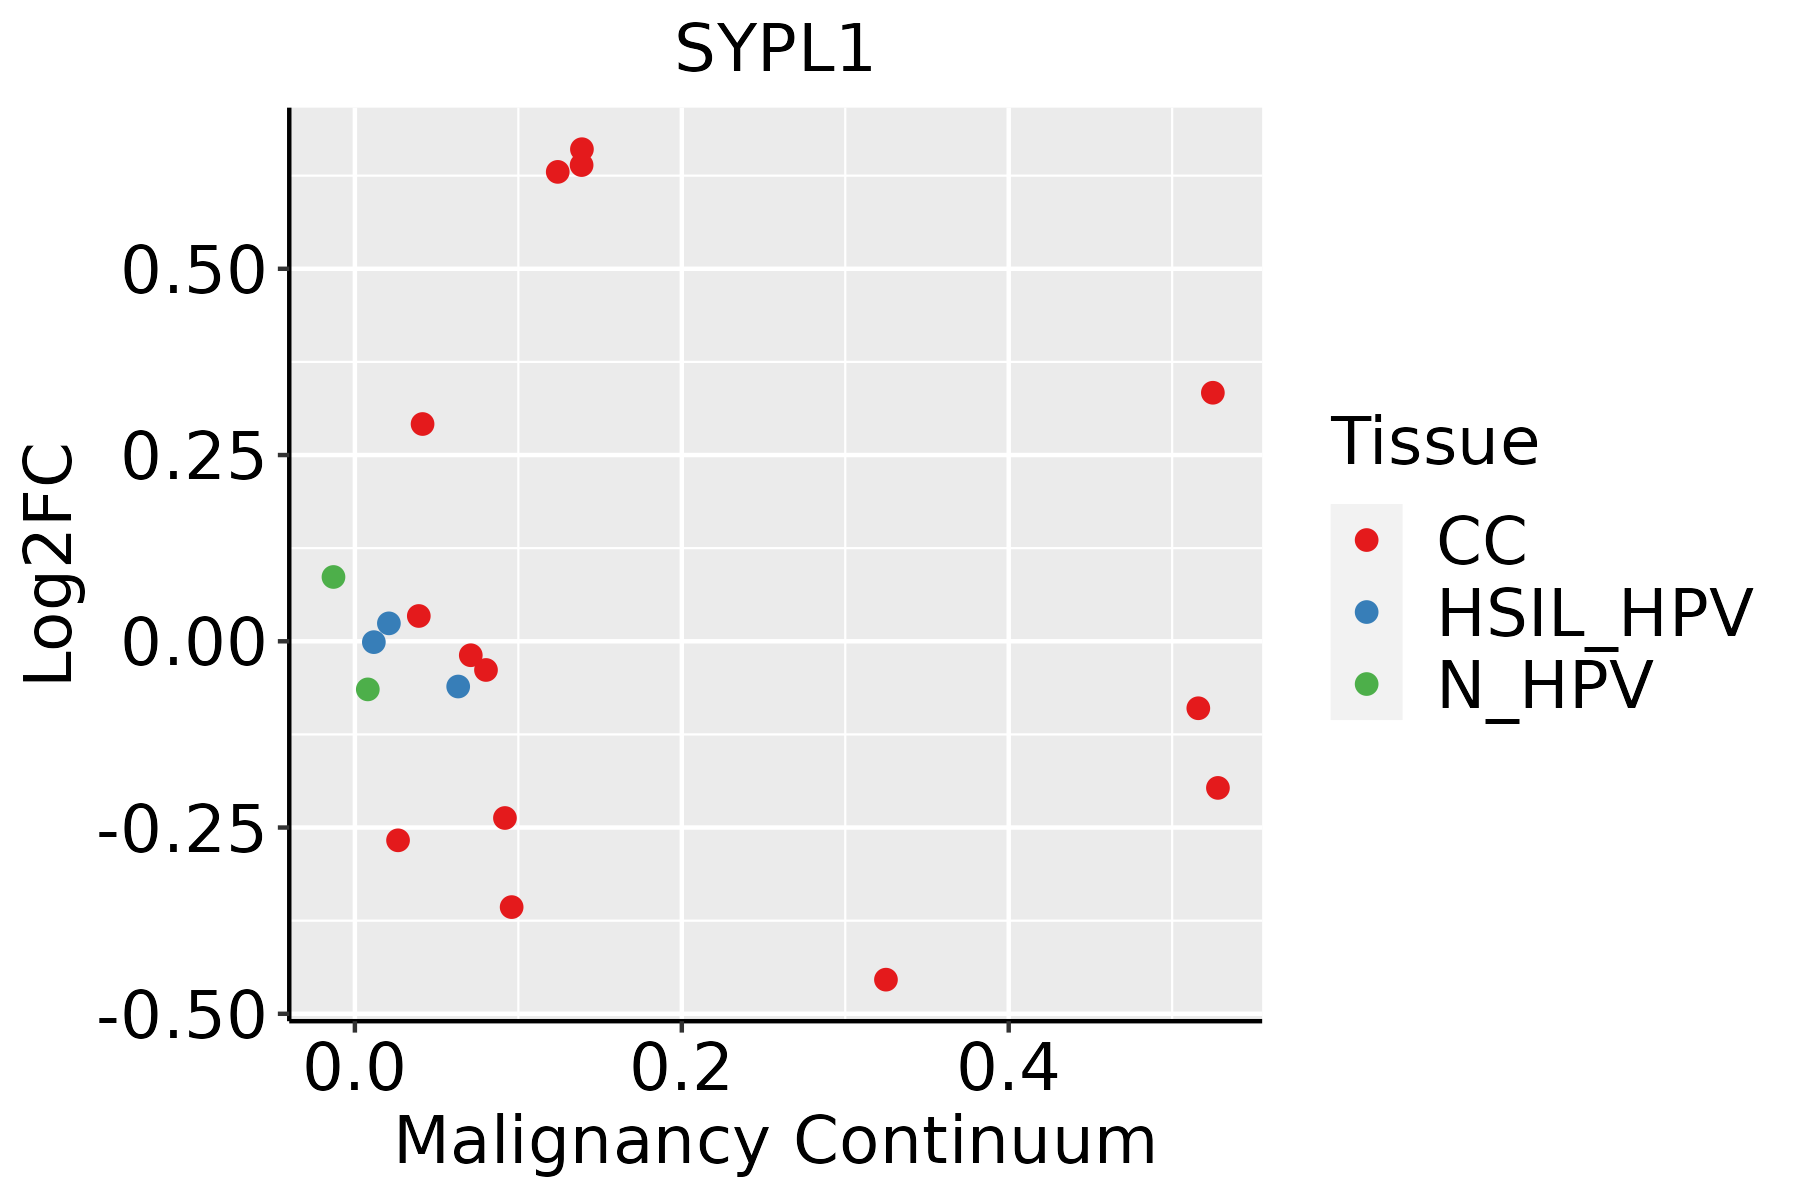 | CC: Cervix cancer |
| HSIL_HPV: HPV-infected high-grade squamous intraepithelial lesions | ||
| N_HPV: HPV-infected normal cervix | ||
| Colorectum (GSE201348) |  | FAP: Familial adenomatous polyposis |
| CRC: Colorectal cancer | ||
| Colorectum (HTA11) |  | AD: Adenomas |
| SER: Sessile serrated lesions | ||
| MSI-H: Microsatellite-high colorectal cancer | ||
| MSS: Microsatellite stable colorectal cancer | ||
| Esophagus |  | ESCC: Esophageal squamous cell carcinoma |
| HGIN: High-grade intraepithelial neoplasias | ||
| LGIN: Low-grade intraepithelial neoplasias | ||
| Liver |  | HCC: Hepatocellular carcinoma |
| NAFLD: Non-alcoholic fatty liver disease | ||
| Oral Cavity | 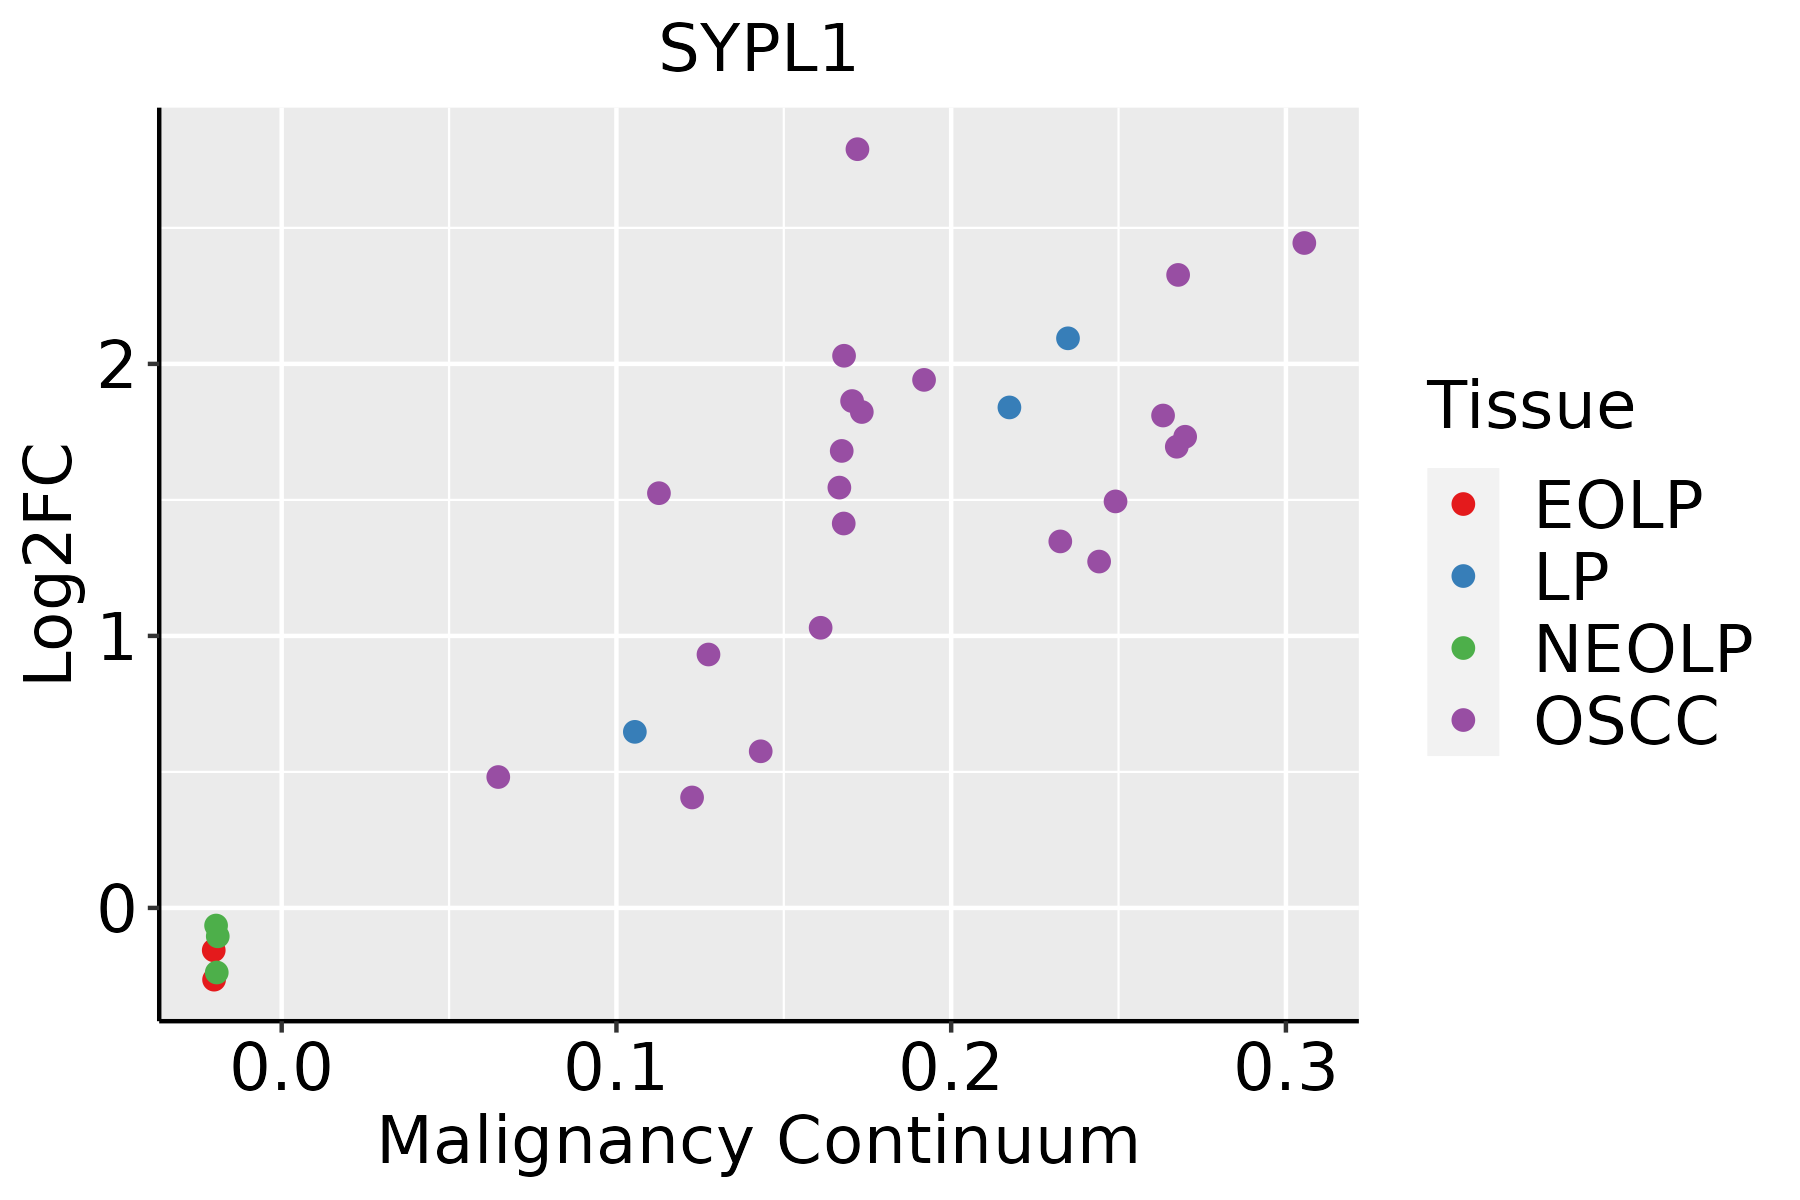 | EOLP: Erosive Oral lichen planus |
| LP: leukoplakia | ||
| NEOLP: Non-erosive oral lichen planus | ||
| OSCC: Oral squamous cell carcinoma | ||
| Prostate | 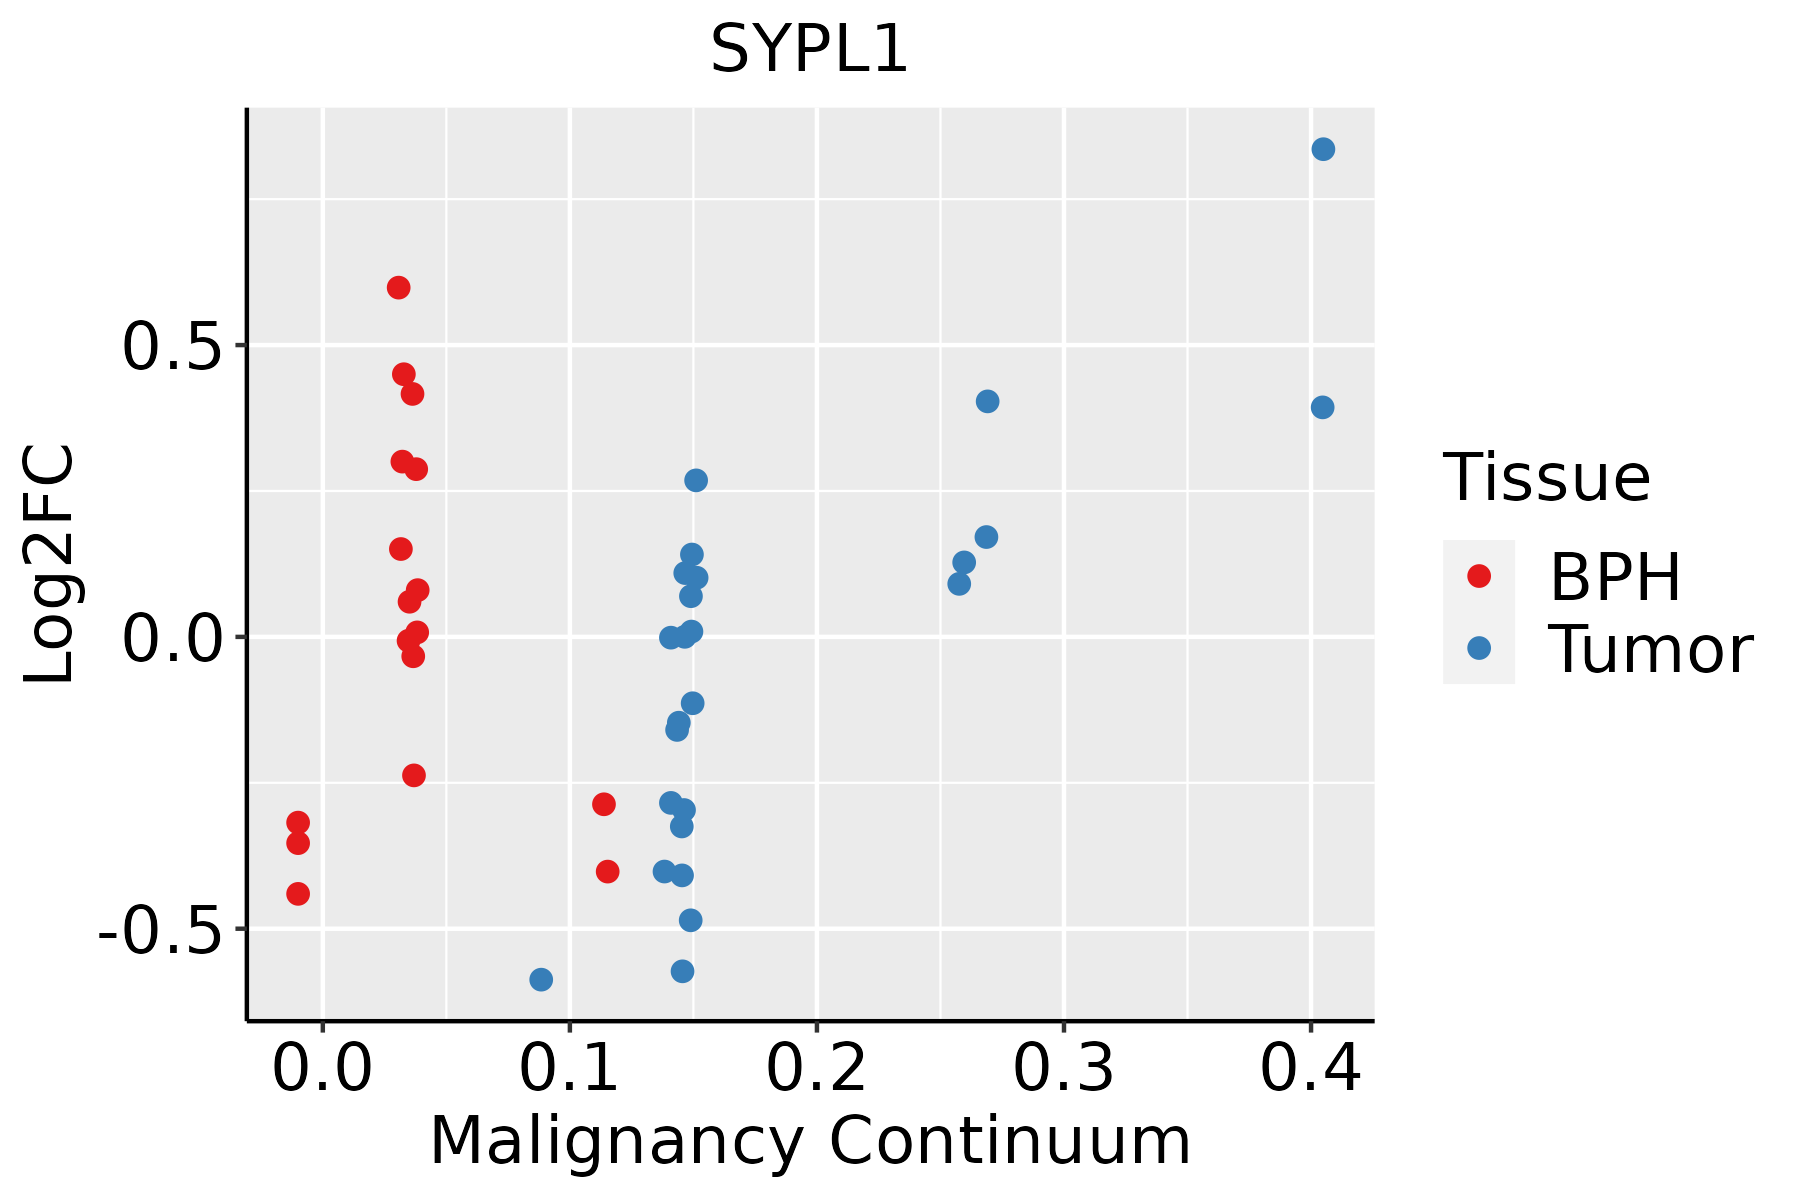 | BPH: Benign Prostatic Hyperplasia |
| Skin |  | AK: Actinic keratosis |
| cSCC: Cutaneous squamous cell carcinoma | ||
| SCCIS:squamous cell carcinoma in situ | ||
| Thyroid | 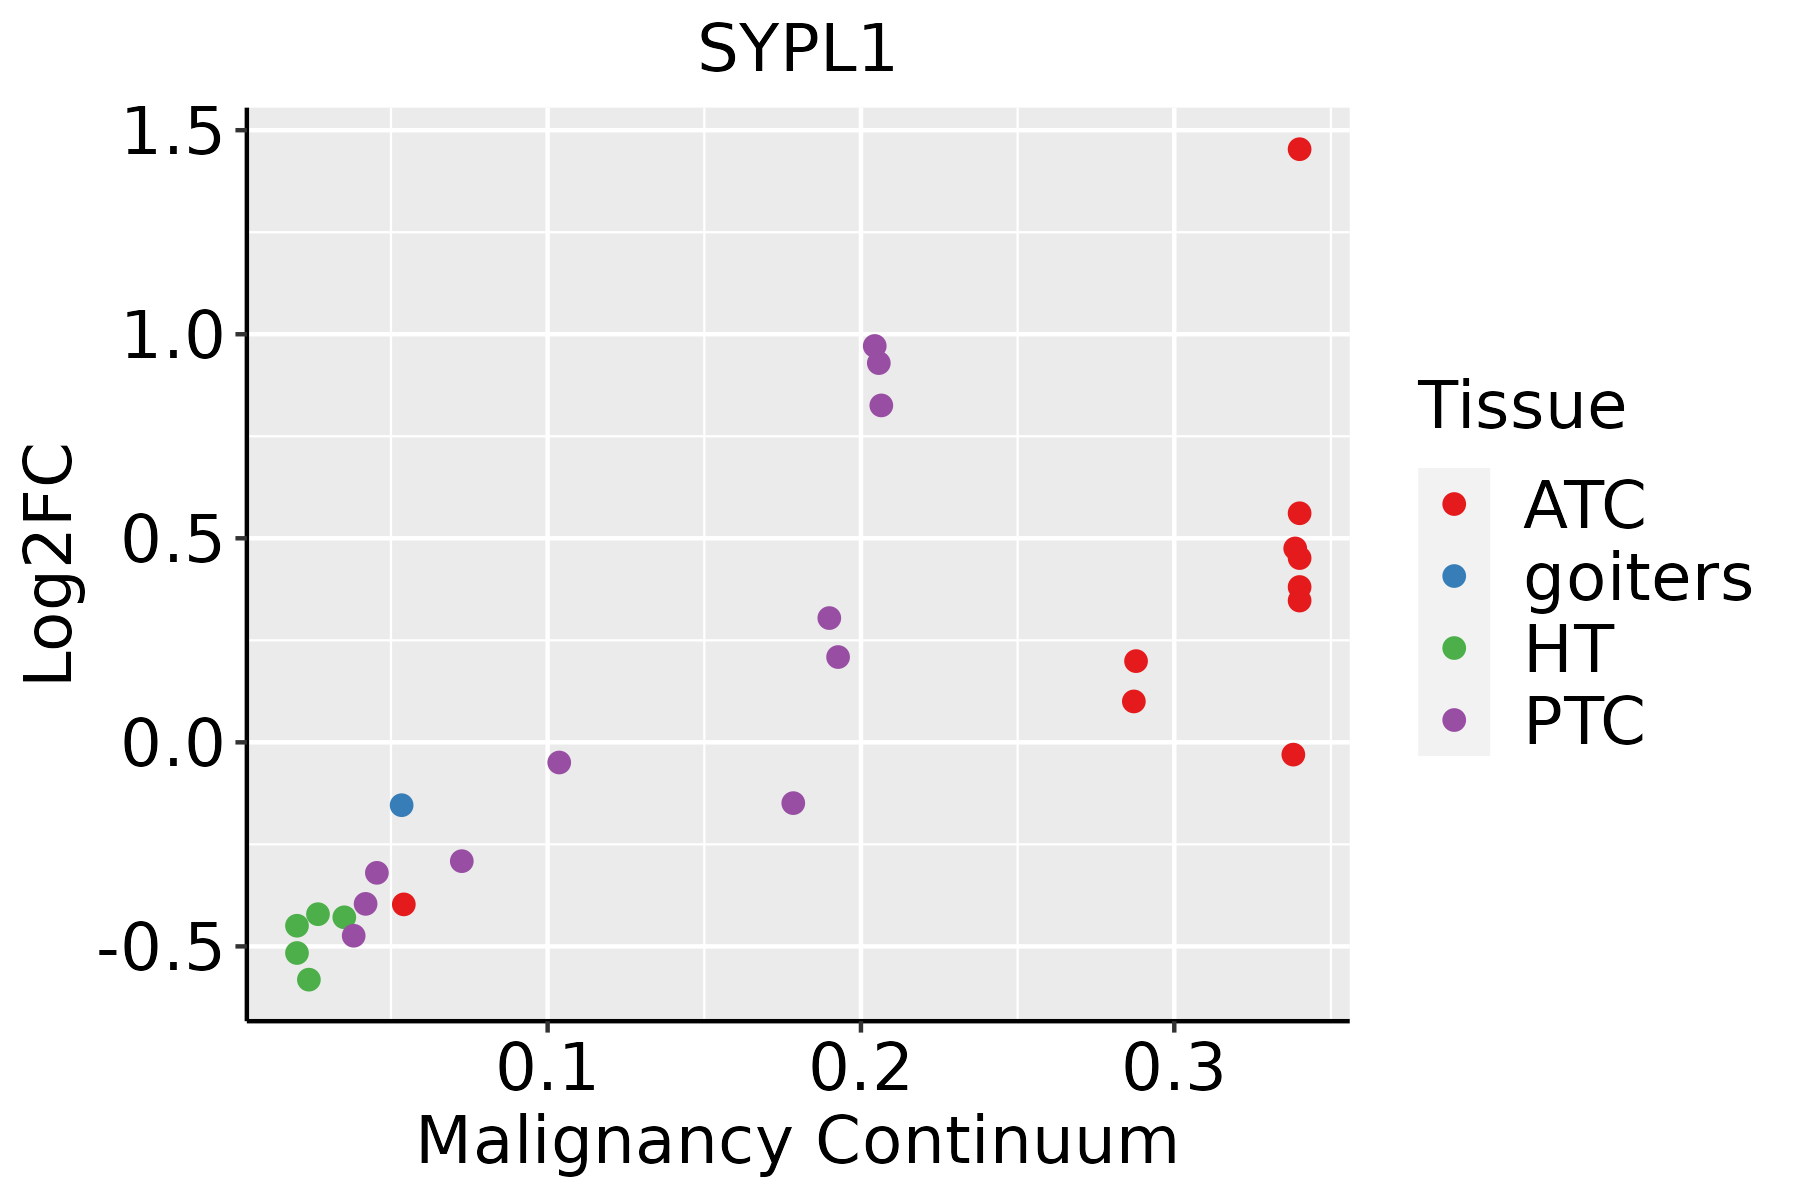 | ATC: Anaplastic thyroid cancer |
| HT: Hashimoto's thyroiditis | ||
| PTC: Papillary thyroid cancer |
| ∗log2FC in expression of this searched gene in stem-like cells from each diseased tissue sample relative to stem-like cells in normal samples in each tissue plotted against the malignancy continuum. Samples are colored based on if they are from different disease stage. |
Top |
Malignant transformation related pathway analysis |
| Find out the enriched GO biological processes and KEGG pathways involved in transition from healthy to precancer to cancer |
| Tissue | Disease Stage | Enriched GO biological Processes |
| Colorectum | AD |  |
| Colorectum | SER |  |
| Colorectum | MSS |  |
| Colorectum | MSI-H |  |
| Colorectum | FAP |  |
| ∗Top 15 enriched GO BP terms are showed in the bar plot of each disease state in each tissue. Each row represents a significant GO biological process which is colored according to the -log10(p.adjust). |
| Page: 1 2 3 4 5 6 7 8 9 |
| GO ID | Tissue | Disease Stage | Description | Gene Ratio | Bg Ratio | pvalue | p.adjust | Count |
| Page: 1 |
| Pathway ID | Tissue | Disease Stage | Description | Gene Ratio | Bg Ratio | pvalue | p.adjust | qvalue | Count |
| Page: 1 |
Top |
Cell-cell communication analysis |
| Identification of potential cell-cell interactions between two cell types and their ligand-receptor pairs for different disease states |
| Ligand | Receptor | LRpair | Pathway | Tissue | Disease Stage |
| Page: 1 |
Top |
Single-cell gene regulatory network inference analysis |
| Find out the significant the regulons (TFs) and the target genes of each regulon across cell types for different disease states |
| TF | Cell Type | Tissue | Disease Stage | Target Gene | RSS | Regulon Activity |
| ∗The dot plots of a searched regulon are shown for all cell subpopulations in each disease state of each tissue based on the regulon specific score inferred using pySCENIC and by calculating the average expression. |
| Page: 1 |
Top |
Somatic mutation of malignant transformation related genes |
| Annotation of somatic variants for genes involved in malignant transformation |
| Hugo Symbol | Variant Class | Variant Classification | dbSNP RS | HGVSc | HGVSp | HGVSp Short | SWISSPROT | BIOTYPE | SIFT | PolyPhen | Tumor Sample Barcode | Tissue | Histology | Sex | Age | Stage | Therapy Types | Drugs | Outcome |
| SYPL1 | SNV | Missense_Mutation | novel | c.229N>G | p.Thr77Ala | p.T77A | Q16563 | protein_coding | tolerated(1) | benign(0) | TCGA-LL-A8F5-01 | Breast | breast invasive carcinoma | Female | <65 | I/II | Chemotherapy | cyclophosphamide | SD |
| SYPL1 | SNV | Missense_Mutation | c.175N>A | p.Glu59Lys | p.E59K | Q16563 | protein_coding | tolerated(0.48) | benign(0.348) | TCGA-IR-A3LK-01 | Cervix | cervical & endocervical cancer | Female | >=65 | I/II | Chemotherapy | cisplatin | PD | |
| SYPL1 | SNV | Missense_Mutation | rs778412371 | c.29A>G | p.Gln10Arg | p.Q10R | Q16563 | protein_coding | tolerated_low_confidence(0.72) | possibly_damaging(0.901) | TCGA-ZJ-A8QR-01 | Cervix | cervical & endocervical cancer | Female | <65 | I/II | Unknown | Unknown | SD |
| SYPL1 | SNV | Missense_Mutation | novel | c.395N>T | p.Ala132Val | p.A132V | Q16563 | protein_coding | deleterious(0) | possibly_damaging(0.894) | TCGA-AA-3980-01 | Colorectum | colon adenocarcinoma | Female | >=65 | I/II | Unknown | Unknown | SD |
| SYPL1 | SNV | Missense_Mutation | c.625N>A | p.Gly209Arg | p.G209R | Q16563 | protein_coding | deleterious(0.04) | possibly_damaging(0.9) | TCGA-AA-A02J-01 | Colorectum | colon adenocarcinoma | Female | >=65 | III/IV | Unknown | Unknown | PD | |
| SYPL1 | SNV | Missense_Mutation | rs749256877 | c.440G>A | p.Arg147His | p.R147H | Q16563 | protein_coding | tolerated(0.15) | benign(0.005) | TCGA-AD-6964-01 | Colorectum | colon adenocarcinoma | Male | <65 | III/IV | Chemotherapy | folfox | PD |
| SYPL1 | SNV | Missense_Mutation | c.734C>A | p.Ser245Tyr | p.S245Y | Q16563 | protein_coding | tolerated(0.1) | possibly_damaging(0.564) | TCGA-A5-A0G2-01 | Endometrium | uterine corpus endometrioid carcinoma | Female | <65 | III/IV | Unknown | Unknown | SD | |
| SYPL1 | SNV | Missense_Mutation | novel | c.185N>C | p.Val62Ala | p.V62A | Q16563 | protein_coding | deleterious(0) | probably_damaging(0.952) | TCGA-B5-A3FA-01 | Endometrium | uterine corpus endometrioid carcinoma | Female | >=65 | I/II | Unknown | Unknown | SD |
| SYPL1 | SNV | Missense_Mutation | rs148959470 | c.316N>A | p.Val106Ile | p.V106I | Q16563 | protein_coding | tolerated(0.29) | benign(0.386) | TCGA-BG-A0VT-01 | Endometrium | uterine corpus endometrioid carcinoma | Female | <65 | III/IV | Chemotherapy | carboplatin | CR |
| SYPL1 | SNV | Missense_Mutation | c.538N>C | p.Ile180Leu | p.I180L | Q16563 | protein_coding | tolerated(0.31) | benign(0.055) | TCGA-BS-A0UF-01 | Endometrium | uterine corpus endometrioid carcinoma | Female | >=65 | I/II | Unknown | Unknown | SD |
| Page: 1 2 3 |
Top |
Related drugs of malignant transformation related genes |
| Identification of chemicals and drugs interact with genes involved in malignant transfromation |
| (DGIdb 4.0) |
| Entrez ID | Symbol | Category | Interaction Types | Drug Claim Name | Drug Name | PMIDs |
| Page: 1 |

Copyright 2023-Present -The University of Texas Health Science Center at Houston |