
|
|||||
|
 | |
| |
| |
| |
| |
| |
|
Gene: SYNRG |
Gene summary for SYNRG |
| Gene information | Species | Human | Gene symbol | SYNRG | Gene ID | 11276 |
| Gene name | synergin gamma | |
| Gene Alias | AP1GBP1 | |
| Cytomap | 17q12 | |
| Gene Type | protein-coding | GO ID | GO:0006810 | UniProtAcc | Q9UMZ2 |
Top |
Malignant transformation analysis |
| Identification of the aberrant gene expression in precancerous and cancerous lesions by comparing the gene expression of stem-like cells in diseased tissues with normal stem cells |
| Entrez ID | Symbol | Replicates | Species | Organ | Tissue | Adj P-value | Log2FC | Malignancy |
| 11276 | SYNRG | GSM4909292 | Human | Breast | IDC | 4.09e-02 | 5.21e-01 | 0.1236 |
| 11276 | SYNRG | GSM4909317 | Human | Breast | IDC | 1.47e-02 | 2.41e-01 | 0.1355 |
| 11276 | SYNRG | GSM4909319 | Human | Breast | IDC | 2.19e-02 | -9.67e-03 | 0.1563 |
| 11276 | SYNRG | NCCBC14 | Human | Breast | DCIS | 2.20e-15 | 6.87e-01 | 0.2021 |
| 11276 | SYNRG | DCIS2 | Human | Breast | DCIS | 5.65e-38 | 1.94e-01 | 0.0085 |
| 11276 | SYNRG | LZE4T | Human | Esophagus | ESCC | 8.93e-07 | 3.20e-01 | 0.0811 |
| 11276 | SYNRG | LZE7T | Human | Esophagus | ESCC | 5.05e-13 | 6.08e-01 | 0.0667 |
| 11276 | SYNRG | LZE8T | Human | Esophagus | ESCC | 4.99e-04 | 1.92e-01 | 0.067 |
| 11276 | SYNRG | LZE20T | Human | Esophagus | ESCC | 4.68e-07 | 1.99e-01 | 0.0662 |
| 11276 | SYNRG | LZE22T | Human | Esophagus | ESCC | 3.55e-02 | 2.28e-01 | 0.068 |
| 11276 | SYNRG | LZE24T | Human | Esophagus | ESCC | 2.26e-19 | 5.41e-01 | 0.0596 |
| 11276 | SYNRG | LZE21T | Human | Esophagus | ESCC | 8.21e-05 | 2.92e-01 | 0.0655 |
| 11276 | SYNRG | P1T-E | Human | Esophagus | ESCC | 1.20e-12 | 4.89e-01 | 0.0875 |
| 11276 | SYNRG | P2T-E | Human | Esophagus | ESCC | 4.19e-30 | 3.86e-01 | 0.1177 |
| 11276 | SYNRG | P4T-E | Human | Esophagus | ESCC | 1.23e-16 | 3.91e-01 | 0.1323 |
| 11276 | SYNRG | P5T-E | Human | Esophagus | ESCC | 2.53e-14 | 1.94e-01 | 0.1327 |
| 11276 | SYNRG | P8T-E | Human | Esophagus | ESCC | 2.29e-22 | 3.75e-01 | 0.0889 |
| 11276 | SYNRG | P9T-E | Human | Esophagus | ESCC | 2.65e-10 | 1.82e-01 | 0.1131 |
| 11276 | SYNRG | P10T-E | Human | Esophagus | ESCC | 1.96e-13 | 2.08e-01 | 0.116 |
| 11276 | SYNRG | P11T-E | Human | Esophagus | ESCC | 3.50e-14 | 4.98e-01 | 0.1426 |
| Page: 1 2 3 4 5 6 |
| Tissue | Expression Dynamics | Abbreviation |
| Breast |  | IDC: Invasive ductal carcinoma |
| DCIS: Ductal carcinoma in situ | ||
| Precancer(BRCA1-mut): Precancerous lesion from BRCA1 mutation carriers | ||
| Esophagus |  | ESCC: Esophageal squamous cell carcinoma |
| HGIN: High-grade intraepithelial neoplasias | ||
| LGIN: Low-grade intraepithelial neoplasias | ||
| Liver | 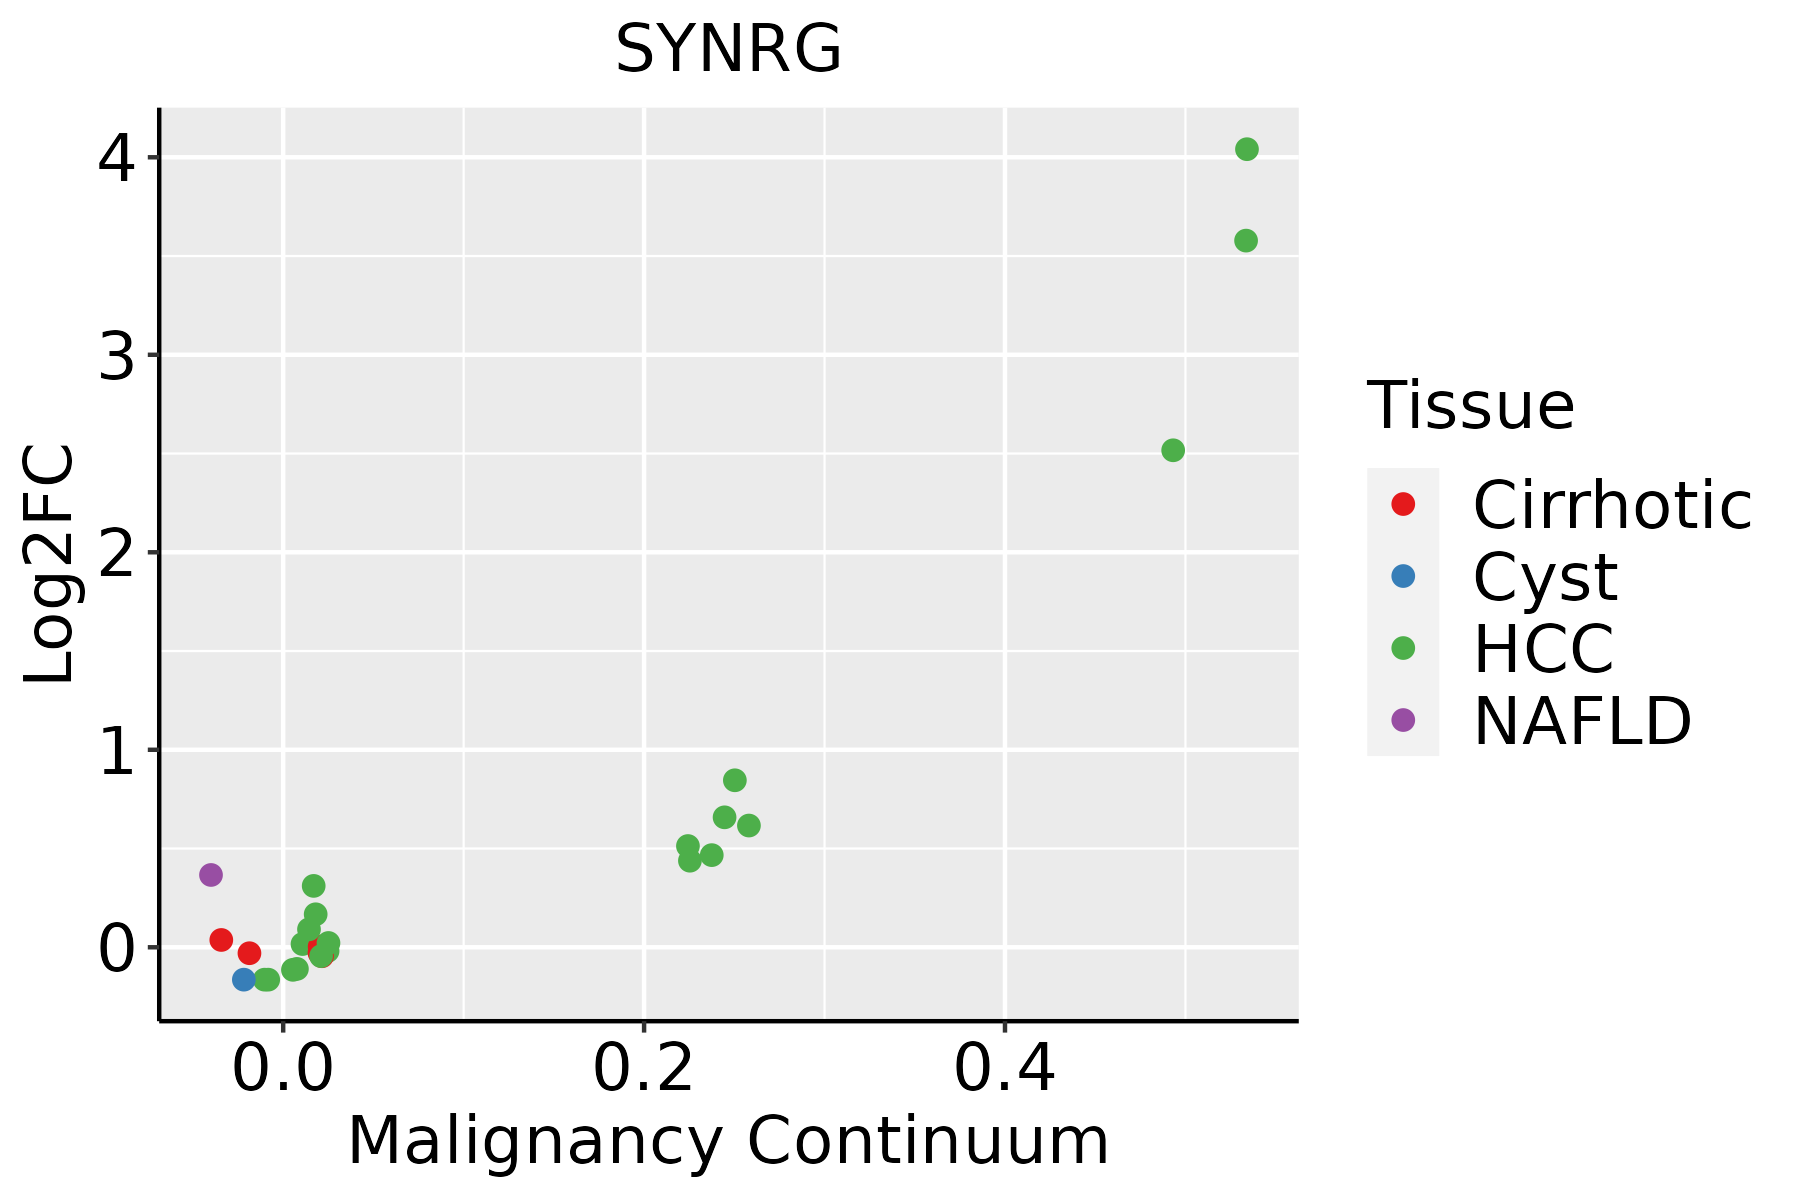 | HCC: Hepatocellular carcinoma |
| NAFLD: Non-alcoholic fatty liver disease | ||
| Prostate | 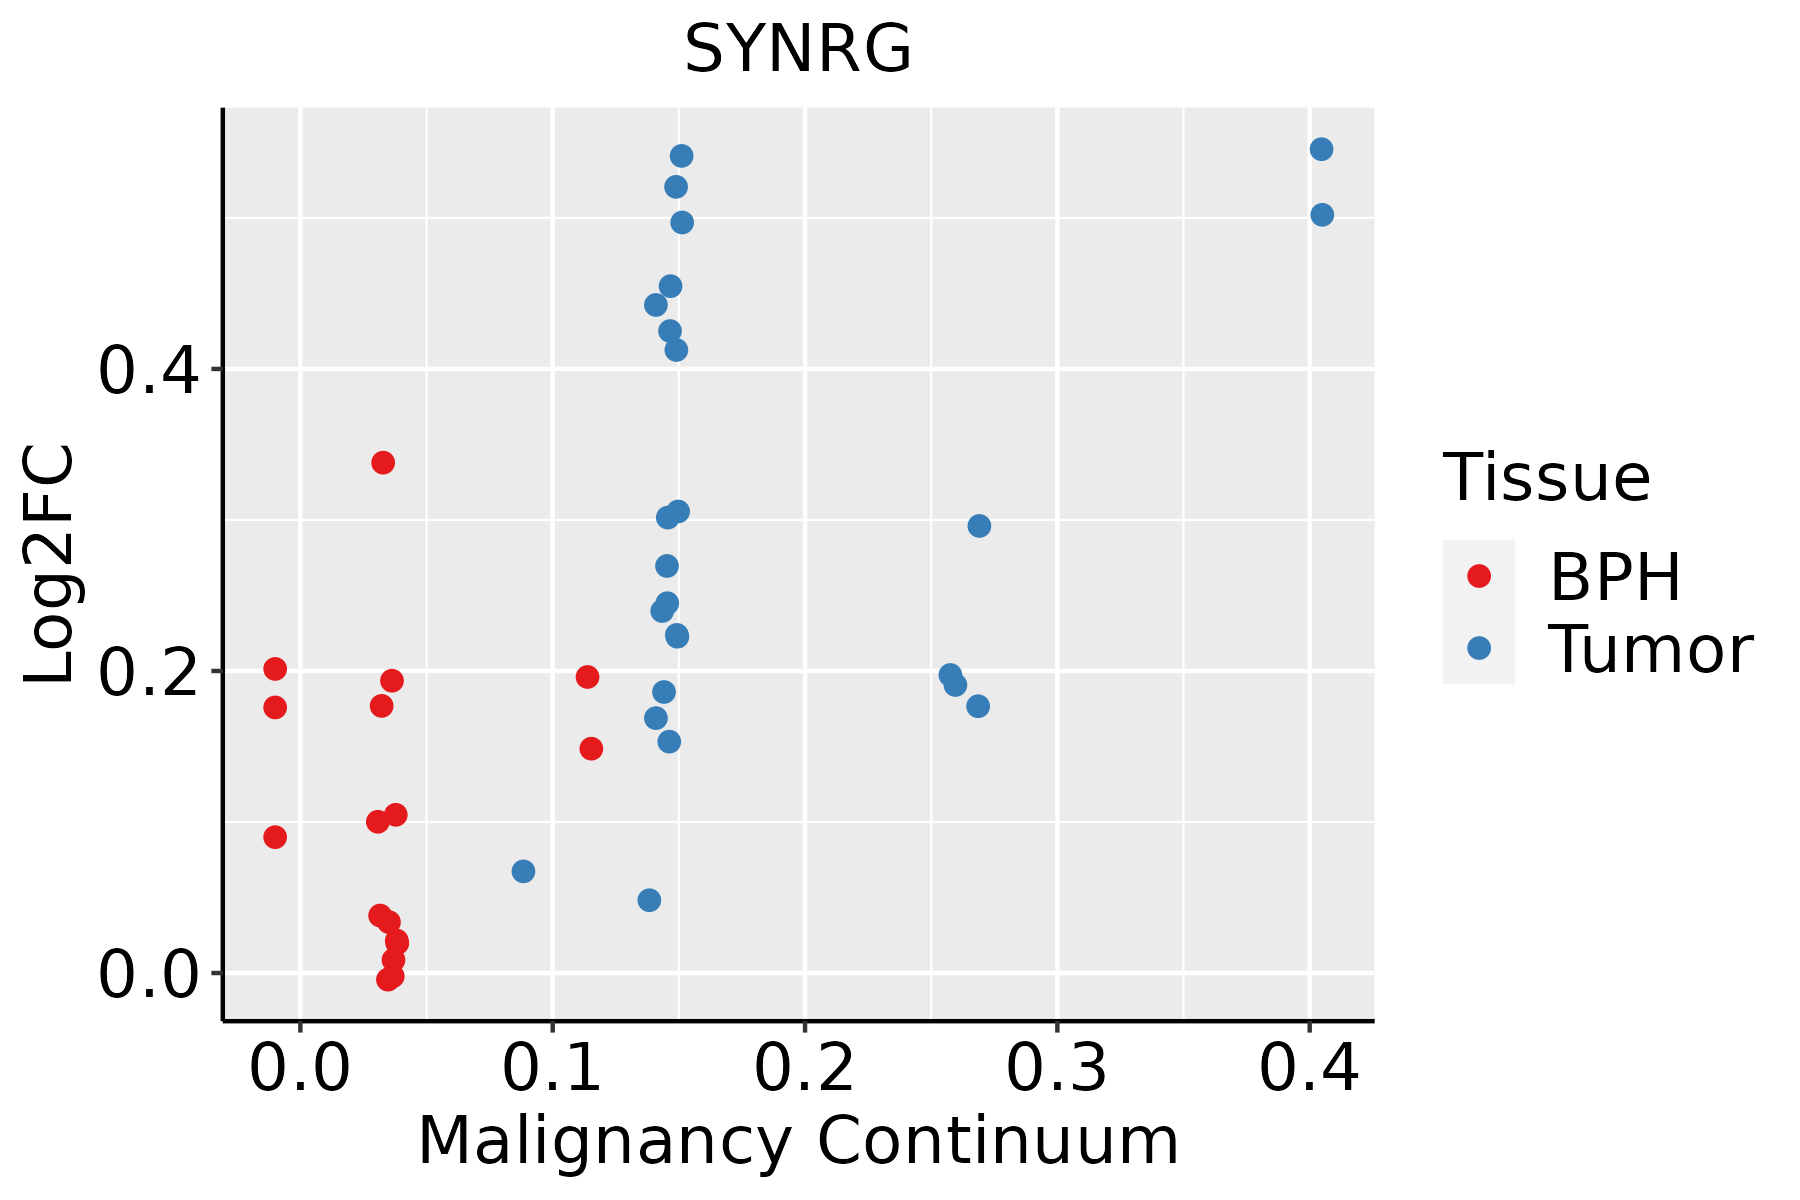 | BPH: Benign Prostatic Hyperplasia |
| Thyroid | 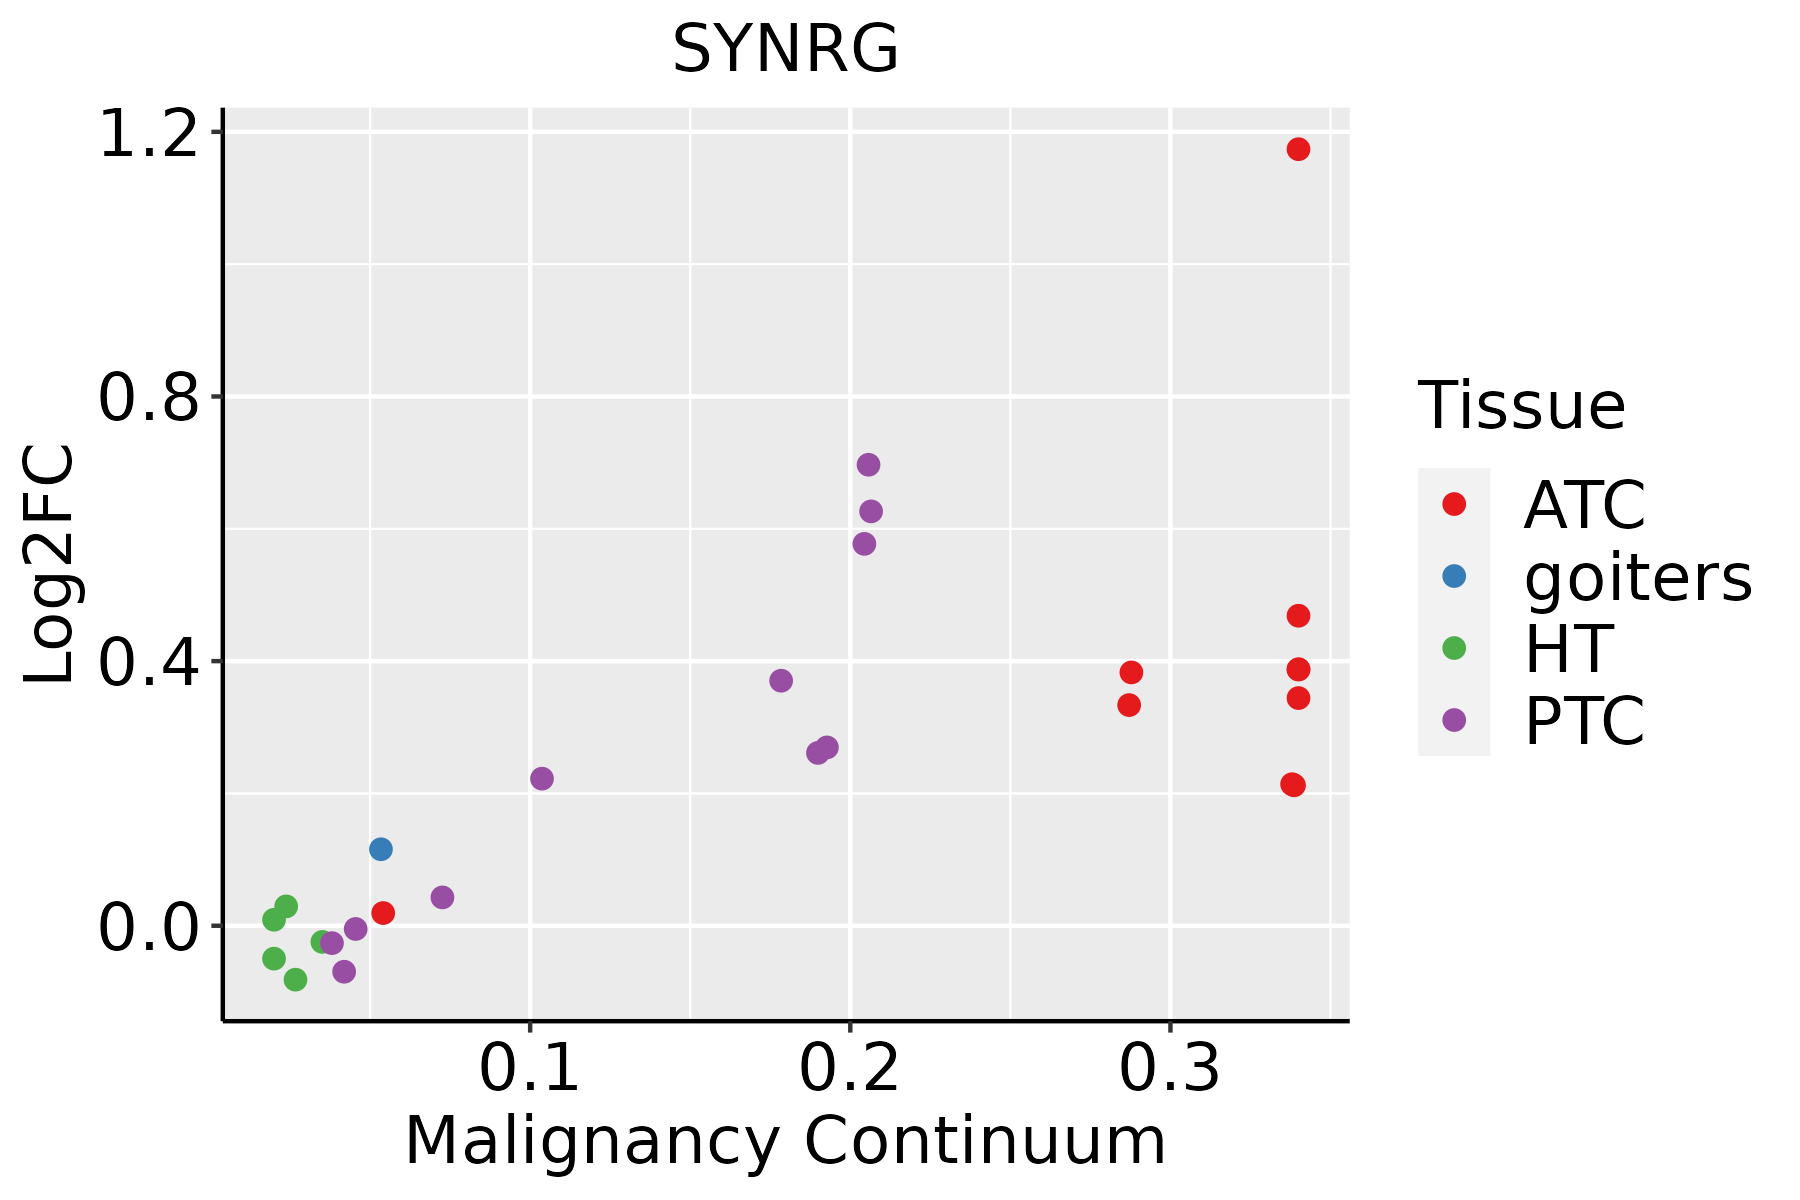 | ATC: Anaplastic thyroid cancer |
| HT: Hashimoto's thyroiditis | ||
| PTC: Papillary thyroid cancer |
| ∗log2FC in expression of this searched gene in stem-like cells from each diseased tissue sample relative to stem-like cells in normal samples in each tissue plotted against the malignancy continuum. Samples are colored based on if they are from different disease stage. |
Top |
Malignant transformation related pathway analysis |
| Find out the enriched GO biological processes and KEGG pathways involved in transition from healthy to precancer to cancer |
| Tissue | Disease Stage | Enriched GO biological Processes |
| Colorectum | AD |  |
| Colorectum | SER |  |
| Colorectum | MSS |  |
| Colorectum | MSI-H |  |
| Colorectum | FAP |  |
| ∗Top 15 enriched GO BP terms are showed in the bar plot of each disease state in each tissue. Each row represents a significant GO biological process which is colored according to the -log10(p.adjust). |
| Page: 1 2 3 4 5 6 7 8 9 |
| GO ID | Tissue | Disease Stage | Description | Gene Ratio | Bg Ratio | pvalue | p.adjust | Count |
| Page: 1 |
| Pathway ID | Tissue | Disease Stage | Description | Gene Ratio | Bg Ratio | pvalue | p.adjust | qvalue | Count |
| Page: 1 |
Top |
Cell-cell communication analysis |
| Identification of potential cell-cell interactions between two cell types and their ligand-receptor pairs for different disease states |
| Ligand | Receptor | LRpair | Pathway | Tissue | Disease Stage |
| Page: 1 |
Top |
Single-cell gene regulatory network inference analysis |
| Find out the significant the regulons (TFs) and the target genes of each regulon across cell types for different disease states |
| TF | Cell Type | Tissue | Disease Stage | Target Gene | RSS | Regulon Activity |
| ∗The dot plots of a searched regulon are shown for all cell subpopulations in each disease state of each tissue based on the regulon specific score inferred using pySCENIC and by calculating the average expression. |
| Page: 1 |
Top |
Somatic mutation of malignant transformation related genes |
| Annotation of somatic variants for genes involved in malignant transformation |
| Hugo Symbol | Variant Class | Variant Classification | dbSNP RS | HGVSc | HGVSp | HGVSp Short | SWISSPROT | BIOTYPE | SIFT | PolyPhen | Tumor Sample Barcode | Tissue | Histology | Sex | Age | Stage | Therapy Types | Drugs | Outcome |
| SYNRG | SNV | Missense_Mutation | novel | c.473N>A | p.Pro158His | p.P158H | Q9UMZ2 | protein_coding | deleterious(0) | probably_damaging(0.999) | TCGA-A2-A25A-01 | Breast | breast invasive carcinoma | Female | <65 | I/II | Unspecific | Cytoxan | SD |
| SYNRG | SNV | Missense_Mutation | novel | c.2655T>A | p.Asn885Lys | p.N885K | Q9UMZ2 | protein_coding | deleterious_low_confidence(0.02) | benign(0.053) | TCGA-D8-A1JK-01 | Breast | breast invasive carcinoma | Female | >=65 | I/II | Unknown | Unknown | SD |
| SYNRG | SNV | Missense_Mutation | novel | c.366G>T | p.Glu122Asp | p.E122D | Q9UMZ2 | protein_coding | deleterious_low_confidence(0) | probably_damaging(0.987) | TCGA-D8-A1JK-01 | Breast | breast invasive carcinoma | Female | >=65 | I/II | Unknown | Unknown | SD |
| SYNRG | insertion | Frame_Shift_Ins | novel | c.1915_1916insGTGAA | p.Thr639SerfsTer19 | p.T639Sfs*19 | Q9UMZ2 | protein_coding | TCGA-A2-A0CP-01 | Breast | breast invasive carcinoma | Female | <65 | I/II | Chemotherapy | cytoxan | SD | ||
| SYNRG | insertion | In_Frame_Ins | novel | c.1913_1914insAAGACTCTGCAT | p.Ser638delinsArgArgLeuCysIle | p.S638delinsRRLCI | Q9UMZ2 | protein_coding | TCGA-A2-A0CP-01 | Breast | breast invasive carcinoma | Female | <65 | I/II | Chemotherapy | cytoxan | SD | ||
| SYNRG | insertion | Nonsense_Mutation | novel | c.3570_3571insTGTTACGAGTAGTTCTCTGAATAGACAAATCACTGTTCCTTTGTGGG | p.Thr1191CysfsTer4 | p.T1191Cfs*4 | Q9UMZ2 | protein_coding | TCGA-A7-A0CJ-01 | Breast | breast invasive carcinoma | Female | <65 | I/II | Chemotherapy | cytoxan | SD | ||
| SYNRG | insertion | Nonsense_Mutation | novel | c.1864_1865insAACCAGCAACGTGGGCAGCACAGTGAAGGGTGGACAAAACTCGA | p.Ser622Ter | p.S622* | Q9UMZ2 | protein_coding | TCGA-A8-A0A4-01 | Breast | breast invasive carcinoma | Female | >=65 | I/II | Hormone Therapy | tamoxiphen | CR | ||
| SYNRG | insertion | Frame_Shift_Ins | novel | c.383_384insGCCTATTCTCATTG | p.Gln129ProfsTer11 | p.Q129Pfs*11 | Q9UMZ2 | protein_coding | TCGA-AR-A0U0-01 | Breast | breast invasive carcinoma | Female | >=65 | I/II | Unknown | Unknown | SD | ||
| SYNRG | insertion | Nonsense_Mutation | novel | c.3518-1_3518insAGTCGGAGGTTGCAGTGAGCTGAGATCACACCACTGCCCTCCAGCC | p.Gly1173GlufsTer8 | p.G1173Efs*8 | Q9UMZ2 | protein_coding | TCGA-BH-A0B1-01 | Breast | breast invasive carcinoma | Female | >=65 | I/II | Chemotherapy | adriamycin | SD | ||
| SYNRG | SNV | Missense_Mutation | novel | c.104N>C | p.Ile35Thr | p.I35T | Q9UMZ2 | protein_coding | deleterious_low_confidence(0) | benign(0.07) | TCGA-2W-A8YY-01 | Cervix | cervical & endocervical cancer | Female | <65 | I/II | Chemotherapy | cisplatin | CR |
| Page: 1 2 3 4 5 6 7 8 9 10 11 12 13 |
Top |
Related drugs of malignant transformation related genes |
| Identification of chemicals and drugs interact with genes involved in malignant transfromation |
| (DGIdb 4.0) |
| Entrez ID | Symbol | Category | Interaction Types | Drug Claim Name | Drug Name | PMIDs |
| Page: 1 |

Copyright 2023-Present -The University of Texas Health Science Center at Houston |