
|
|||||
|
 | |
| |
| |
| |
| |
| |
|
Gene: SYNPO |
Gene summary for SYNPO |
| Gene information | Species | Human | Gene symbol | SYNPO | Gene ID | 11346 |
| Gene name | synaptopodin | |
| Gene Alias | SYNPO | |
| Cytomap | 5q33.1 | |
| Gene Type | protein-coding | GO ID | GO:0006996 | UniProtAcc | Q8N3V7 |
Top |
Malignant transformation analysis |
| Identification of the aberrant gene expression in precancerous and cancerous lesions by comparing the gene expression of stem-like cells in diseased tissues with normal stem cells |
| Entrez ID | Symbol | Replicates | Species | Organ | Tissue | Adj P-value | Log2FC | Malignancy |
| 11346 | SYNPO | HTA11_1938_2000001011 | Human | Colorectum | AD | 1.22e-06 | 3.28e-01 | -0.0811 |
| 11346 | SYNPO | HTA11_347_2000001011 | Human | Colorectum | AD | 7.78e-05 | 2.51e-01 | -0.1954 |
| 11346 | SYNPO | HTA11_411_2000001011 | Human | Colorectum | SER | 1.27e-02 | 4.24e-01 | -0.2602 |
| 11346 | SYNPO | HTA11_83_2000001011 | Human | Colorectum | SER | 1.58e-02 | 3.63e-01 | -0.1526 |
| 11346 | SYNPO | HTA11_1391_2000001011 | Human | Colorectum | AD | 1.95e-02 | 3.49e-01 | -0.059 |
| 11346 | SYNPO | A001-C-014 | Human | Colorectum | FAP | 4.07e-04 | -9.19e-02 | 0.0135 |
| 11346 | SYNPO | LZE8T | Human | Esophagus | ESCC | 1.46e-03 | 8.72e-02 | 0.067 |
| 11346 | SYNPO | P2T-E | Human | Esophagus | ESCC | 4.53e-26 | 6.22e-01 | 0.1177 |
| 11346 | SYNPO | P8T-E | Human | Esophagus | ESCC | 1.01e-02 | 1.20e-01 | 0.0889 |
| 11346 | SYNPO | P10T-E | Human | Esophagus | ESCC | 1.03e-04 | 1.27e-01 | 0.116 |
| 11346 | SYNPO | P11T-E | Human | Esophagus | ESCC | 1.87e-06 | 5.50e-01 | 0.1426 |
| 11346 | SYNPO | P12T-E | Human | Esophagus | ESCC | 1.88e-03 | 1.05e-02 | 0.1122 |
| 11346 | SYNPO | P15T-E | Human | Esophagus | ESCC | 5.89e-05 | 7.74e-02 | 0.1149 |
| 11346 | SYNPO | P16T-E | Human | Esophagus | ESCC | 1.08e-08 | 5.29e-02 | 0.1153 |
| 11346 | SYNPO | P17T-E | Human | Esophagus | ESCC | 2.99e-04 | 1.97e-01 | 0.1278 |
| 11346 | SYNPO | P19T-E | Human | Esophagus | ESCC | 1.52e-03 | 3.77e-01 | 0.1662 |
| 11346 | SYNPO | P21T-E | Human | Esophagus | ESCC | 4.94e-09 | 1.14e-01 | 0.1617 |
| 11346 | SYNPO | P22T-E | Human | Esophagus | ESCC | 2.59e-12 | 1.33e-01 | 0.1236 |
| 11346 | SYNPO | P24T-E | Human | Esophagus | ESCC | 3.20e-02 | 1.02e-01 | 0.1287 |
| 11346 | SYNPO | P26T-E | Human | Esophagus | ESCC | 2.61e-04 | 3.92e-02 | 0.1276 |
| Page: 1 2 3 4 |
| Tissue | Expression Dynamics | Abbreviation |
| Colorectum (GSE201348) |  | FAP: Familial adenomatous polyposis |
| CRC: Colorectal cancer | ||
| Colorectum (HTA11) |  | AD: Adenomas |
| SER: Sessile serrated lesions | ||
| MSI-H: Microsatellite-high colorectal cancer | ||
| MSS: Microsatellite stable colorectal cancer | ||
| Esophagus | 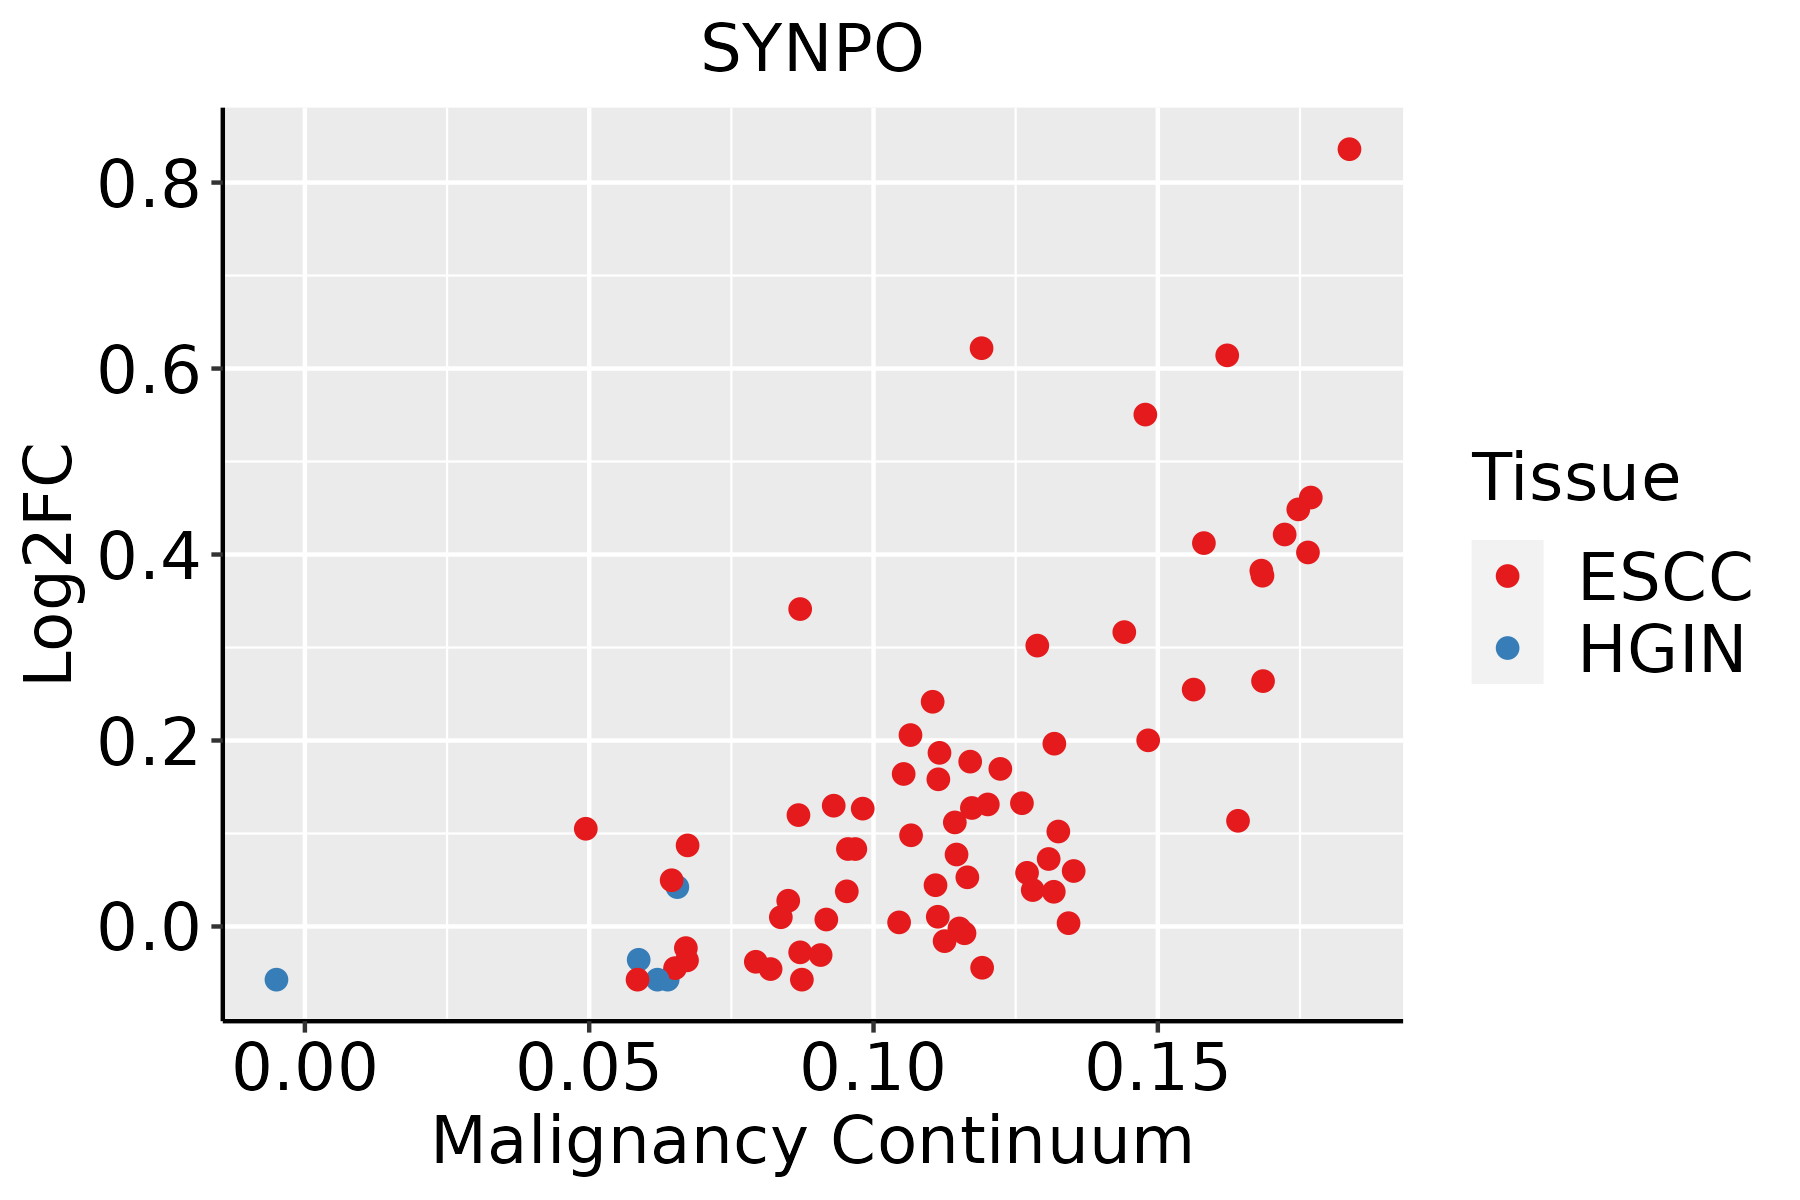 | ESCC: Esophageal squamous cell carcinoma |
| HGIN: High-grade intraepithelial neoplasias | ||
| LGIN: Low-grade intraepithelial neoplasias | ||
| Liver | 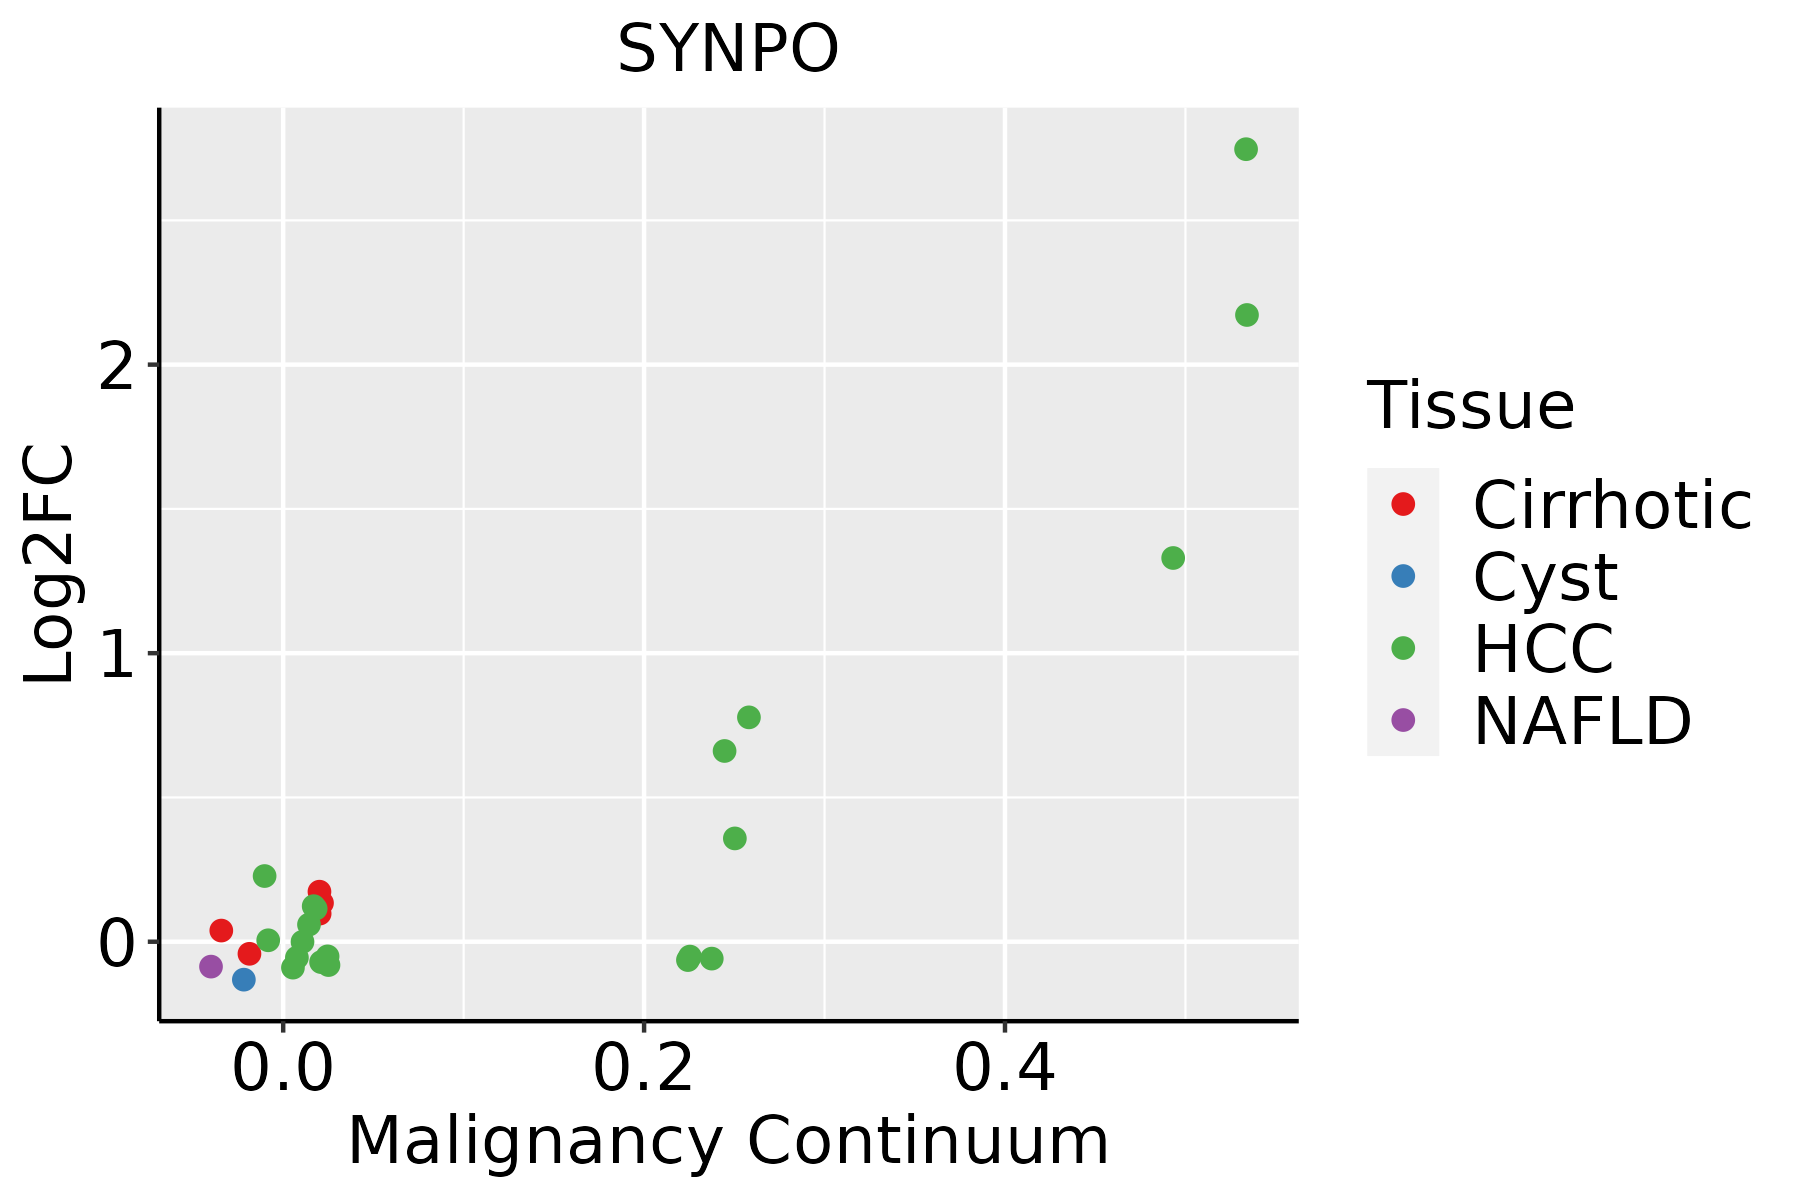 | HCC: Hepatocellular carcinoma |
| NAFLD: Non-alcoholic fatty liver disease | ||
| Oral Cavity |  | EOLP: Erosive Oral lichen planus |
| LP: leukoplakia | ||
| NEOLP: Non-erosive oral lichen planus | ||
| OSCC: Oral squamous cell carcinoma | ||
| Thyroid | 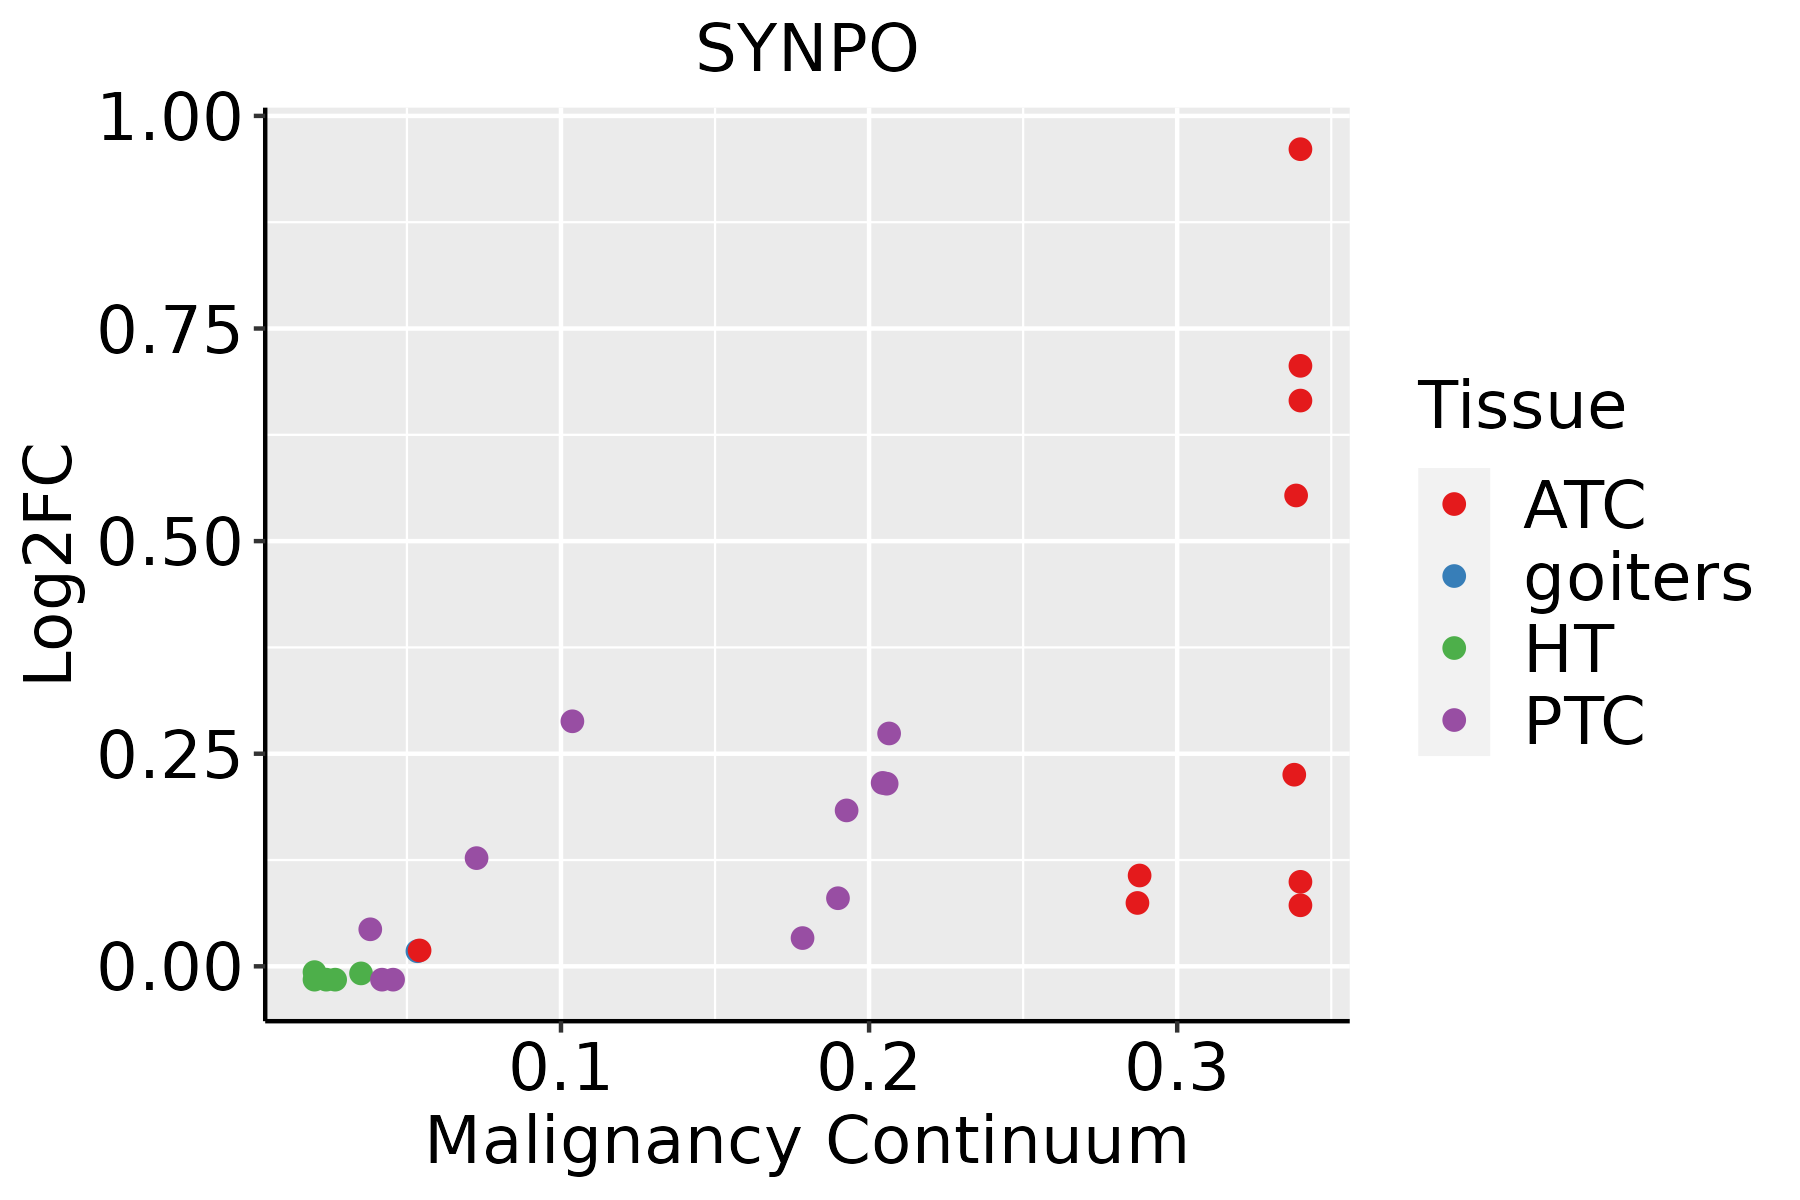 | ATC: Anaplastic thyroid cancer |
| HT: Hashimoto's thyroiditis | ||
| PTC: Papillary thyroid cancer |
| ∗log2FC in expression of this searched gene in stem-like cells from each diseased tissue sample relative to stem-like cells in normal samples in each tissue plotted against the malignancy continuum. Samples are colored based on if they are from different disease stage. |
Top |
Malignant transformation related pathway analysis |
| Find out the enriched GO biological processes and KEGG pathways involved in transition from healthy to precancer to cancer |
| Tissue | Disease Stage | Enriched GO biological Processes |
| Colorectum | AD |  |
| Colorectum | SER |  |
| Colorectum | MSS |  |
| Colorectum | MSI-H |  |
| Colorectum | FAP |  |
| ∗Top 15 enriched GO BP terms are showed in the bar plot of each disease state in each tissue. Each row represents a significant GO biological process which is colored according to the -log10(p.adjust). |
| Page: 1 2 3 4 5 6 7 8 9 |
| GO ID | Tissue | Disease Stage | Description | Gene Ratio | Bg Ratio | pvalue | p.adjust | Count |
| GO:000701510 | Cervix | CC | actin filament organization | 109/2311 | 442/18723 | 4.92e-13 | 2.45e-10 | 109 |
| GO:003297010 | Cervix | CC | regulation of actin filament-based process | 96/2311 | 397/18723 | 4.00e-11 | 8.54e-09 | 96 |
| GO:190290310 | Cervix | CC | regulation of supramolecular fiber organization | 92/2311 | 383/18723 | 1.49e-10 | 2.48e-08 | 92 |
| GO:003295610 | Cervix | CC | regulation of actin cytoskeleton organization | 86/2311 | 358/18723 | 5.90e-10 | 7.51e-08 | 86 |
| GO:011005310 | Cervix | CC | regulation of actin filament organization | 67/2311 | 278/18723 | 4.01e-08 | 2.54e-06 | 67 |
| GO:006157210 | Cervix | CC | actin filament bundle organization | 44/2311 | 161/18723 | 2.08e-07 | 9.34e-06 | 44 |
| GO:005101710 | Cervix | CC | actin filament bundle assembly | 43/2311 | 157/18723 | 2.66e-07 | 1.12e-05 | 43 |
| GO:190290510 | Cervix | CC | positive regulation of supramolecular fiber organization | 50/2311 | 209/18723 | 2.55e-06 | 7.54e-05 | 50 |
| GO:005149510 | Cervix | CC | positive regulation of cytoskeleton organization | 50/2311 | 226/18723 | 2.53e-05 | 4.29e-04 | 50 |
| GO:003223110 | Cervix | CC | regulation of actin filament bundle assembly | 28/2311 | 105/18723 | 5.19e-05 | 7.79e-04 | 28 |
| GO:00162367 | Cervix | CC | macroautophagy | 58/2311 | 291/18723 | 1.40e-04 | 1.70e-03 | 58 |
| GO:00616847 | Cervix | CC | chaperone-mediated autophagy | 8/2311 | 16/18723 | 2.73e-04 | 2.99e-03 | 8 |
| GO:00322339 | Cervix | CC | positive regulation of actin filament bundle assembly | 18/2311 | 63/18723 | 4.39e-04 | 4.39e-03 | 18 |
| GO:00000452 | Cervix | CC | autophagosome assembly | 21/2311 | 99/18723 | 8.67e-03 | 4.46e-02 | 21 |
| GO:0007015 | Colorectum | AD | actin filament organization | 167/3918 | 442/18723 | 1.65e-16 | 7.94e-14 | 167 |
| GO:1902903 | Colorectum | AD | regulation of supramolecular fiber organization | 139/3918 | 383/18723 | 2.01e-12 | 3.19e-10 | 139 |
| GO:0032970 | Colorectum | AD | regulation of actin filament-based process | 142/3918 | 397/18723 | 4.05e-12 | 5.90e-10 | 142 |
| GO:0110053 | Colorectum | AD | regulation of actin filament organization | 108/3918 | 278/18723 | 5.02e-12 | 6.98e-10 | 108 |
| GO:1902905 | Colorectum | AD | positive regulation of supramolecular fiber organization | 85/3918 | 209/18723 | 5.95e-11 | 6.33e-09 | 85 |
| GO:0032956 | Colorectum | AD | regulation of actin cytoskeleton organization | 127/3918 | 358/18723 | 1.03e-10 | 1.04e-08 | 127 |
| Page: 1 2 3 4 5 6 7 8 9 10 11 12 |
| Pathway ID | Tissue | Disease Stage | Description | Gene Ratio | Bg Ratio | pvalue | p.adjust | qvalue | Count |
| hsa04530 | Colorectum | AD | Tight junction | 76/2092 | 169/8465 | 5.49e-09 | 9.69e-08 | 6.18e-08 | 76 |
| hsa045301 | Colorectum | AD | Tight junction | 76/2092 | 169/8465 | 5.49e-09 | 9.69e-08 | 6.18e-08 | 76 |
| hsa045302 | Colorectum | SER | Tight junction | 59/1580 | 169/8465 | 3.24e-07 | 5.98e-06 | 4.34e-06 | 59 |
| hsa045303 | Colorectum | SER | Tight junction | 59/1580 | 169/8465 | 3.24e-07 | 5.98e-06 | 4.34e-06 | 59 |
| hsa045308 | Colorectum | FAP | Tight junction | 60/1404 | 169/8465 | 1.40e-09 | 9.33e-08 | 5.67e-08 | 60 |
| hsa045309 | Colorectum | FAP | Tight junction | 60/1404 | 169/8465 | 1.40e-09 | 9.33e-08 | 5.67e-08 | 60 |
| hsa04530211 | Esophagus | ESCC | Tight junction | 105/4205 | 169/8465 | 6.73e-04 | 2.23e-03 | 1.14e-03 | 105 |
| hsa04530310 | Esophagus | ESCC | Tight junction | 105/4205 | 169/8465 | 6.73e-04 | 2.23e-03 | 1.14e-03 | 105 |
| hsa0453022 | Liver | Cirrhotic | Tight junction | 82/2530 | 169/8465 | 2.14e-07 | 2.85e-06 | 1.76e-06 | 82 |
| hsa0453032 | Liver | Cirrhotic | Tight junction | 82/2530 | 169/8465 | 2.14e-07 | 2.85e-06 | 1.76e-06 | 82 |
| hsa0453042 | Liver | HCC | Tight junction | 110/4020 | 169/8465 | 2.45e-06 | 2.28e-05 | 1.27e-05 | 110 |
| hsa0453052 | Liver | HCC | Tight junction | 110/4020 | 169/8465 | 2.45e-06 | 2.28e-05 | 1.27e-05 | 110 |
| hsa0453030 | Oral cavity | OSCC | Tight junction | 102/3704 | 169/8465 | 8.68e-06 | 3.93e-05 | 2.00e-05 | 102 |
| hsa04530114 | Oral cavity | OSCC | Tight junction | 102/3704 | 169/8465 | 8.68e-06 | 3.93e-05 | 2.00e-05 | 102 |
| Page: 1 |
Top |
Cell-cell communication analysis |
| Identification of potential cell-cell interactions between two cell types and their ligand-receptor pairs for different disease states |
| Ligand | Receptor | LRpair | Pathway | Tissue | Disease Stage |
| Page: 1 |
Top |
Single-cell gene regulatory network inference analysis |
| Find out the significant the regulons (TFs) and the target genes of each regulon across cell types for different disease states |
| TF | Cell Type | Tissue | Disease Stage | Target Gene | RSS | Regulon Activity |
| ∗The dot plots of a searched regulon are shown for all cell subpopulations in each disease state of each tissue based on the regulon specific score inferred using pySCENIC and by calculating the average expression. |
| Page: 1 |
Top |
Somatic mutation of malignant transformation related genes |
| Annotation of somatic variants for genes involved in malignant transformation |
| Hugo Symbol | Variant Class | Variant Classification | dbSNP RS | HGVSc | HGVSp | HGVSp Short | SWISSPROT | BIOTYPE | SIFT | PolyPhen | Tumor Sample Barcode | Tissue | Histology | Sex | Age | Stage | Therapy Types | Drugs | Outcome |
| SYNPO | SNV | Missense_Mutation | c.2215G>A | p.Val739Ile | p.V739I | Q8N3V7 | protein_coding | tolerated(0.16) | possibly_damaging(0.705) | TCGA-AR-A254-01 | Breast | breast invasive carcinoma | Female | <65 | III/IV | Chemotherapy | paclitaxel | SD | |
| SYNPO | SNV | Missense_Mutation | novel | c.1184G>A | p.Arg395Lys | p.R395K | Q8N3V7 | protein_coding | tolerated(0.65) | benign(0) | TCGA-BH-A2L8-01 | Breast | breast invasive carcinoma | Female | <65 | I/II | Chemotherapy | cytoxan | CR |
| SYNPO | SNV | Missense_Mutation | c.1376N>T | p.Ala459Val | p.A459V | Q8N3V7 | protein_coding | tolerated(0.13) | benign(0.001) | TCGA-D8-A1J8-01 | Breast | breast invasive carcinoma | Female | >=65 | I/II | Hormone Therapy | nolvadex | SD | |
| SYNPO | SNV | Missense_Mutation | c.2341N>T | p.Ala781Ser | p.A781S | Q8N3V7 | protein_coding | tolerated(0.3) | possibly_damaging(0.519) | TCGA-E9-A295-01 | Breast | breast invasive carcinoma | Female | >=65 | I/II | Hormone Therapy | tamoxiphen | SD | |
| SYNPO | insertion | Nonsense_Mutation | novel | c.2647_2648insTACCGAGTGCCACTGTATGACAGGTGCTGTT | p.Pro883LeufsTer7 | p.P883Lfs*7 | Q8N3V7 | protein_coding | TCGA-B6-A0IN-01 | Breast | breast invasive carcinoma | Female | <65 | I/II | Unknown | Unknown | PD | ||
| SYNPO | SNV | Missense_Mutation | novel | c.647G>A | p.Ser216Asn | p.S216N | Q8N3V7 | protein_coding | tolerated(0.53) | benign(0.01) | TCGA-2W-A8YY-01 | Cervix | cervical & endocervical cancer | Female | <65 | I/II | Chemotherapy | cisplatin | CR |
| SYNPO | SNV | Missense_Mutation | novel | c.2083N>A | p.Glu695Lys | p.E695K | Q8N3V7 | protein_coding | deleterious(0.01) | probably_damaging(0.957) | TCGA-C5-A2LZ-01 | Cervix | cervical & endocervical cancer | Female | >=65 | III/IV | Unknown | Unknown | PD |
| SYNPO | SNV | Missense_Mutation | c.1477G>T | p.Gly493Trp | p.G493W | Q8N3V7 | protein_coding | deleterious(0) | probably_damaging(0.975) | TCGA-C5-A7CH-01 | Cervix | cervical & endocervical cancer | Female | <65 | I/II | Unspecific | SD | ||
| SYNPO | SNV | Missense_Mutation | c.1067N>G | p.Ser356Cys | p.S356C | Q8N3V7 | protein_coding | deleterious(0.02) | benign(0.326) | TCGA-DS-A0VN-01 | Cervix | cervical & endocervical cancer | Female | <65 | I/II | Chemotherapy | cisplatin | SD | |
| SYNPO | SNV | Missense_Mutation | c.1651N>C | p.Ser551Pro | p.S551P | Q8N3V7 | protein_coding | deleterious(0.05) | benign(0.001) | TCGA-EK-A3GM-01 | Cervix | cervical & endocervical cancer | Female | >=65 | I/II | Unknown | Unknown | SD |
| Page: 1 2 3 4 5 6 7 8 9 |
Top |
Related drugs of malignant transformation related genes |
| Identification of chemicals and drugs interact with genes involved in malignant transfromation |
| (DGIdb 4.0) |
| Entrez ID | Symbol | Category | Interaction Types | Drug Claim Name | Drug Name | PMIDs |
| Page: 1 |

Copyright 2023-Present -The University of Texas Health Science Center at Houston |