
|
|||||
|
 | |
| |
| |
| |
| |
| |
|
Gene: SYNM |
Gene summary for SYNM |
| Gene information | Species | Human | Gene symbol | SYNM | Gene ID | 23336 |
| Gene name | synemin | |
| Gene Alias | DMN | |
| Cytomap | 15q26.3 | |
| Gene Type | protein-coding | GO ID | GO:0003008 | UniProtAcc | A0A075B7B1 |
Top |
Malignant transformation analysis |
| Identification of the aberrant gene expression in precancerous and cancerous lesions by comparing the gene expression of stem-like cells in diseased tissues with normal stem cells |
| Entrez ID | Symbol | Replicates | Species | Organ | Tissue | Adj P-value | Log2FC | Malignancy |
| 23336 | SYNM | GSM4909281 | Human | Breast | IDC | 4.87e-28 | 6.41e-01 | 0.21 |
| 23336 | SYNM | GSM4909297 | Human | Breast | IDC | 1.57e-03 | -1.57e-01 | 0.1517 |
| 23336 | SYNM | GSM4909299 | Human | Breast | IDC | 1.59e-44 | 9.29e-01 | 0.035 |
| 23336 | SYNM | GSM4909301 | Human | Breast | IDC | 3.51e-04 | -1.58e-01 | 0.1577 |
| 23336 | SYNM | GSM4909304 | Human | Breast | IDC | 3.66e-05 | -1.61e-01 | 0.1636 |
| 23336 | SYNM | GSM4909309 | Human | Breast | IDC | 1.31e-05 | 4.18e-01 | 0.0483 |
| 23336 | SYNM | GSM4909311 | Human | Breast | IDC | 4.94e-03 | -1.37e-01 | 0.1534 |
| 23336 | SYNM | GSM4909312 | Human | Breast | IDC | 1.65e-04 | -1.61e-01 | 0.1552 |
| 23336 | SYNM | GSM4909313 | Human | Breast | IDC | 4.16e-17 | 6.54e-01 | 0.0391 |
| 23336 | SYNM | GSM4909319 | Human | Breast | IDC | 7.43e-04 | -1.61e-01 | 0.1563 |
| 23336 | SYNM | brca10 | Human | Breast | Precancer | 1.36e-04 | -1.61e-01 | -0.0029 |
| 23336 | SYNM | M1 | Human | Breast | IDC | 3.22e-02 | -1.61e-01 | 0.1577 |
| 23336 | SYNM | NCCBC14 | Human | Breast | DCIS | 1.58e-04 | -1.16e-01 | 0.2021 |
| 23336 | SYNM | NCCBC3 | Human | Breast | DCIS | 1.94e-12 | 5.45e-01 | 0.1198 |
| 23336 | SYNM | P1 | Human | Breast | IDC | 8.63e-03 | -1.27e-01 | 0.1527 |
| 23336 | SYNM | P2 | Human | Breast | IDC | 4.28e-02 | -1.61e-01 | 0.21 |
| 23336 | SYNM | DCIS2 | Human | Breast | DCIS | 5.62e-122 | 1.55e+00 | 0.0085 |
| 23336 | SYNM | P2T-E | Human | Esophagus | ESCC | 3.07e-07 | 1.74e-01 | 0.1177 |
| 23336 | SYNM | P4T-E | Human | Esophagus | ESCC | 2.90e-03 | 1.05e-01 | 0.1323 |
| 23336 | SYNM | P5T-E | Human | Esophagus | ESCC | 1.44e-03 | 7.01e-02 | 0.1327 |
| Page: 1 2 3 |
| Tissue | Expression Dynamics | Abbreviation |
| Breast | 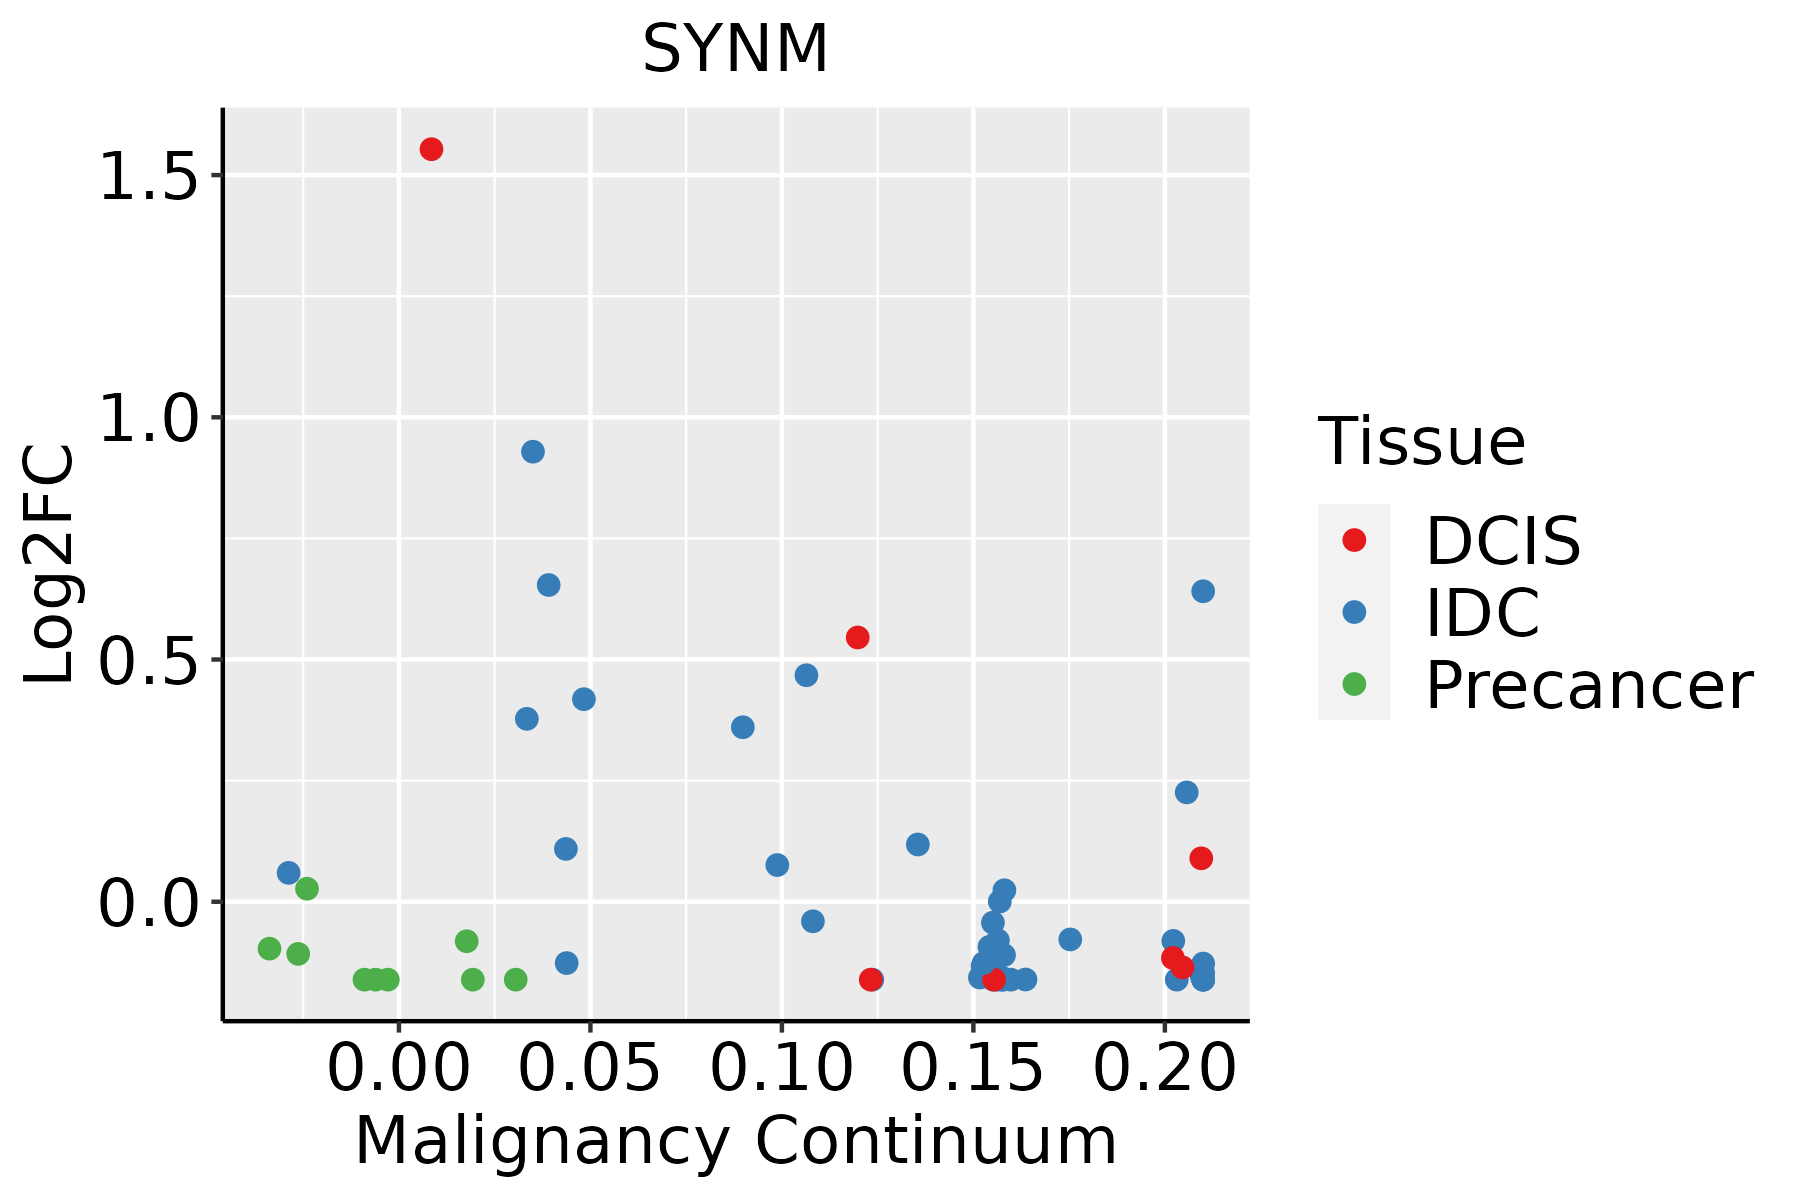 | IDC: Invasive ductal carcinoma |
| DCIS: Ductal carcinoma in situ | ||
| Precancer(BRCA1-mut): Precancerous lesion from BRCA1 mutation carriers | ||
| Esophagus | 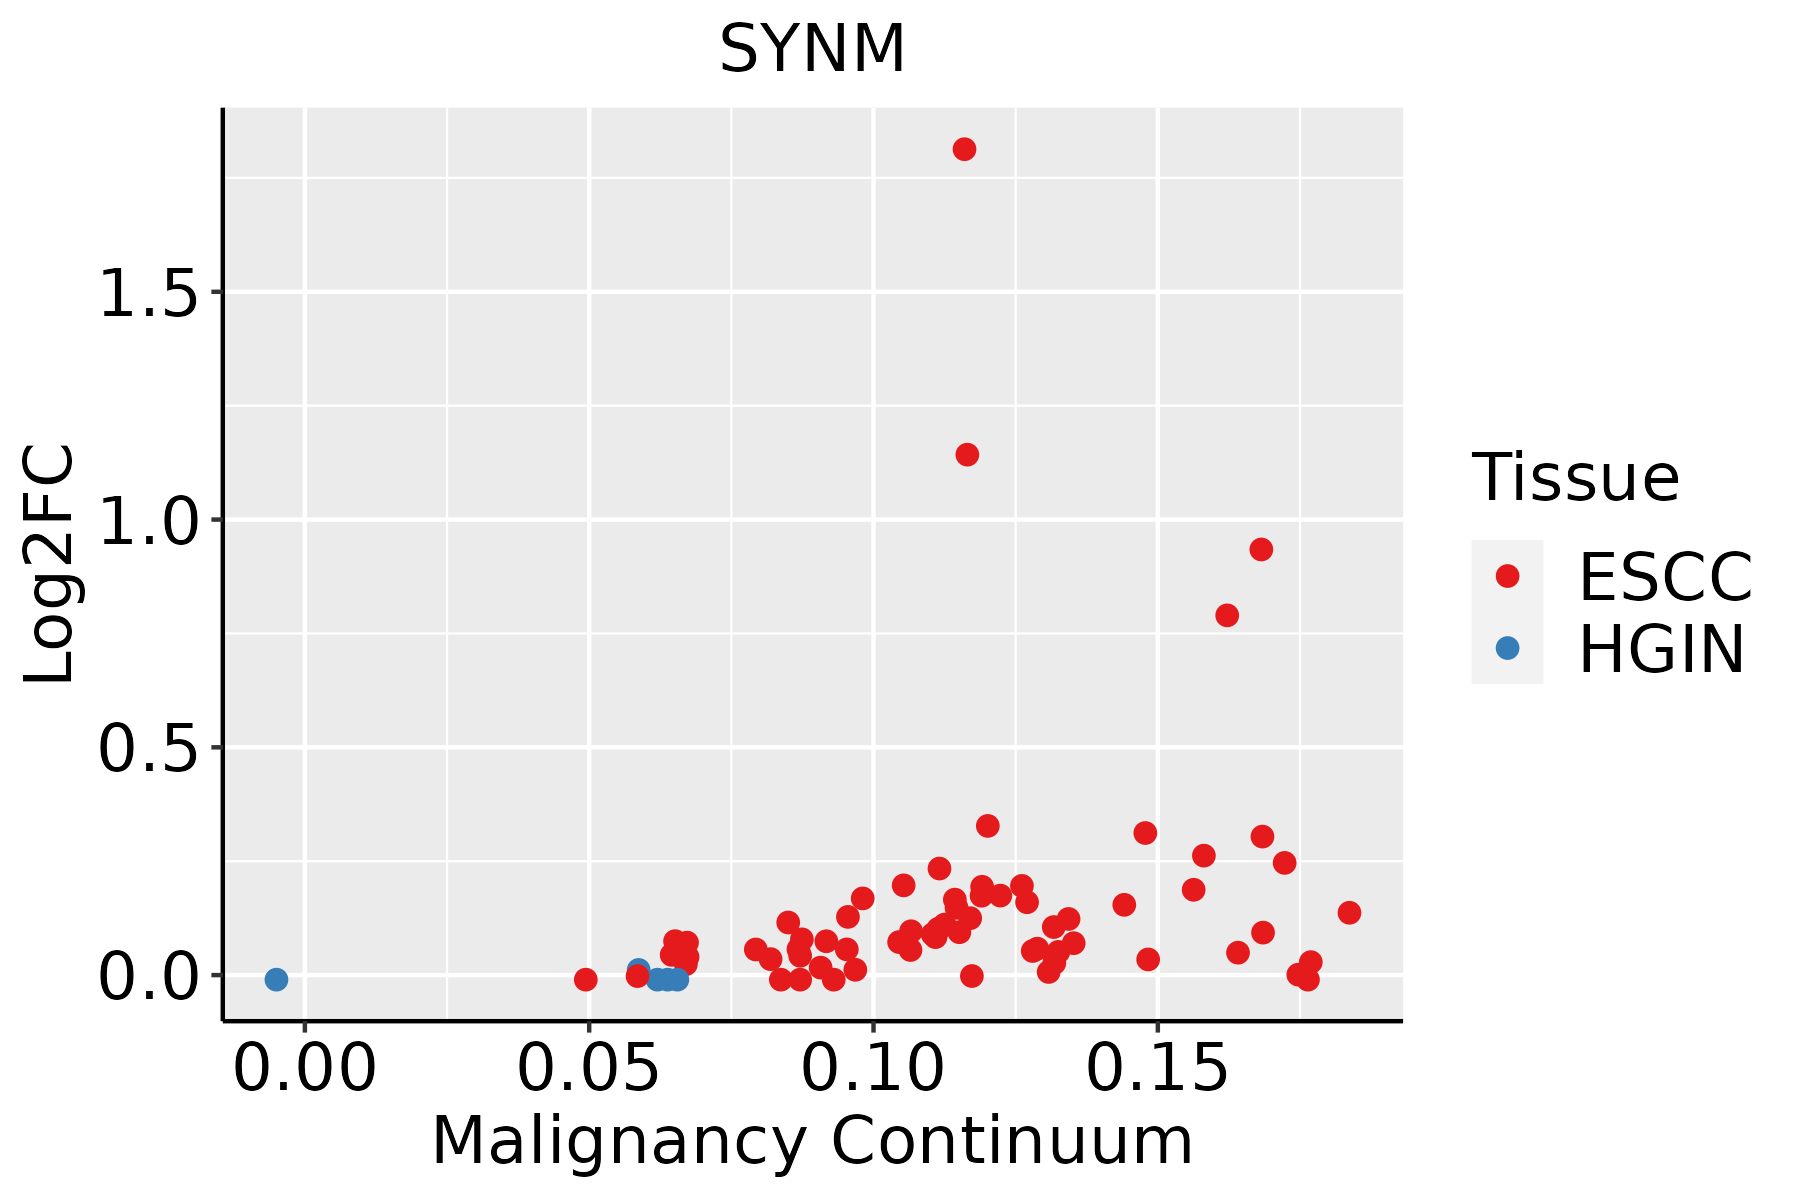 | ESCC: Esophageal squamous cell carcinoma |
| HGIN: High-grade intraepithelial neoplasias | ||
| LGIN: Low-grade intraepithelial neoplasias | ||
| Thyroid |  | ATC: Anaplastic thyroid cancer |
| HT: Hashimoto's thyroiditis | ||
| PTC: Papillary thyroid cancer |
| ∗log2FC in expression of this searched gene in stem-like cells from each diseased tissue sample relative to stem-like cells in normal samples in each tissue plotted against the malignancy continuum. Samples are colored based on if they are from different disease stage. |
Top |
Malignant transformation related pathway analysis |
| Find out the enriched GO biological processes and KEGG pathways involved in transition from healthy to precancer to cancer |
| Tissue | Disease Stage | Enriched GO biological Processes |
| Colorectum | AD |  |
| Colorectum | SER |  |
| Colorectum | MSS |  |
| Colorectum | MSI-H |  |
| Colorectum | FAP |  |
| ∗Top 15 enriched GO BP terms are showed in the bar plot of each disease state in each tissue. Each row represents a significant GO biological process which is colored according to the -log10(p.adjust). |
| Page: 1 2 3 4 5 6 7 8 9 |
| GO ID | Tissue | Disease Stage | Description | Gene Ratio | Bg Ratio | pvalue | p.adjust | Count |
| GO:0045104 | Breast | Precancer | intermediate filament cytoskeleton organization | 11/1080 | 51/18723 | 1.26e-04 | 2.22e-03 | 11 |
| GO:0045103 | Breast | Precancer | intermediate filament-based process | 11/1080 | 52/18723 | 1.52e-04 | 2.60e-03 | 11 |
| GO:00451041 | Breast | IDC | intermediate filament cytoskeleton organization | 11/1434 | 51/18723 | 1.40e-03 | 1.44e-02 | 11 |
| GO:00451031 | Breast | IDC | intermediate filament-based process | 11/1434 | 52/18723 | 1.66e-03 | 1.63e-02 | 11 |
| GO:00030125 | Breast | IDC | muscle system process | 50/1434 | 452/18723 | 5.52e-03 | 4.05e-02 | 50 |
| GO:00451042 | Breast | DCIS | intermediate filament cytoskeleton organization | 11/1390 | 51/18723 | 1.09e-03 | 1.18e-02 | 11 |
| GO:00451032 | Breast | DCIS | intermediate filament-based process | 11/1390 | 52/18723 | 1.29e-03 | 1.35e-02 | 11 |
| GO:000301212 | Breast | DCIS | muscle system process | 50/1390 | 452/18723 | 3.02e-03 | 2.57e-02 | 50 |
| GO:00451035 | Esophagus | ESCC | intermediate filament-based process | 32/8552 | 52/18723 | 1.55e-02 | 4.97e-02 | 32 |
| Page: 1 |
| Pathway ID | Tissue | Disease Stage | Description | Gene Ratio | Bg Ratio | pvalue | p.adjust | qvalue | Count |
| Page: 1 |
Top |
Cell-cell communication analysis |
| Identification of potential cell-cell interactions between two cell types and their ligand-receptor pairs for different disease states |
| Ligand | Receptor | LRpair | Pathway | Tissue | Disease Stage |
| Page: 1 |
Top |
Single-cell gene regulatory network inference analysis |
| Find out the significant the regulons (TFs) and the target genes of each regulon across cell types for different disease states |
| TF | Cell Type | Tissue | Disease Stage | Target Gene | RSS | Regulon Activity |
| ∗The dot plots of a searched regulon are shown for all cell subpopulations in each disease state of each tissue based on the regulon specific score inferred using pySCENIC and by calculating the average expression. |
| Page: 1 |
Top |
Somatic mutation of malignant transformation related genes |
| Annotation of somatic variants for genes involved in malignant transformation |
| Hugo Symbol | Variant Class | Variant Classification | dbSNP RS | HGVSc | HGVSp | HGVSp Short | SWISSPROT | BIOTYPE | SIFT | PolyPhen | Tumor Sample Barcode | Tissue | Histology | Sex | Age | Stage | Therapy Types | Drugs | Outcome |
| SYNM | SNV | Missense_Mutation | novel | c.2432A>C | p.Asn811Thr | p.N811T | O15061 | protein_coding | tolerated(0.05) | benign(0.105) | TCGA-AN-A046-01 | Breast | breast invasive carcinoma | Female | >=65 | I/II | Unknown | Unknown | SD |
| SYNM | SNV | Missense_Mutation | c.1817G>A | p.Gly606Glu | p.G606E | O15061 | protein_coding | tolerated(0.09) | possibly_damaging(0.637) | TCGA-BH-A0HF-01 | Breast | breast invasive carcinoma | Female | >=65 | I/II | Hormone Therapy | arimidex | SD | |
| SYNM | SNV | Missense_Mutation | c.1001N>G | p.Pro334Arg | p.P334R | O15061 | protein_coding | deleterious(0) | probably_damaging(0.978) | TCGA-C8-A275-01 | Breast | breast invasive carcinoma | Female | <65 | I/II | Unknown | Unknown | SD | |
| SYNM | SNV | Missense_Mutation | rs552082607 | c.2908N>A | p.Ala970Thr | p.A970T | O15061 | protein_coding | tolerated(0.17) | benign(0.259) | TCGA-D8-A1XK-01 | Breast | breast invasive carcinoma | Female | <65 | I/II | Chemotherapy | doxorubicine+cyclophosphamide | SD |
| SYNM | SNV | Missense_Mutation | rs782418930 | c.4376N>T | p.Ser1459Leu | p.S1459L | O15061 | protein_coding | deleterious(0.01) | benign(0.285) | TCGA-E2-A15T-01 | Breast | breast invasive carcinoma | Female | >=65 | I/II | Hormone Therapy | arimidex | SD |
| SYNM | SNV | Missense_Mutation | c.2583N>G | p.Ile861Met | p.I861M | O15061 | protein_coding | deleterious(0) | probably_damaging(0.984) | TCGA-GM-A2DO-01 | Breast | breast invasive carcinoma | Female | <65 | I/II | Hormone Therapy | tamoxiphen | CR | |
| SYNM | insertion | Nonsense_Mutation | novel | c.1426_1427insTTTCAGATAAGTGTTAAAT | p.Arg476LeufsTer6 | p.R476Lfs*6 | O15061 | protein_coding | TCGA-A2-A0EQ-01 | Breast | breast invasive carcinoma | Female | <65 | I/II | Chemotherapy | adriamycin | SD | ||
| SYNM | insertion | In_Frame_Ins | novel | c.1399_1400insCTCAAGGGAGAGGCCCCGTGGTACCCGAGG | p.Ile467delinsThrGlnGlyArgGlyProValValProGluVal | p.I467delinsTQGRGPVVPEV | O15061 | protein_coding | TCGA-B6-A0RE-01 | Breast | breast invasive carcinoma | Female | <65 | I/II | Unknown | Unknown | SD | ||
| SYNM | insertion | In_Frame_Ins | novel | c.4355_4356insAGGAGG | p.Ala1452_Pro1453insGlyGly | p.A1452_P1453insGG | O15061 | protein_coding | TCGA-BH-A0AY-01 | Breast | breast invasive carcinoma | Female | <65 | I/II | Chemotherapy | SD | |||
| SYNM | insertion | Frame_Shift_Ins | novel | c.4357_4358insTGAGCGAATGTCATATGAAGGACCCACTG | p.Pro1453LeufsTer24 | p.P1453Lfs*24 | O15061 | protein_coding | TCGA-BH-A0AY-01 | Breast | breast invasive carcinoma | Female | <65 | I/II | Chemotherapy | SD |
| Page: 1 2 3 4 5 6 7 8 9 10 11 12 |
Top |
Related drugs of malignant transformation related genes |
| Identification of chemicals and drugs interact with genes involved in malignant transfromation |
| (DGIdb 4.0) |
| Entrez ID | Symbol | Category | Interaction Types | Drug Claim Name | Drug Name | PMIDs |
| Page: 1 |

Copyright 2023-Present -The University of Texas Health Science Center at Houston |