
|
|||||
|
 | |
| |
| |
| |
| |
| |
|
Gene: SYNGR3 |
Gene summary for SYNGR3 |
| Gene information | Species | Human | Gene symbol | SYNGR3 | Gene ID | 9143 |
| Gene name | synaptogyrin 3 | |
| Gene Alias | SYNGR3 | |
| Cytomap | 16p13.3 | |
| Gene Type | protein-coding | GO ID | GO:0001504 | UniProtAcc | O43761 |
Top |
Malignant transformation analysis |
| Identification of the aberrant gene expression in precancerous and cancerous lesions by comparing the gene expression of stem-like cells in diseased tissues with normal stem cells |
| Entrez ID | Symbol | Replicates | Species | Organ | Tissue | Adj P-value | Log2FC | Malignancy |
| 9143 | SYNGR3 | P1T-E | Human | Esophagus | ESCC | 3.58e-07 | 2.92e-01 | 0.0875 |
| 9143 | SYNGR3 | P2T-E | Human | Esophagus | ESCC | 4.40e-09 | 1.37e-01 | 0.1177 |
| 9143 | SYNGR3 | P23T-E | Human | Esophagus | ESCC | 2.37e-12 | 3.97e-01 | 0.108 |
| 9143 | SYNGR3 | P26T-E | Human | Esophagus | ESCC | 8.40e-04 | 7.35e-02 | 0.1276 |
| 9143 | SYNGR3 | P28T-E | Human | Esophagus | ESCC | 7.31e-14 | 2.64e-01 | 0.1149 |
| 9143 | SYNGR3 | P32T-E | Human | Esophagus | ESCC | 3.41e-36 | 7.24e-01 | 0.1666 |
| 9143 | SYNGR3 | P37T-E | Human | Esophagus | ESCC | 1.87e-02 | 9.96e-02 | 0.1371 |
| 9143 | SYNGR3 | P57T-E | Human | Esophagus | ESCC | 1.66e-02 | 9.26e-02 | 0.0926 |
| 9143 | SYNGR3 | P80T-E | Human | Esophagus | ESCC | 1.35e-22 | 6.23e-01 | 0.155 |
| 9143 | SYNGR3 | P130T-E | Human | Esophagus | ESCC | 9.78e-30 | 5.56e-01 | 0.1676 |
| Page: 1 |
| Tissue | Expression Dynamics | Abbreviation |
| Esophagus | 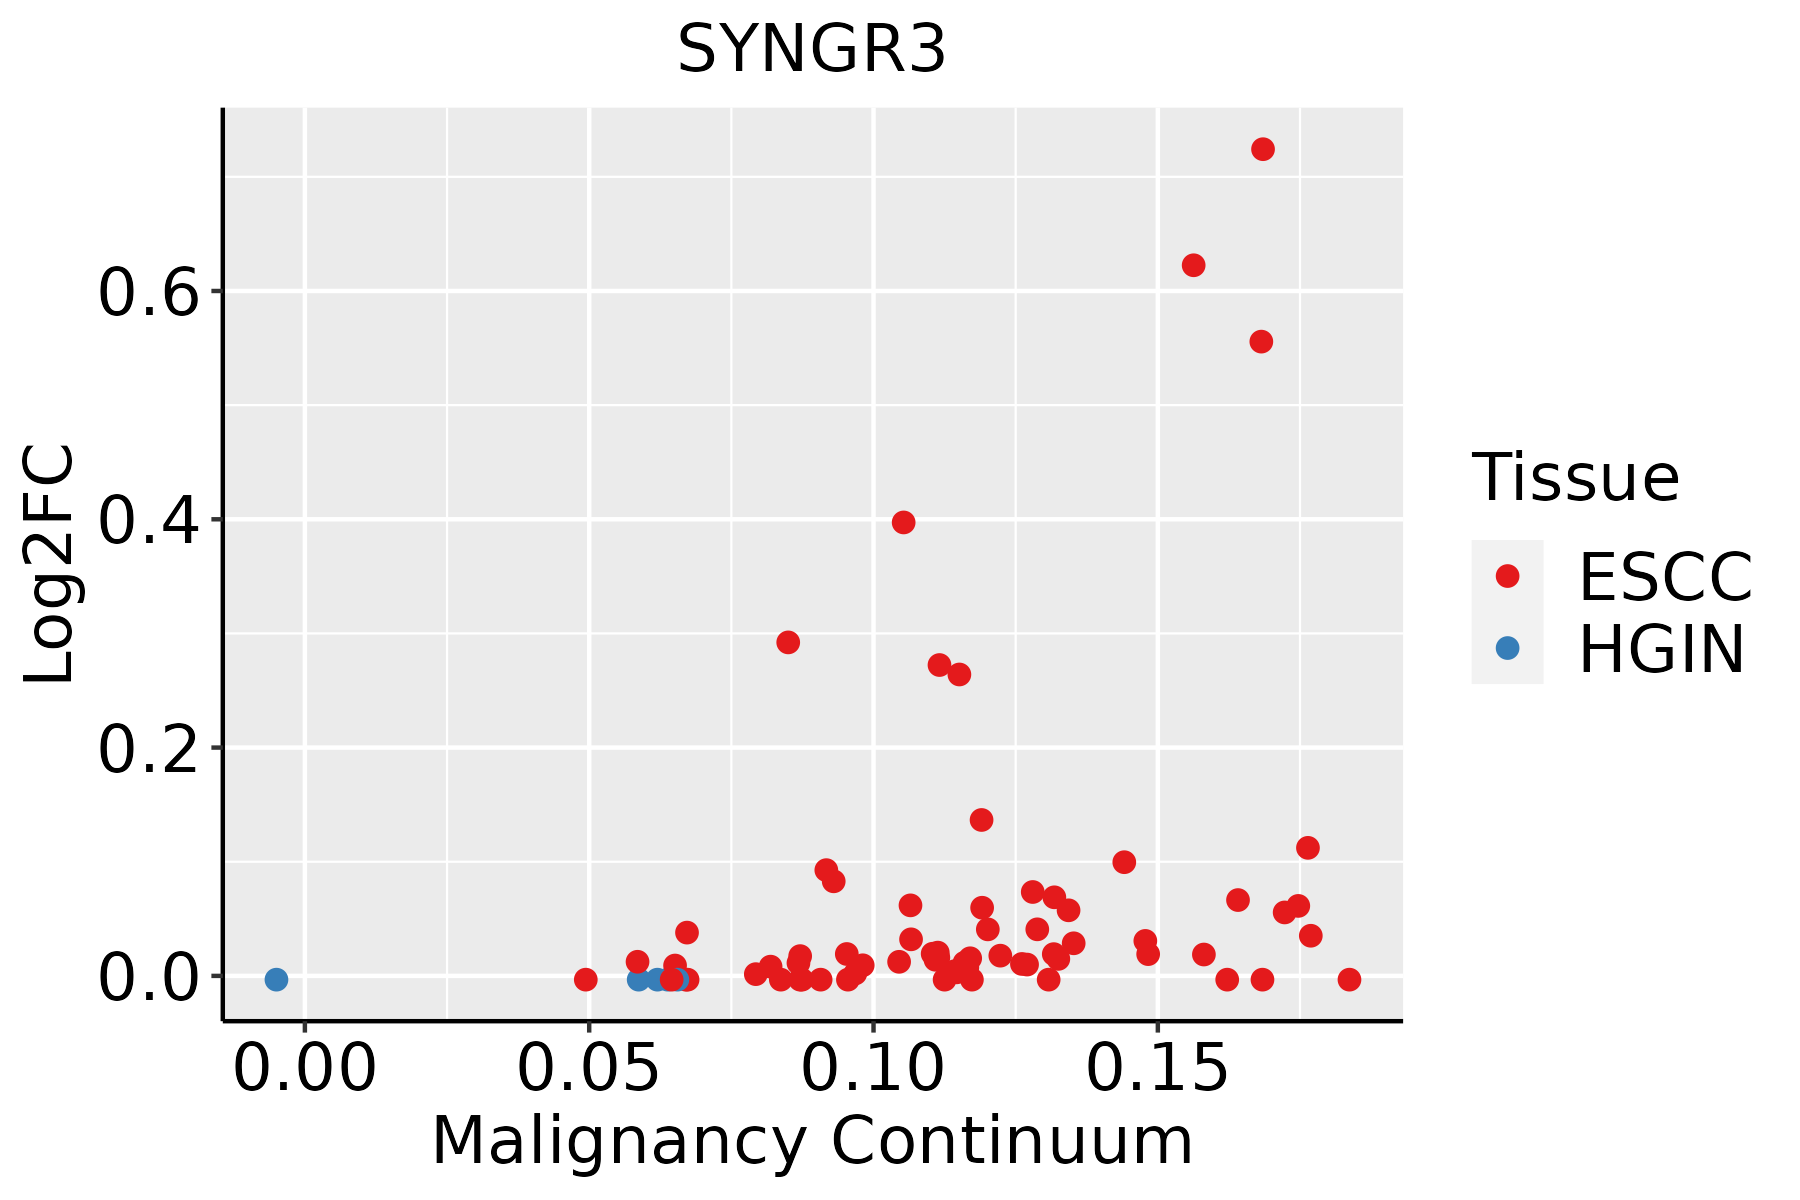 | ESCC: Esophageal squamous cell carcinoma |
| HGIN: High-grade intraepithelial neoplasias | ||
| LGIN: Low-grade intraepithelial neoplasias |
| ∗log2FC in expression of this searched gene in stem-like cells from each diseased tissue sample relative to stem-like cells in normal samples in each tissue plotted against the malignancy continuum. Samples are colored based on if they are from different disease stage. |
Top |
Malignant transformation related pathway analysis |
| Find out the enriched GO biological processes and KEGG pathways involved in transition from healthy to precancer to cancer |
| Tissue | Disease Stage | Enriched GO biological Processes |
| Colorectum | AD |  |
| Colorectum | SER |  |
| Colorectum | MSS |  |
| Colorectum | MSI-H |  |
| Colorectum | FAP |  |
| ∗Top 15 enriched GO BP terms are showed in the bar plot of each disease state in each tissue. Each row represents a significant GO biological process which is colored according to the -log10(p.adjust). |
| Page: 1 2 3 4 5 6 7 8 9 |
| GO ID | Tissue | Disease Stage | Description | Gene Ratio | Bg Ratio | pvalue | p.adjust | Count |
| GO:0021762111 | Esophagus | ESCC | substantia nigra development | 35/8552 | 44/18723 | 4.40e-06 | 4.69e-05 | 35 |
| GO:004885718 | Esophagus | ESCC | neural nucleus development | 44/8552 | 64/18723 | 1.59e-04 | 1.05e-03 | 44 |
| GO:003090118 | Esophagus | ESCC | midbrain development | 58/8552 | 90/18723 | 2.52e-04 | 1.55e-03 | 58 |
| Page: 1 |
| Pathway ID | Tissue | Disease Stage | Description | Gene Ratio | Bg Ratio | pvalue | p.adjust | qvalue | Count |
| Page: 1 |
Top |
Cell-cell communication analysis |
| Identification of potential cell-cell interactions between two cell types and their ligand-receptor pairs for different disease states |
| Ligand | Receptor | LRpair | Pathway | Tissue | Disease Stage |
| Page: 1 |
Top |
Single-cell gene regulatory network inference analysis |
| Find out the significant the regulons (TFs) and the target genes of each regulon across cell types for different disease states |
| TF | Cell Type | Tissue | Disease Stage | Target Gene | RSS | Regulon Activity |
| ∗The dot plots of a searched regulon are shown for all cell subpopulations in each disease state of each tissue based on the regulon specific score inferred using pySCENIC and by calculating the average expression. |
| Page: 1 |
Top |
Somatic mutation of malignant transformation related genes |
| Annotation of somatic variants for genes involved in malignant transformation |
| Hugo Symbol | Variant Class | Variant Classification | dbSNP RS | HGVSc | HGVSp | HGVSp Short | SWISSPROT | BIOTYPE | SIFT | PolyPhen | Tumor Sample Barcode | Tissue | Histology | Sex | Age | Stage | Therapy Types | Drugs | Outcome |
| SYNGR3 | SNV | Missense_Mutation | c.401N>T | p.Ala134Val | p.A134V | O43761 | protein_coding | tolerated(0.14) | benign(0.143) | TCGA-AD-6889-01 | Colorectum | colon adenocarcinoma | Male | >=65 | I/II | Chemotherapy | xeloda | PD | |
| SYNGR3 | SNV | Missense_Mutation | rs367678643 | c.250G>A | p.Ala84Thr | p.A84T | O43761 | protein_coding | deleterious(0.02) | benign(0.143) | TCGA-AD-6895-01 | Colorectum | colon adenocarcinoma | Male | >=65 | III/IV | Unknown | Unknown | SD |
| SYNGR3 | SNV | Missense_Mutation | novel | c.618N>T | p.Glu206Asp | p.E206D | O43761 | protein_coding | tolerated(1) | benign(0.01) | TCGA-A5-A0G1-01 | Endometrium | uterine corpus endometrioid carcinoma | Female | >=65 | I/II | Unknown | Unknown | SD |
| SYNGR3 | SNV | Missense_Mutation | c.397N>G | p.Thr133Ala | p.T133A | O43761 | protein_coding | deleterious(0.04) | possibly_damaging(0.735) | TCGA-BG-A0MQ-01 | Endometrium | uterine corpus endometrioid carcinoma | Female | >=65 | I/II | Unknown | Unknown | SD | |
| SYNGR3 | SNV | Missense_Mutation | novel | c.616N>C | p.Glu206Gln | p.E206Q | O43761 | protein_coding | deleterious(0.01) | possibly_damaging(0.795) | TCGA-2Y-A9GT-01 | Liver | liver hepatocellular carcinoma | Male | <65 | I/II | Unknown | Unknown | PD |
| SYNGR3 | SNV | Missense_Mutation | novel | c.566N>A | p.Ala189Glu | p.A189E | O43761 | protein_coding | tolerated(0.1) | benign(0.412) | TCGA-55-A490-01 | Lung | lung adenocarcinoma | Male | >=65 | I/II | Chemotherapy | carboplatin | SD |
| SYNGR3 | SNV | Missense_Mutation | novel | c.115N>A | p.Val39Ile | p.V39I | O43761 | protein_coding | tolerated(0.11) | probably_damaging(0.997) | TCGA-58-8392-01 | Lung | lung squamous cell carcinoma | Male | >=65 | I/II | Unknown | Unknown | PD |
| SYNGR3 | SNV | Missense_Mutation | c.394N>T | p.Arg132Cys | p.R132C | O43761 | protein_coding | tolerated(0.19) | possibly_damaging(0.877) | TCGA-XK-AAIW-01 | Prostate | prostate adenocarcinoma | Male | >=65 | 9 | Unknown | Unknown | PD | |
| SYNGR3 | SNV | Missense_Mutation | c.668G>A | p.Gly223Glu | p.G223E | O43761 | protein_coding | tolerated(0.08) | probably_damaging(0.946) | TCGA-BR-8483-01 | Stomach | stomach adenocarcinoma | Male | <65 | III/IV | Chemotherapy | 5-fluorouracil | SD | |
| SYNGR3 | SNV | Missense_Mutation | novel | c.115N>A | p.Val39Ile | p.V39I | O43761 | protein_coding | tolerated(0.11) | probably_damaging(0.997) | TCGA-VQ-A91D-01 | Stomach | stomach adenocarcinoma | Male | >=65 | III/IV | Chemotherapy | fluorouracil | PD |
| Page: 1 2 |
Top |
Related drugs of malignant transformation related genes |
| Identification of chemicals and drugs interact with genes involved in malignant transfromation |
| (DGIdb 4.0) |
| Entrez ID | Symbol | Category | Interaction Types | Drug Claim Name | Drug Name | PMIDs |
| Page: 1 |

Copyright 2023-Present -The University of Texas Health Science Center at Houston |