Schematic overview of the cellular and molecular mechanisms involved in the cancer progression, including the proposed cellular and molecular mechanisms in cancer cells trajectory. AT1: alveolar type 1 cells; AT2: alveolar type 2 cells; AAH: atypical adenomatous hyperplasia; AIS: adenocarcinoma in situ; MIA: minimally invasive adenocarcinoma; IA: invasive adenocarcinoma; EMT: epithelial-mesenchymal transition

Home

Download

Statistics

Help

Contact

Center for Computational Systems Medicine
leaf

Gene summary

leaf

Malignant transformation analysis

leaf

Malignant transformation related pathway analysis

leaf

Cell-cell communication analysis

leaf

Single-cell gene regulatory network inference analysis

leaf

Somatic mutation of malignant transformation related genes

leaf

Related drugs of malignant transformation related genes

Gene: SYNGR1

Gene summary for SYNGR1

check button Gene summary.

Gene informationSpeciesHuman
Gene symbol

SYNGR1

Gene ID

9145

Gene namesynaptogyrin 1
Gene AliasSYNGR1
Cytomap22q13.1
Gene Typeprotein-coding
GO ID

GO:0006605

UniProtAcc

O43759


Top

Malignant transformation analysis

check button Identification of the aberrant gene expression in precancerous and cancerous lesions by comparing the gene expression of stem-like cells in diseased tissues with normal stem cells
check button Malignant transformation involving gene list.
Entrez IDSymbolReplicatesSpeciesOrganTissueAdj P-valueLog2FCMalignancy
9145SYNGR1GSM4909281HumanBreastIDC7.40e-225.25e-010.21
9145SYNGR1GSM4909282HumanBreastIDC7.59e-245.37e-01-0.0288
9145SYNGR1GSM4909286HumanBreastIDC1.62e-133.78e-010.1081
9145SYNGR1GSM4909293HumanBreastIDC1.64e-04-1.60e-010.1581
9145SYNGR1GSM4909297HumanBreastIDC2.78e-02-9.87e-020.1517
9145SYNGR1GSM4909308HumanBreastIDC8.77e-04-1.69e-010.158
9145SYNGR1GSM4909311HumanBreastIDC3.24e-05-1.14e-010.1534
9145SYNGR1GSM4909312HumanBreastIDC4.48e-02-6.89e-020.1552
9145SYNGR1GSM4909319HumanBreastIDC5.58e-12-6.14e-020.1563
9145SYNGR1GSM4909320HumanBreastIDC1.80e-041.38e-010.1575
9145SYNGR1NCCBC14HumanBreastDCIS9.14e-03-2.22e-020.2021
9145SYNGR1NCCBC5HumanBreastDCIS5.77e-04-1.28e-010.2046
9145SYNGR1P1HumanBreastIDC1.83e-05-9.29e-020.1527
9145SYNGR1DCIS2HumanBreastDCIS2.07e-391.53e-010.0085
9145SYNGR1LZE2THumanEsophagusESCC1.50e-032.96e-010.082
9145SYNGR1LZE4THumanEsophagusESCC2.38e-025.38e-020.0811
9145SYNGR1LZE24THumanEsophagusESCC6.75e-133.08e-010.0596
9145SYNGR1LZE21THumanEsophagusESCC5.52e-042.47e-010.0655
9145SYNGR1P1T-EHumanEsophagusESCC6.50e-042.80e-010.0875
9145SYNGR1P2T-EHumanEsophagusESCC4.27e-335.70e-010.1177
Page: 1 2 3 4 5 6 

check button Transcriptomic changes along malignancy continuum.
TissueExpression DynamicsAbbreviation
BreastThe image shows the transcriptomic changes along malignancy continuum.log2FC in expression of this searched gene in stem-like cells from each diseased tissue sample relative to stem-like cells in normal samples in each tissue plotted against the malignancy continuum. Samples are colored based on if they are from different disease stage.
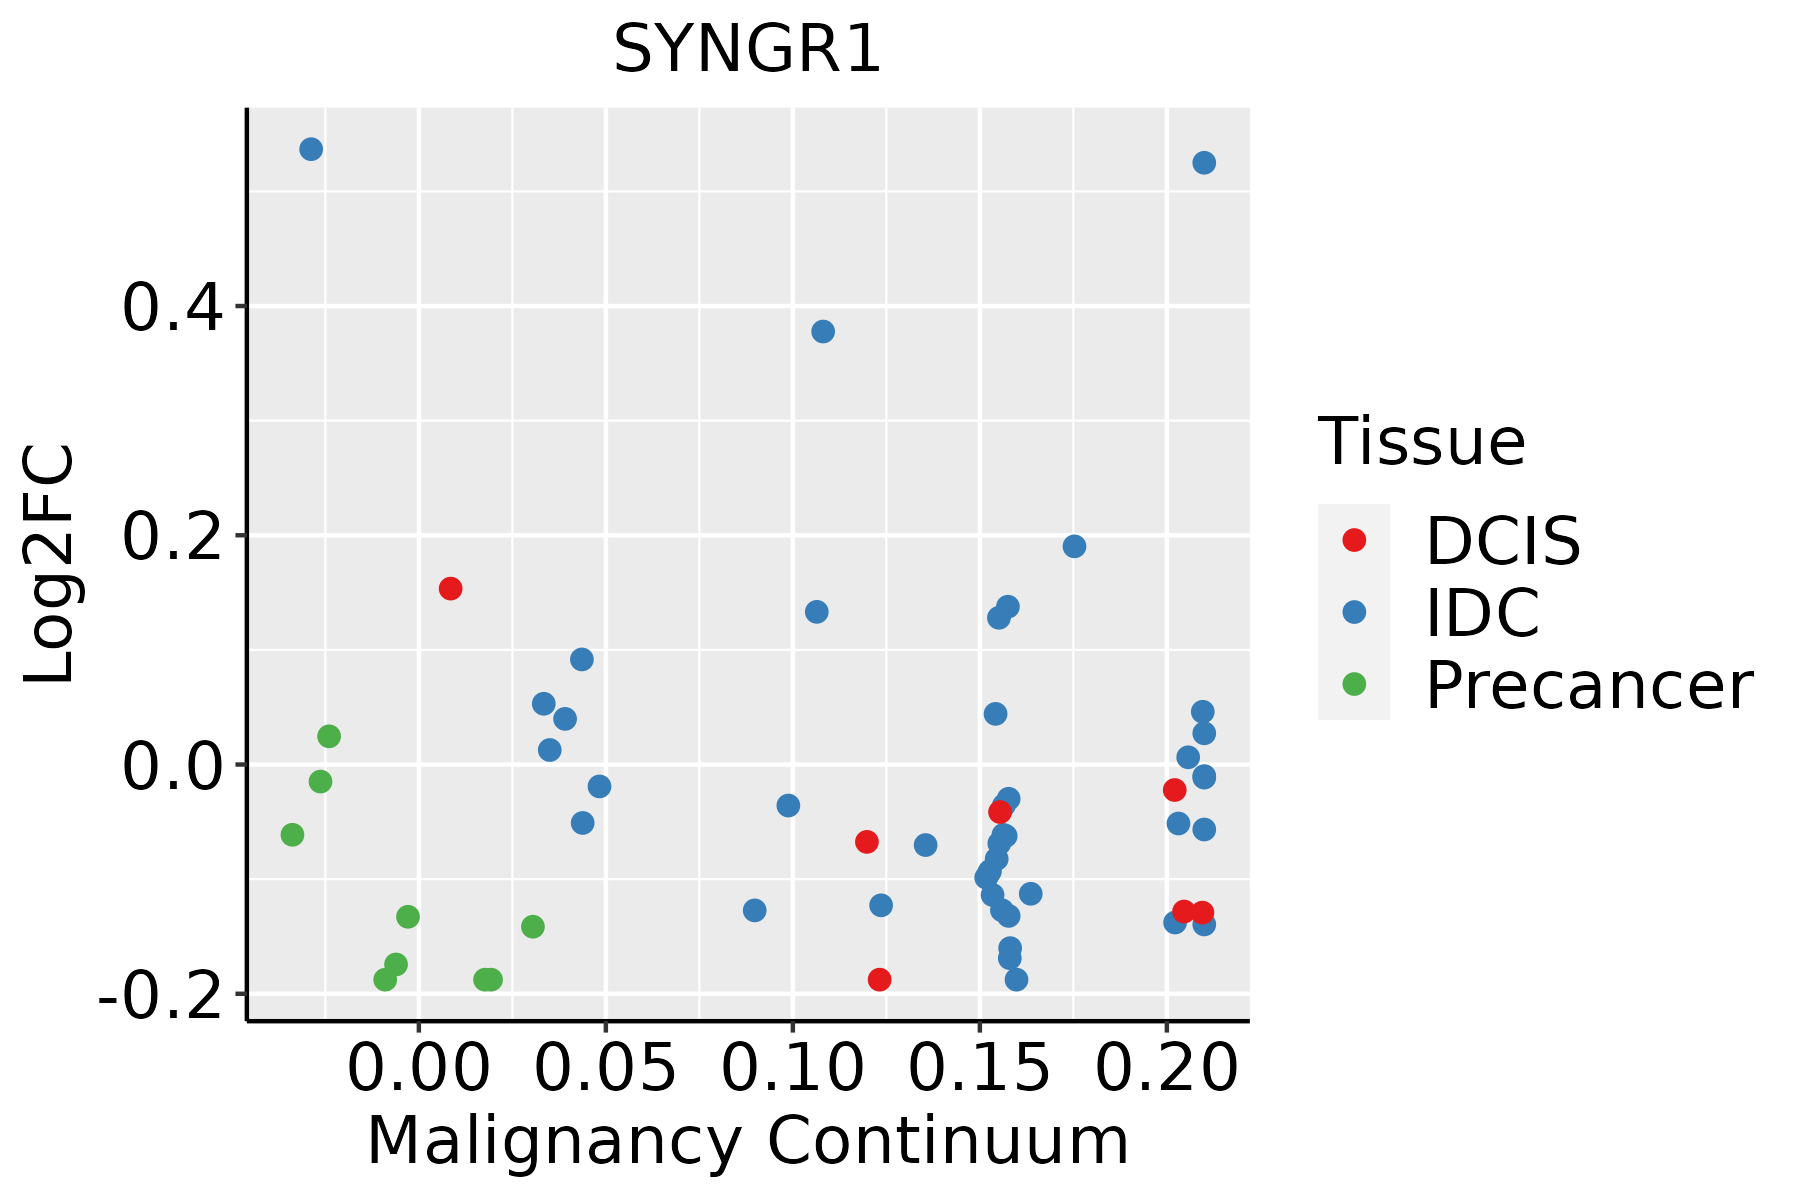
IDC: Invasive ductal carcinoma
DCIS: Ductal carcinoma in situ
Precancer(BRCA1-mut): Precancerous lesion from BRCA1 mutation carriers
EsophagusThe image shows the transcriptomic changes along malignancy continuum.log2FC in expression of this searched gene in stem-like cells from each diseased tissue sample relative to stem-like cells in normal samples in each tissue plotted against the malignancy continuum. Samples are colored based on if they are from different disease stage.ESCC: Esophageal squamous cell carcinoma
HGIN: High-grade intraepithelial neoplasias
LGIN: Low-grade intraepithelial neoplasias
LiverThe image shows the transcriptomic changes along malignancy continuum.log2FC in expression of this searched gene in stem-like cells from each diseased tissue sample relative to stem-like cells in normal samples in each tissue plotted against the malignancy continuum. Samples are colored based on if they are from different disease stage.HCC: Hepatocellular carcinoma
NAFLD: Non-alcoholic fatty liver disease
Oral CavityThe image shows the transcriptomic changes along malignancy continuum.log2FC in expression of this searched gene in stem-like cells from each diseased tissue sample relative to stem-like cells in normal samples in each tissue plotted against the malignancy continuum. Samples are colored based on if they are from different disease stage.
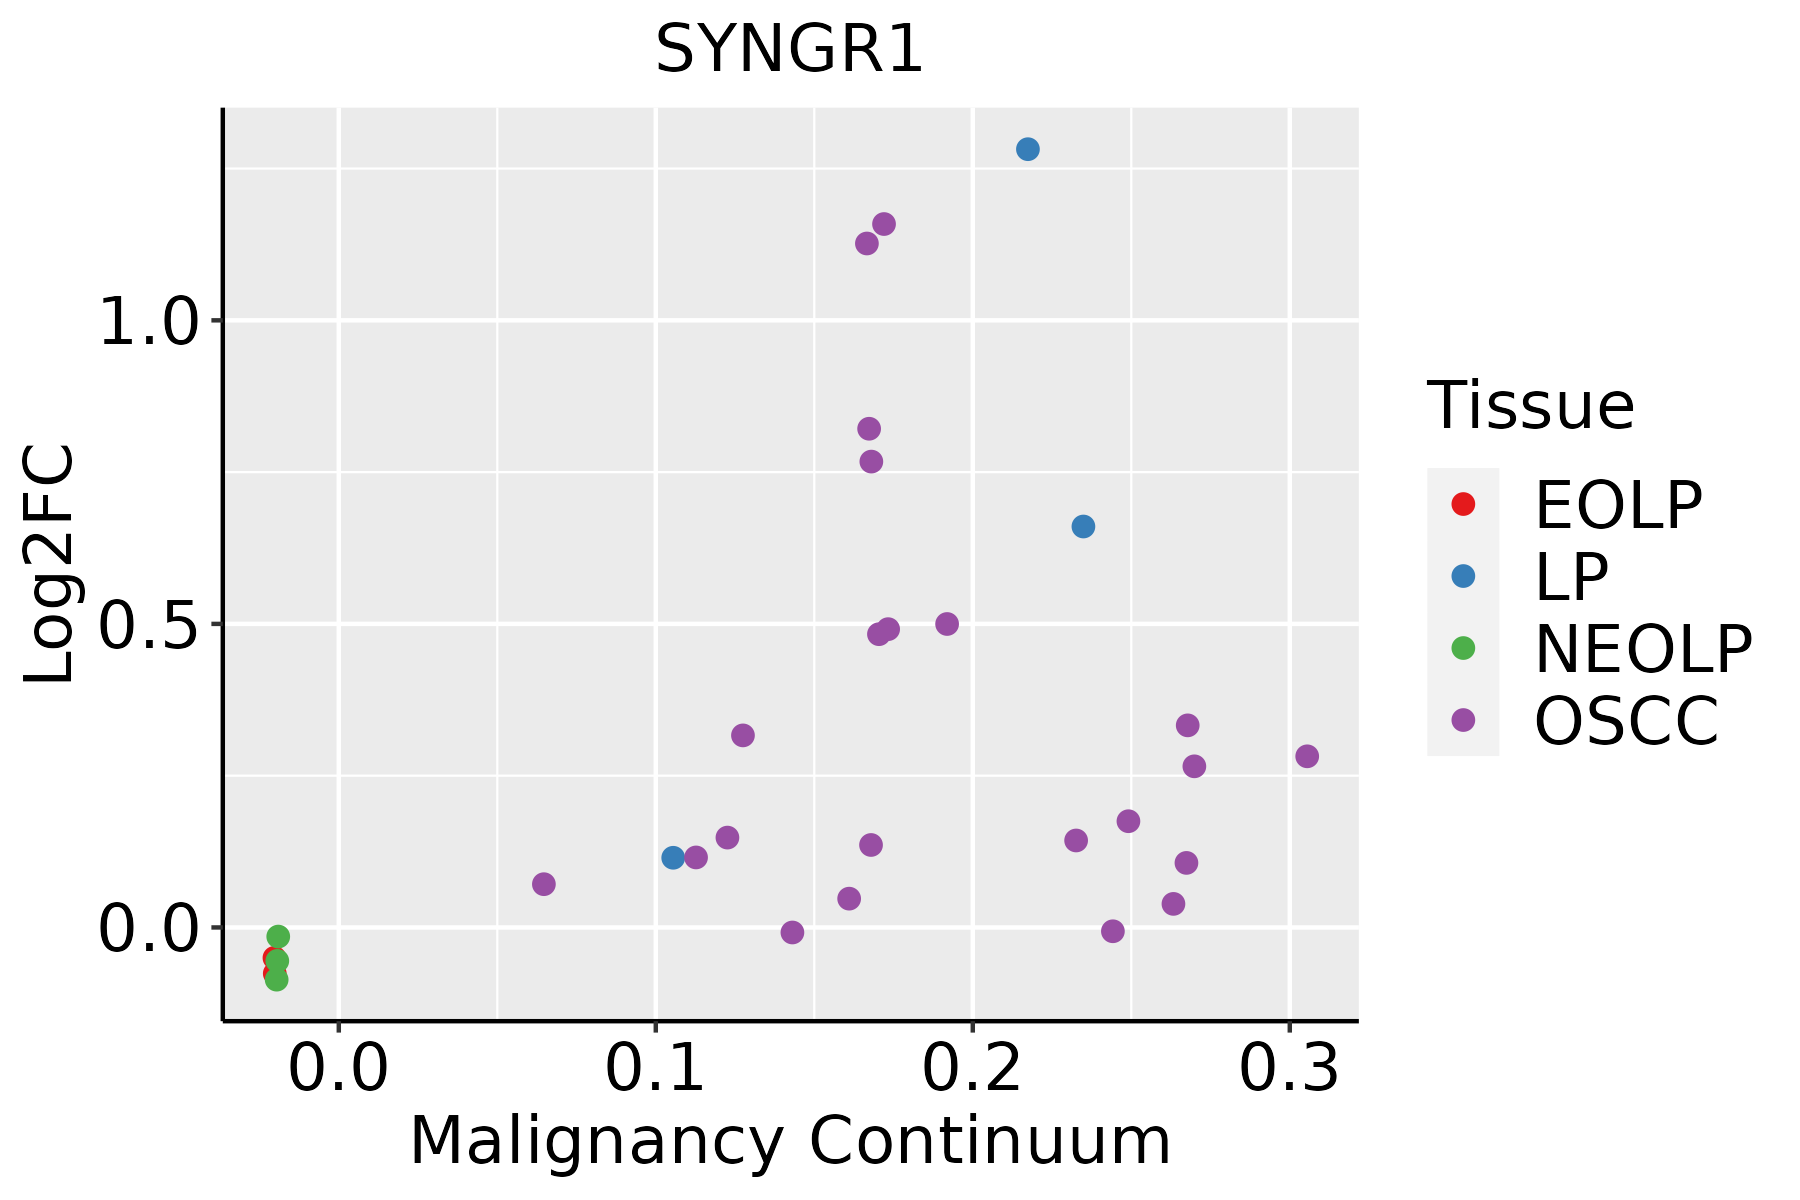
EOLP: Erosive Oral lichen planus
LP: leukoplakia
NEOLP: Non-erosive oral lichen planus
OSCC: Oral squamous cell carcinoma
SkinThe image shows the transcriptomic changes along malignancy continuum.log2FC in expression of this searched gene in stem-like cells from each diseased tissue sample relative to stem-like cells in normal samples in each tissue plotted against the malignancy continuum. Samples are colored based on if they are from different disease stage.AK: Actinic keratosis
cSCC: Cutaneous squamous cell carcinoma
SCCIS:squamous cell carcinoma in situ
∗log2FC in expression of this searched gene in stem-like cells from each diseased tissue sample relative to stem-like cells in normal samples in each tissue plotted against the malignancy continuum. Samples are colored based on if they are from different disease stage.

Top

Malignant transformation related pathway analysis

check buttonFind out the enriched GO biological processes and KEGG pathways involved in transition from healthy to precancer to cancer
check button Figure of enriched GO biological processes.
TissueDisease StageEnriched GO biological Processes
ColorectumADGO analysis - Figure of enriched GO biological processes: Top 15 enriched GO BP terms are showed in the bar plot of each disease state in each tissue. Each row represents a significant GO biological process which is colored according to the -log10(p.adjust).
ColorectumSERGO analysis - Figure of enriched GO biological processes: Top 15 enriched GO BP terms are showed in the bar plot of each disease state in each tissue. Each row represents a significant GO biological process which is colored according to the -log10(p.adjust).
ColorectumMSSGO analysis - Figure of enriched GO biological processes: Top 15 enriched GO BP terms are showed in the bar plot of each disease state in each tissue. Each row represents a significant GO biological process which is colored according to the -log10(p.adjust).
ColorectumMSI-HGO analysis - Figure of enriched GO biological processes: Top 15 enriched GO BP terms are showed in the bar plot of each disease state in each tissue. Each row represents a significant GO biological process which is colored according to the -log10(p.adjust).
ColorectumFAPGO analysis - Figure of enriched GO biological processes: Top 15 enriched GO BP terms are showed in the bar plot of each disease state in each tissue. Each row represents a significant GO biological process which is colored according to the -log10(p.adjust).
∗Top 15 enriched GO BP terms are showed in the bar plot of each disease state in each tissue. Each row represents a significant GO biological process which is colored according to the -log10(p.adjust).
Page: 1 2 3 4 5 6 7 8 9 

check button Enriched GO biological processes.
GO IDTissueDisease StageDescriptionGene RatioBg Ratiopvaluep.adjustCount
GO:000660514BreastIDCprotein targeting43/1434314/187231.44e-042.53e-0343
GO:19908301BreastIDCcellular response to leukemia inhibitory factor15/143494/187235.06e-033.79e-0215
GO:199082311BreastIDCresponse to leukemia inhibitory factor15/143495/187235.59e-034.07e-0215
GO:000660523BreastDCISprotein targeting43/1390314/187237.17e-051.41e-0343
GO:19908302BreastDCIScellular response to leukemia inhibitory factor15/139094/187233.79e-033.03e-0215
GO:19908232BreastDCISresponse to leukemia inhibitory factor15/139095/187234.20e-033.31e-0215
GO:0006605111EsophagusESCCprotein targeting229/8552314/187234.93e-231.01e-20229
GO:199082316EsophagusESCCresponse to leukemia inhibitory factor60/855295/187234.41e-042.48e-0360
GO:199083015EsophagusESCCcellular response to leukemia inhibitory factor59/855294/187236.19e-043.32e-0359
GO:00066057LiverCirrhoticprotein targeting148/4634314/187233.86e-186.20e-16148
GO:000660512LiverHCCprotein targeting219/7958314/187237.74e-231.49e-20219
GO:000660520Oral cavityOSCCprotein targeting204/7305314/187236.78e-211.13e-18204
GO:19908237Oral cavityOSCCresponse to leukemia inhibitory factor58/730595/187231.10e-051.14e-0458
GO:19908307Oral cavityOSCCcellular response to leukemia inhibitory factor57/730594/187231.75e-051.71e-0457
GO:0006605110Oral cavityLPprotein targeting156/4623314/187235.43e-221.62e-19156
GO:000660527SkincSCCprotein targeting153/4864314/187232.62e-183.36e-16153
GO:199082317SkincSCCresponse to leukemia inhibitory factor42/486495/187238.79e-058.27e-0442
GO:199083016SkincSCCcellular response to leukemia inhibitory factor41/486494/187231.53e-041.35e-0341
Page: 1 

check button Enriched KEGG pathways.
Pathway IDTissueDisease StageDescriptionGene RatioBg Ratiopvaluep.adjustqvalueCount
Page: 1 

Top

Cell-cell communication analysis

check buttonIdentification of potential cell-cell interactions between two cell types and their ligand-receptor pairs for different disease states
LigandReceptorLRpairPathwayTissueDisease Stage
Page: 1 

Top

Single-cell gene regulatory network inference analysis

check buttonFind out the significant the regulons (TFs) and the target genes of each regulon across cell types for different disease states
TFCell TypeTissueDisease StageTarget GeneRSSRegulon Activity
∗The dot plots of a searched regulon are shown for all cell subpopulations in each disease state of each tissue based on the regulon specific score inferred using pySCENIC and by calculating the average expression.
Page: 1 

Top

Somatic mutation of malignant transformation related genes

check buttonAnnotation of somatic variants for genes involved in malignant transformation
Hugo SymbolVariant ClassVariant ClassificationdbSNP RSHGVScHGVSpHGVSp ShortSWISSPROTBIOTYPESIFTPolyPhenTumor Sample BarcodeTissueHistologySexAgeStageTherapy TypesDrugsOutcome
SYNGR1SNVMissense_Mutationc.285N>Gp.Ile95Metp.I95MO43759protein_codingtolerated(0.07)possibly_damaging(0.81)TCGA-JW-A5VL-01Cervixcervical & endocervical cancerFemale<65I/IIUnknownUnknownSD
SYNGR1SNVMissense_Mutationrs774993653c.188G>Ap.Arg63Hisp.R63HO43759protein_codingtolerated(0.32)benign(0.042)TCGA-A5-A0G2-01Endometriumuterine corpus endometrioid carcinomaFemale<65III/IVUnknownUnknownSD
SYNGR1SNVMissense_Mutationnovelc.689N>Gp.Ser230Trpp.S230WO43759protein_codingdeleterious(0.03)possibly_damaging(0.487)TCGA-AJ-A3EM-01Endometriumuterine corpus endometrioid carcinomaFemale>=65I/IIUnknownUnknownSD
SYNGR1SNVMissense_Mutationc.311C>Tp.Ala104Valp.A104VO43759protein_codingtolerated(0.54)benign(0.174)TCGA-AP-A059-01Endometriumuterine corpus endometrioid carcinomaFemale>=65I/IIUnknownUnknownSD
SYNGR1SNVMissense_Mutationnovelc.611G>Tp.Gly204Valp.G204VO43759protein_codingtolerated(0.44)benign(0.127)TCGA-AP-A0LP-01Endometriumuterine corpus endometrioid carcinomaFemale>=65I/IIHormone TherapymegaceSD
SYNGR1SNVMissense_Mutationrs774993653c.188N>Ap.Arg63Hisp.R63HO43759protein_codingtolerated(0.32)benign(0.042)TCGA-AP-A1E0-01Endometriumuterine corpus endometrioid carcinomaFemale<65III/IVChemotherapypaclitaxelSD
SYNGR1SNVMissense_Mutationrs541640344c.454G>Ap.Ala152Thrp.A152TO43759protein_codingtolerated(0.83)benign(0.003)TCGA-AX-A2HD-01Endometriumuterine corpus endometrioid carcinomaFemale>=65III/IVUnknownUnknownSD
SYNGR1SNVMissense_Mutationnovelc.347N>Ap.Ala116Aspp.A116DO43759protein_codingdeleterious(0)probably_damaging(0.945)TCGA-B5-A3FA-01Endometriumuterine corpus endometrioid carcinomaFemale>=65I/IIUnknownUnknownSD
SYNGR1SNVMissense_Mutationc.302N>Ap.Arg101Hisp.R101HO43759protein_codingdeleterious(0)probably_damaging(0.992)TCGA-D1-A103-01Endometriumuterine corpus endometrioid carcinomaFemale>=65I/IIUnknownUnknownSD
SYNGR1SNVMissense_Mutationnovelc.196N>Gp.Asn66Aspp.N66DO43759protein_codingtolerated(1)benign(0.017)TCGA-DF-A2KN-01Endometriumuterine corpus endometrioid carcinomaFemaleUnknownI/IIUnknownUnknownSD
Page: 1 2 3 

Top

Related drugs of malignant transformation related genes

check buttonIdentification of chemicals and drugs interact with genes involved in malignant transfromation
(DGIdb 4.0)
Entrez IDSymbolCategoryInteraction TypesDrug Claim NameDrug NamePMIDs
Page: 1