
|
|||||
|
 | |
| |
| |
| |
| |
| |
|
Gene: SYNE4 |
Gene summary for SYNE4 |
| Gene information | Species | Human | Gene symbol | SYNE4 | Gene ID | 163183 |
| Gene name | spectrin repeat containing nuclear envelope family member 4 | |
| Gene Alias | C19orf46 | |
| Cytomap | 19q13.12 | |
| Gene Type | protein-coding | GO ID | GO:0001738 | UniProtAcc | Q8N205 |
Top |
Malignant transformation analysis |
| Identification of the aberrant gene expression in precancerous and cancerous lesions by comparing the gene expression of stem-like cells in diseased tissues with normal stem cells |
| Entrez ID | Symbol | Replicates | Species | Organ | Tissue | Adj P-value | Log2FC | Malignancy |
| 163183 | SYNE4 | P10T-E | Human | Esophagus | ESCC | 8.40e-04 | 8.84e-02 | 0.116 |
| 163183 | SYNE4 | P24T-E | Human | Esophagus | ESCC | 9.56e-08 | 1.29e-01 | 0.1287 |
| 163183 | SYNE4 | P36T-E | Human | Esophagus | ESCC | 2.64e-02 | 1.62e-01 | 0.1187 |
| 163183 | SYNE4 | P38T-E | Human | Esophagus | ESCC | 5.57e-13 | 5.18e-01 | 0.127 |
| 163183 | SYNE4 | P57T-E | Human | Esophagus | ESCC | 1.26e-12 | 2.30e-01 | 0.0926 |
| 163183 | SYNE4 | P65T-E | Human | Esophagus | ESCC | 1.11e-03 | 3.75e-02 | 0.0978 |
| 163183 | SYNE4 | P74T-E | Human | Esophagus | ESCC | 1.11e-27 | 6.94e-01 | 0.1479 |
| 163183 | SYNE4 | P75T-E | Human | Esophagus | ESCC | 3.28e-14 | 2.48e-01 | 0.1125 |
| 163183 | SYNE4 | P76T-E | Human | Esophagus | ESCC | 2.86e-20 | 3.66e-01 | 0.1207 |
| 163183 | SYNE4 | P79T-E | Human | Esophagus | ESCC | 6.56e-15 | 2.81e-01 | 0.1154 |
| 163183 | SYNE4 | P82T-E | Human | Esophagus | ESCC | 2.14e-02 | 1.99e-01 | 0.1072 |
| 163183 | SYNE4 | P128T-E | Human | Esophagus | ESCC | 1.62e-31 | 8.59e-01 | 0.1241 |
| 163183 | SYNE4 | P130T-E | Human | Esophagus | ESCC | 5.03e-37 | 7.60e-01 | 0.1676 |
| 163183 | SYNE4 | HCC1_Meng | Human | Liver | HCC | 2.65e-83 | 2.28e-01 | 0.0246 |
| 163183 | SYNE4 | cirrhotic1 | Human | Liver | Cirrhotic | 1.00e-04 | 9.65e-02 | 0.0202 |
| 163183 | SYNE4 | cirrhotic2 | Human | Liver | Cirrhotic | 2.12e-02 | 7.77e-02 | 0.0201 |
| 163183 | SYNE4 | HCC1 | Human | Liver | HCC | 5.59e-29 | 1.52e+00 | 0.5336 |
| 163183 | SYNE4 | S027 | Human | Liver | HCC | 7.74e-08 | 7.18e-01 | 0.2446 |
| 163183 | SYNE4 | S028 | Human | Liver | HCC | 1.53e-16 | 9.00e-01 | 0.2503 |
| 163183 | SYNE4 | S029 | Human | Liver | HCC | 1.14e-15 | 9.56e-01 | 0.2581 |
| Page: 1 |
| Tissue | Expression Dynamics | Abbreviation |
| Esophagus | 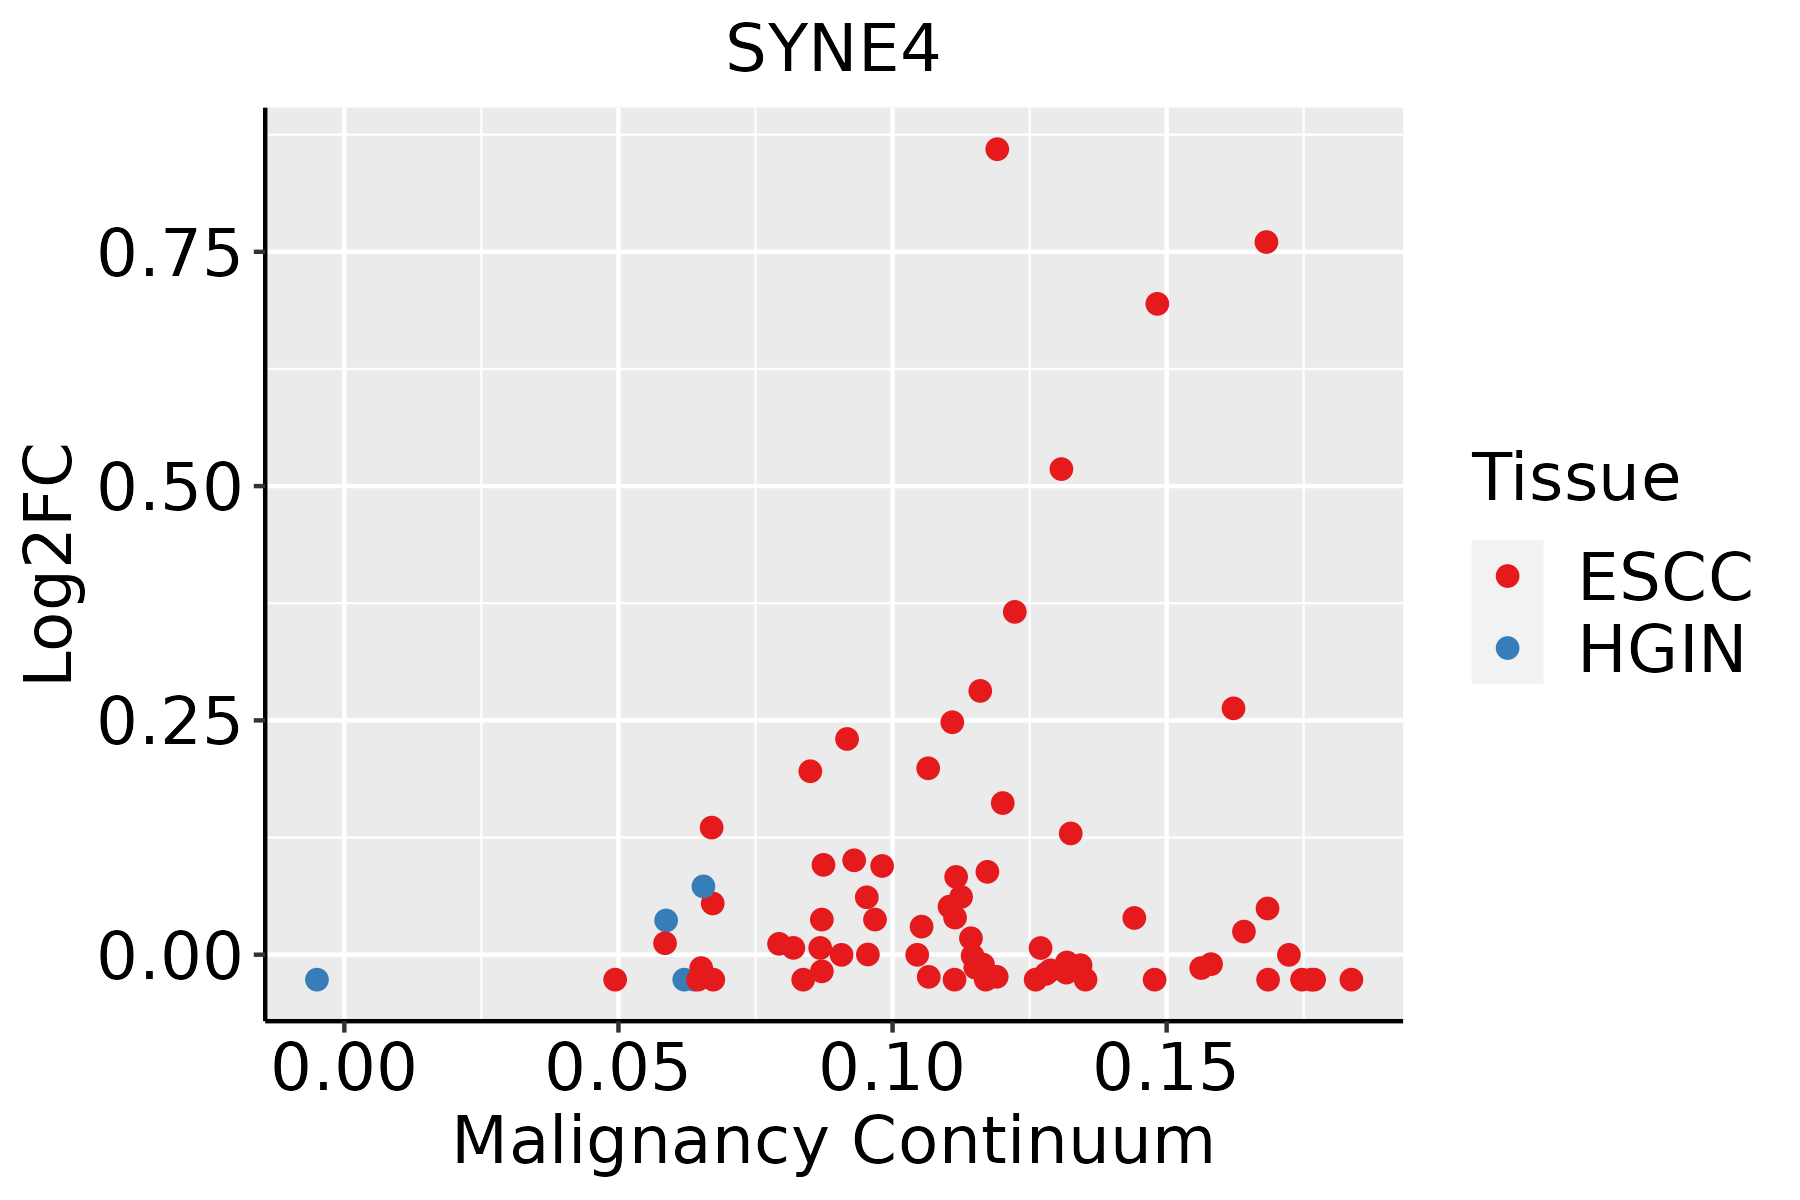 | ESCC: Esophageal squamous cell carcinoma |
| HGIN: High-grade intraepithelial neoplasias | ||
| LGIN: Low-grade intraepithelial neoplasias | ||
| Liver | 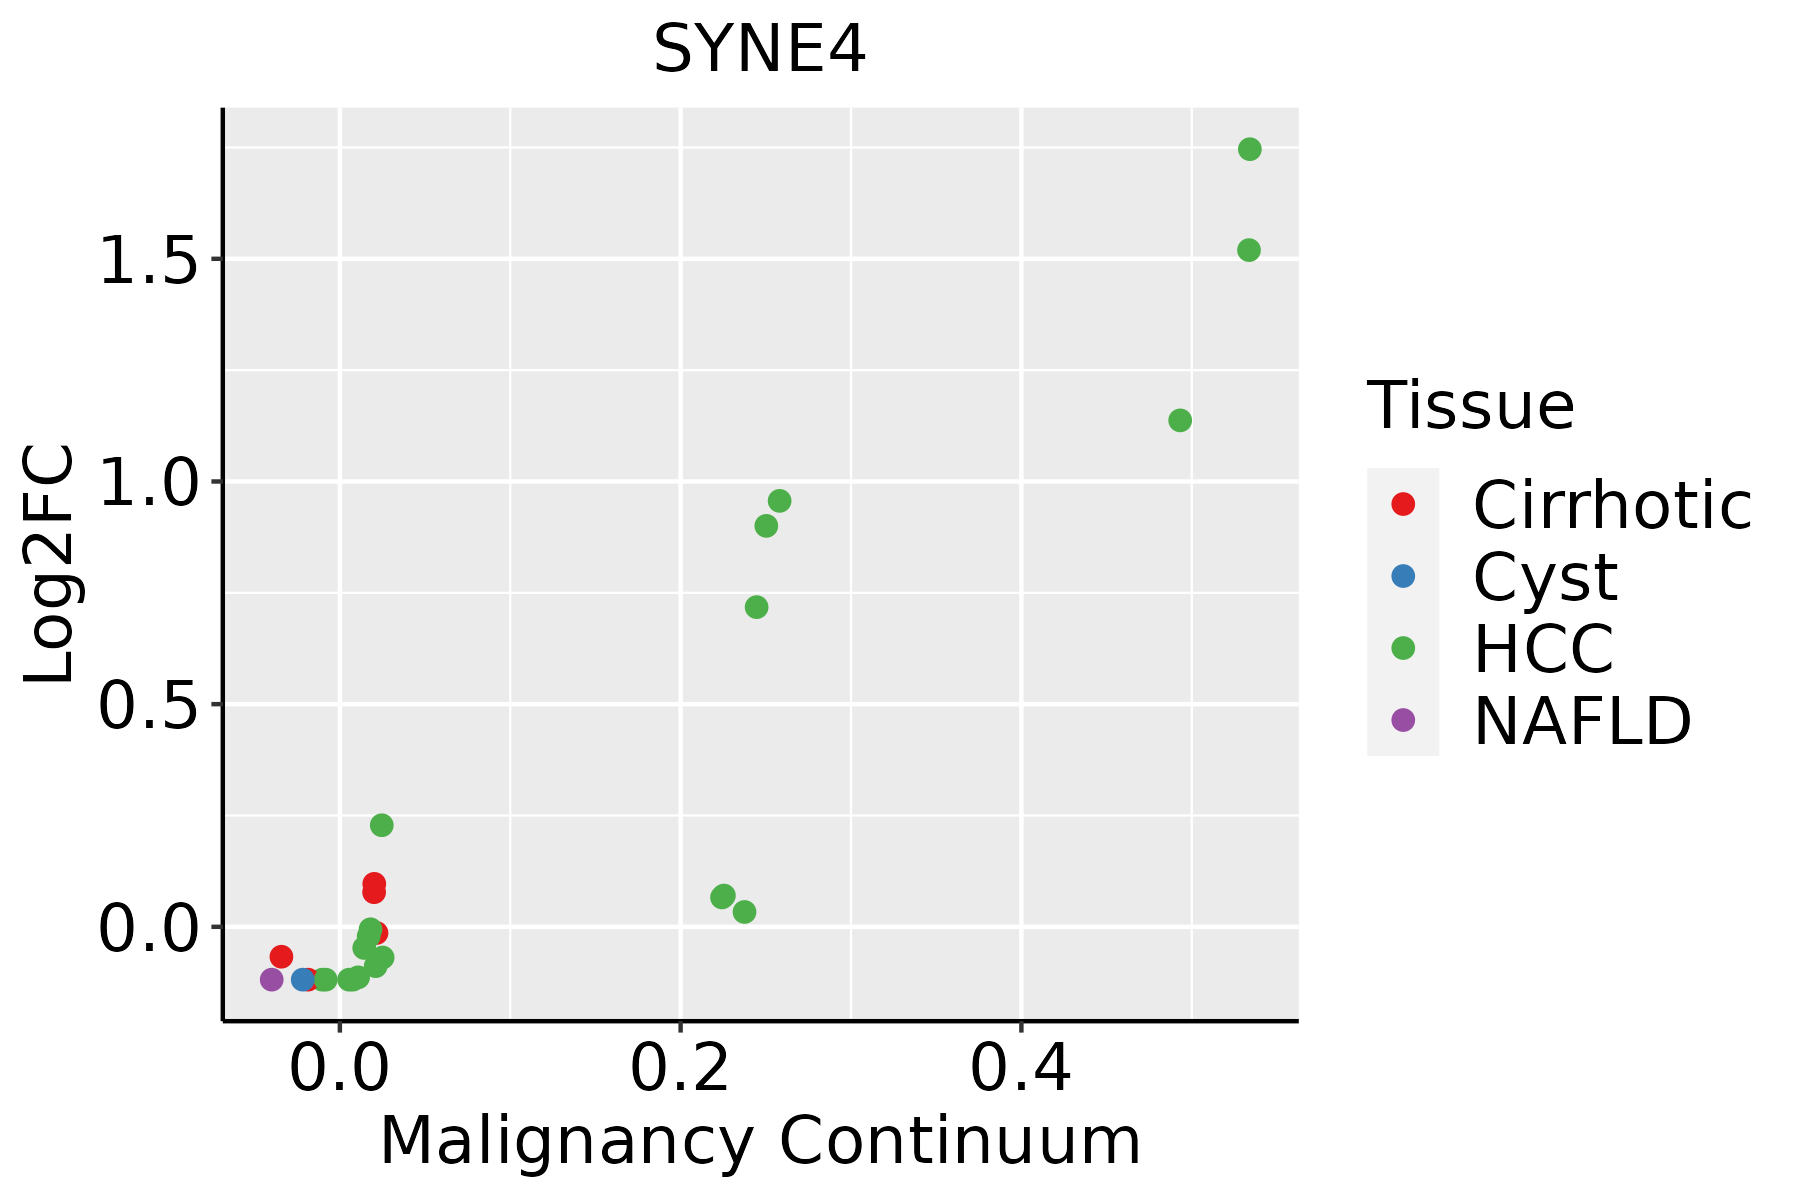 | HCC: Hepatocellular carcinoma |
| NAFLD: Non-alcoholic fatty liver disease |
| ∗log2FC in expression of this searched gene in stem-like cells from each diseased tissue sample relative to stem-like cells in normal samples in each tissue plotted against the malignancy continuum. Samples are colored based on if they are from different disease stage. |
Top |
Malignant transformation related pathway analysis |
| Find out the enriched GO biological processes and KEGG pathways involved in transition from healthy to precancer to cancer |
| Tissue | Disease Stage | Enriched GO biological Processes |
| Colorectum | AD |  |
| Colorectum | SER |  |
| Colorectum | MSS |  |
| Colorectum | MSI-H |  |
| Colorectum | FAP |  |
| ∗Top 15 enriched GO BP terms are showed in the bar plot of each disease state in each tissue. Each row represents a significant GO biological process which is colored according to the -log10(p.adjust). |
| Page: 1 2 3 4 5 6 7 8 9 |
| GO ID | Tissue | Disease Stage | Description | Gene Ratio | Bg Ratio | pvalue | p.adjust | Count |
| GO:000716320 | Esophagus | ESCC | establishment or maintenance of cell polarity | 143/8552 | 218/18723 | 2.05e-09 | 4.65e-08 | 143 |
| GO:003001018 | Esophagus | ESCC | establishment of cell polarity | 96/8552 | 143/18723 | 1.69e-07 | 2.67e-06 | 96 |
| GO:00017387 | Esophagus | ESCC | morphogenesis of a polarized epithelium | 63/8552 | 94/18723 | 2.34e-05 | 2.00e-04 | 63 |
| GO:009016216 | Esophagus | ESCC | establishment of epithelial cell polarity | 25/8552 | 31/18723 | 7.13e-05 | 5.38e-04 | 25 |
| GO:00308595 | Esophagus | ESCC | polarized epithelial cell differentiation | 20/8552 | 24/18723 | 1.69e-04 | 1.11e-03 | 20 |
| GO:00611625 | Esophagus | ESCC | establishment of monopolar cell polarity | 20/8552 | 24/18723 | 1.69e-04 | 1.11e-03 | 20 |
| GO:00613394 | Esophagus | ESCC | establishment or maintenance of monopolar cell polarity | 20/8552 | 25/18723 | 4.81e-04 | 2.69e-03 | 20 |
| GO:00350893 | Esophagus | ESCC | establishment of apical/basal cell polarity | 18/8552 | 22/18723 | 5.69e-04 | 3.10e-03 | 18 |
| GO:0045198 | Esophagus | ESCC | establishment of epithelial cell apical/basal polarity | 14/8552 | 17/18723 | 2.22e-03 | 9.78e-03 | 14 |
| GO:00350888 | Esophagus | ESCC | establishment or maintenance of apical/basal cell polarity | 32/8552 | 49/18723 | 4.39e-03 | 1.73e-02 | 32 |
| GO:00612458 | Esophagus | ESCC | establishment or maintenance of bipolar cell polarity | 32/8552 | 49/18723 | 4.39e-03 | 1.73e-02 | 32 |
| GO:00451978 | Esophagus | ESCC | establishment or maintenance of epithelial cell apical/basal polarity | 29/8552 | 44/18723 | 5.41e-03 | 2.02e-02 | 29 |
| GO:000716312 | Liver | Cirrhotic | establishment or maintenance of cell polarity | 82/4634 | 218/18723 | 1.55e-05 | 2.11e-04 | 82 |
| GO:00901625 | Liver | Cirrhotic | establishment of epithelial cell polarity | 14/4634 | 31/18723 | 1.05e-02 | 4.65e-02 | 14 |
| GO:003001012 | Liver | Cirrhotic | establishment of cell polarity | 48/4634 | 143/18723 | 1.09e-02 | 4.79e-02 | 48 |
| GO:000716322 | Liver | HCC | establishment or maintenance of cell polarity | 133/7958 | 218/18723 | 2.48e-08 | 5.73e-07 | 133 |
| GO:003001022 | Liver | HCC | establishment of cell polarity | 82/7958 | 143/18723 | 2.38e-04 | 1.79e-03 | 82 |
| Page: 1 |
| Pathway ID | Tissue | Disease Stage | Description | Gene Ratio | Bg Ratio | pvalue | p.adjust | qvalue | Count |
| Page: 1 |
Top |
Cell-cell communication analysis |
| Identification of potential cell-cell interactions between two cell types and their ligand-receptor pairs for different disease states |
| Ligand | Receptor | LRpair | Pathway | Tissue | Disease Stage |
| Page: 1 |
Top |
Single-cell gene regulatory network inference analysis |
| Find out the significant the regulons (TFs) and the target genes of each regulon across cell types for different disease states |
| TF | Cell Type | Tissue | Disease Stage | Target Gene | RSS | Regulon Activity |
| ∗The dot plots of a searched regulon are shown for all cell subpopulations in each disease state of each tissue based on the regulon specific score inferred using pySCENIC and by calculating the average expression. |
| Page: 1 |
Top |
Somatic mutation of malignant transformation related genes |
| Annotation of somatic variants for genes involved in malignant transformation |
| Hugo Symbol | Variant Class | Variant Classification | dbSNP RS | HGVSc | HGVSp | HGVSp Short | SWISSPROT | BIOTYPE | SIFT | PolyPhen | Tumor Sample Barcode | Tissue | Histology | Sex | Age | Stage | Therapy Types | Drugs | Outcome |
| SYNE4 | SNV | Missense_Mutation | novel | c.32N>A | p.Leu11His | p.L11H | Q8N205 | protein_coding | tolerated_low_confidence(0.05) | benign(0.003) | TCGA-AC-A6IW-01 | Breast | breast invasive carcinoma | Female | >=65 | I/II | Unknown | Unknown | SD |
| SYNE4 | SNV | Missense_Mutation | c.1148N>G | p.Ser383Cys | p.S383C | Q8N205 | protein_coding | deleterious(0.04) | benign(0.043) | TCGA-AO-A0J4-01 | Breast | breast invasive carcinoma | Female | <65 | I/II | Chemotherapy | doxorubicin | SD | |
| SYNE4 | SNV | Missense_Mutation | rs543896789 | c.356N>A | p.Arg119Gln | p.R119Q | Q8N205 | protein_coding | tolerated(0.58) | benign(0.01) | TCGA-AQ-A54N-01 | Breast | breast invasive carcinoma | Female | <65 | I/II | Unknown | Unknown | SD |
| SYNE4 | SNV | Missense_Mutation | novel | c.488G>T | p.Gly163Val | p.G163V | Q8N205 | protein_coding | tolerated(0.07) | probably_damaging(0.999) | TCGA-DS-A1OA-01 | Cervix | cervical & endocervical cancer | Female | >=65 | I/II | Chemotherapy | carboplatin | PD |
| SYNE4 | SNV | Missense_Mutation | rs200942070 | c.541C>T | p.Arg181Trp | p.R181W | Q8N205 | protein_coding | deleterious(0.01) | possibly_damaging(0.893) | TCGA-5M-AAT6-01 | Colorectum | colon adenocarcinoma | Female | <65 | III/IV | Unknown | Unknown | PD |
| SYNE4 | SNV | Missense_Mutation | novel | c.411N>T | p.Met137Ile | p.M137I | Q8N205 | protein_coding | tolerated(0.19) | benign(0.003) | TCGA-A6-5665-01 | Colorectum | colon adenocarcinoma | Female | >=65 | I/II | Unknown | Unknown | PD |
| SYNE4 | SNV | Missense_Mutation | c.1184N>C | p.Leu395Pro | p.L395P | Q8N205 | protein_coding | deleterious(0) | probably_damaging(1) | TCGA-AA-3693-01 | Colorectum | colon adenocarcinoma | Female | >=65 | III/IV | Unknown | Unknown | SD | |
| SYNE4 | SNV | Missense_Mutation | novel | c.94A>C | p.Thr32Pro | p.T32P | Q8N205 | protein_coding | deleterious_low_confidence(0) | possibly_damaging(0.694) | TCGA-AY-6196-01 | Colorectum | colon adenocarcinoma | Male | <65 | III/IV | Unknown | Unknown | SD |
| SYNE4 | SNV | Missense_Mutation | c.740T>C | p.Leu247Ser | p.L247S | Q8N205 | protein_coding | deleterious(0) | probably_damaging(0.996) | TCGA-AY-6197-01 | Colorectum | colon adenocarcinoma | Male | <65 | I/II | Unknown | Unknown | SD | |
| SYNE4 | SNV | Missense_Mutation | rs776739637 | c.577N>T | p.Arg193Trp | p.R193W | Q8N205 | protein_coding | tolerated(0.07) | benign(0.005) | TCGA-AZ-6601-01 | Colorectum | colon adenocarcinoma | Male | >=65 | I/II | Unknown | Unknown | PD |
| Page: 1 2 3 4 |
Top |
Related drugs of malignant transformation related genes |
| Identification of chemicals and drugs interact with genes involved in malignant transfromation |
| (DGIdb 4.0) |
| Entrez ID | Symbol | Category | Interaction Types | Drug Claim Name | Drug Name | PMIDs |
| Page: 1 |

Copyright 2023-Present -The University of Texas Health Science Center at Houston |