| Tissue | Expression Dynamics | Abbreviation |
| Breast |  | IDC: Invasive ductal carcinoma |
| DCIS: Ductal carcinoma in situ |
| Precancer(BRCA1-mut): Precancerous lesion from BRCA1 mutation carriers |
| Cervix | 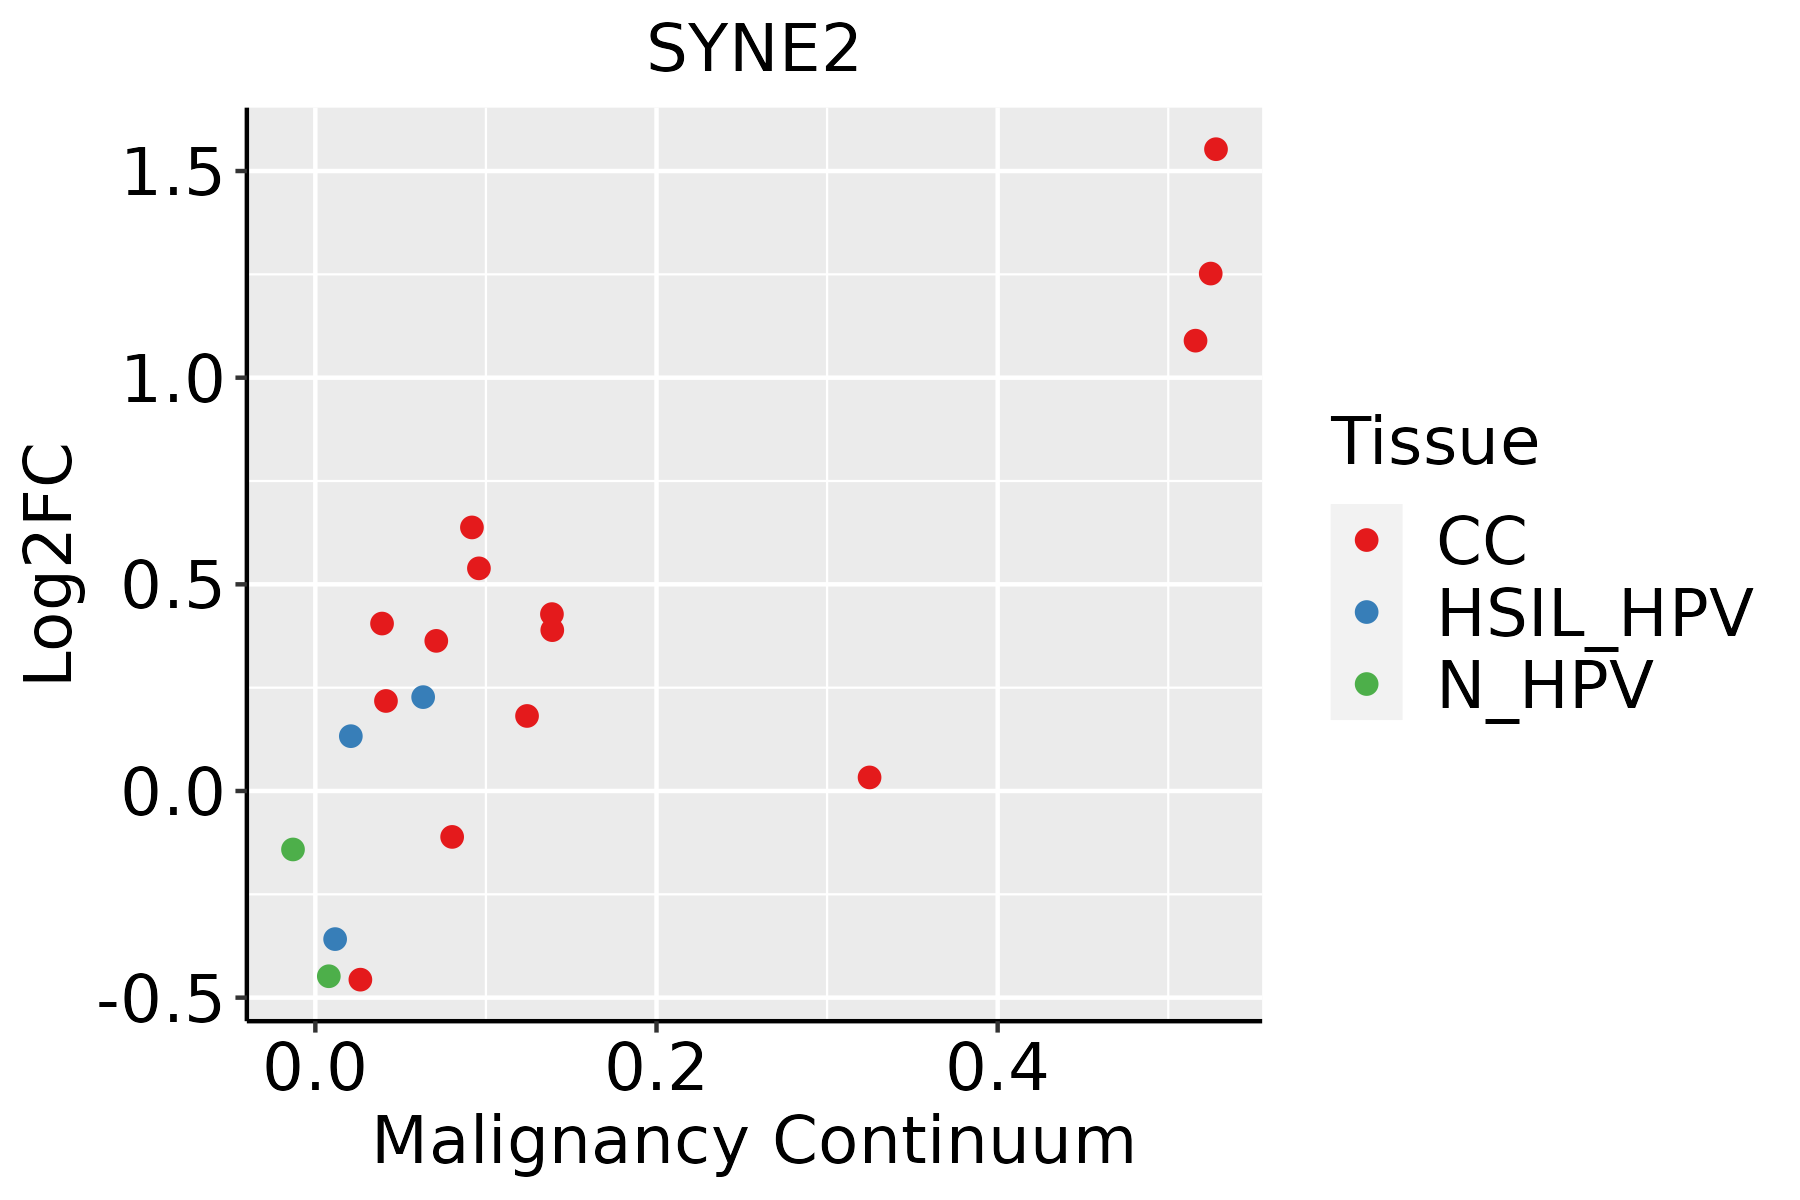 | CC: Cervix cancer |
| HSIL_HPV: HPV-infected high-grade squamous intraepithelial lesions |
| N_HPV: HPV-infected normal cervix |
| Colorectum (GSE201348) |  | FAP: Familial adenomatous polyposis |
| CRC: Colorectal cancer |
| Colorectum (HTA11) |  | AD: Adenomas |
| SER: Sessile serrated lesions |
| MSI-H: Microsatellite-high colorectal cancer |
| MSS: Microsatellite stable colorectal cancer |
| Endometrium |  | AEH: Atypical endometrial hyperplasia |
| EEC: Endometrioid Cancer |
| Esophagus | 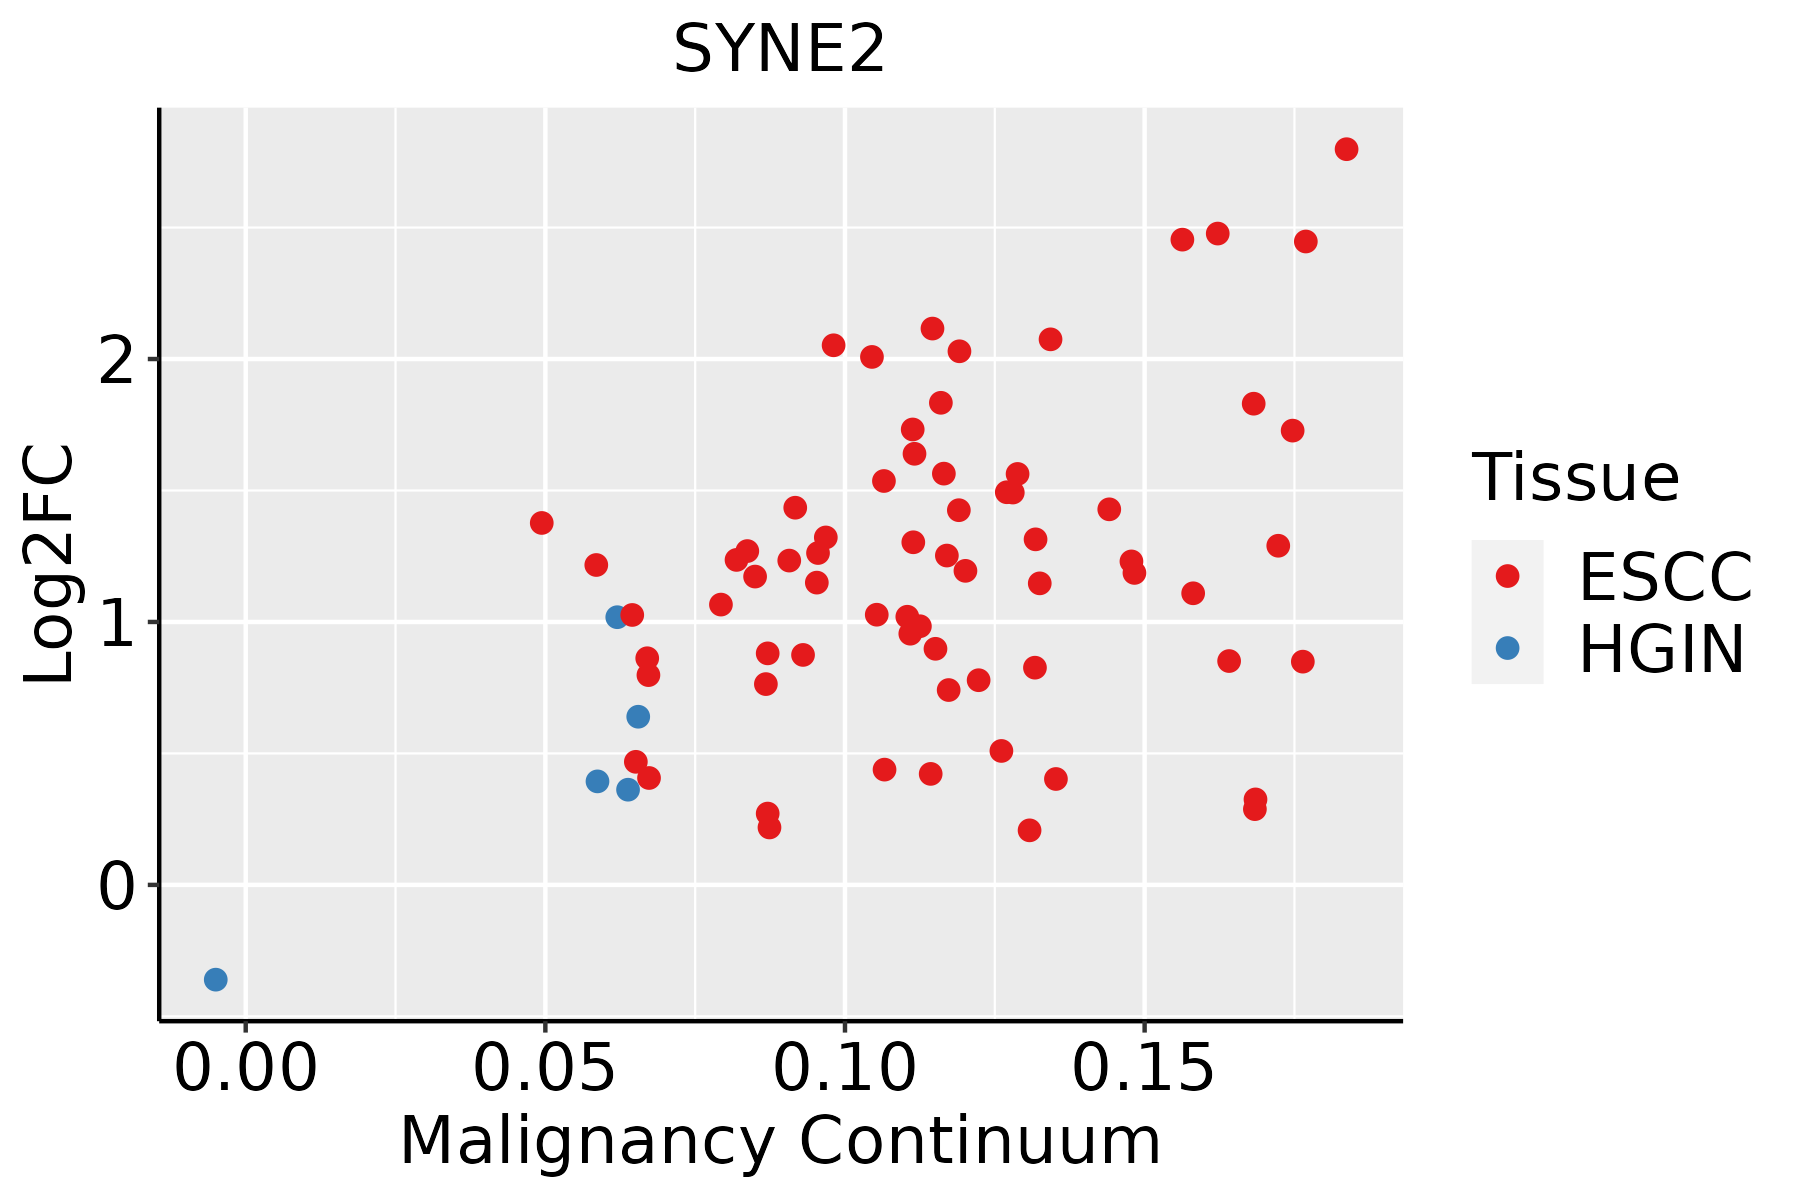 | ESCC: Esophageal squamous cell carcinoma |
| HGIN: High-grade intraepithelial neoplasias |
| LGIN: Low-grade intraepithelial neoplasias |
| GC | 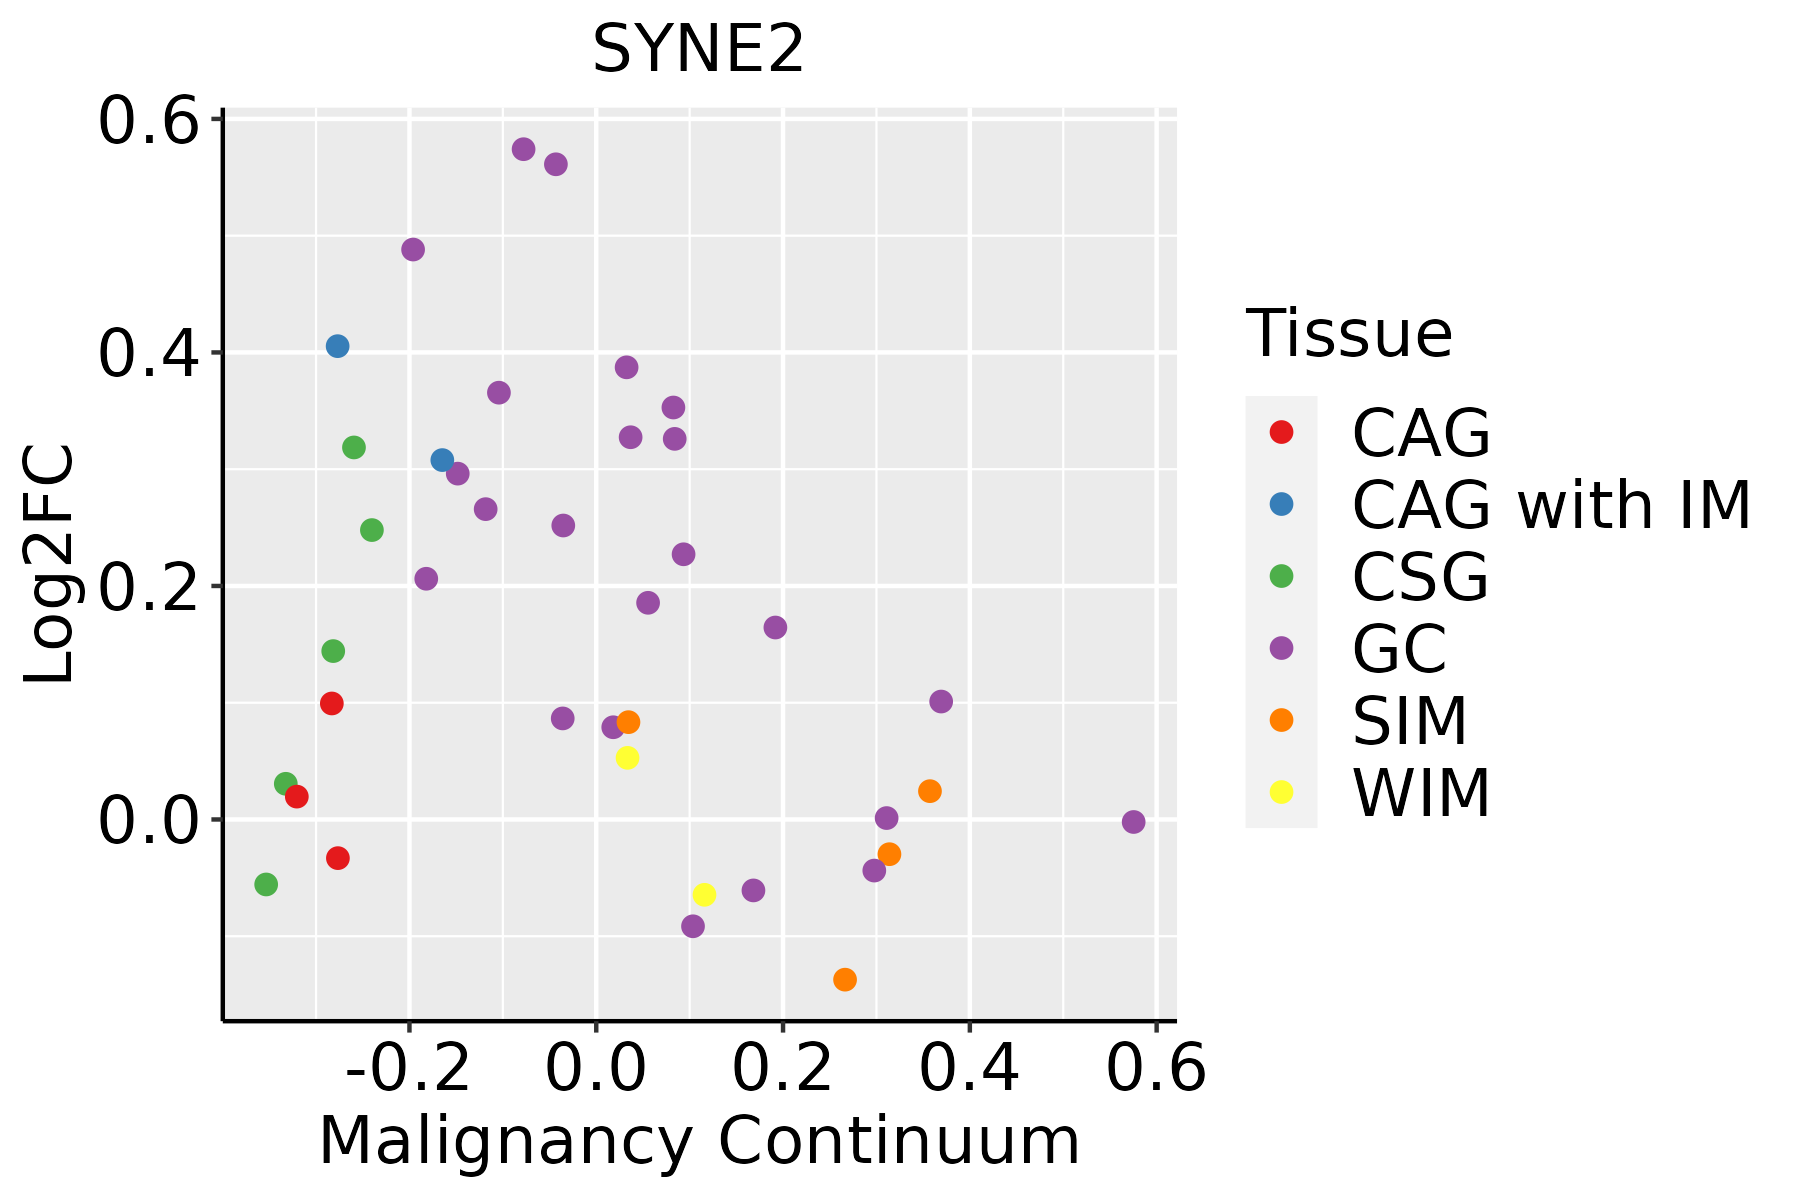 | CAG: Chronic atrophic gastritis |
| CAG with IM: Chronic atrophic gastritis with intestinal metaplasia |
| CSG: Chronic superficial gastritis |
| GC: Gastric cancer |
| SIM: Severe intestinal metaplasia |
| WIM: Wild intestinal metaplasia |
| Liver | 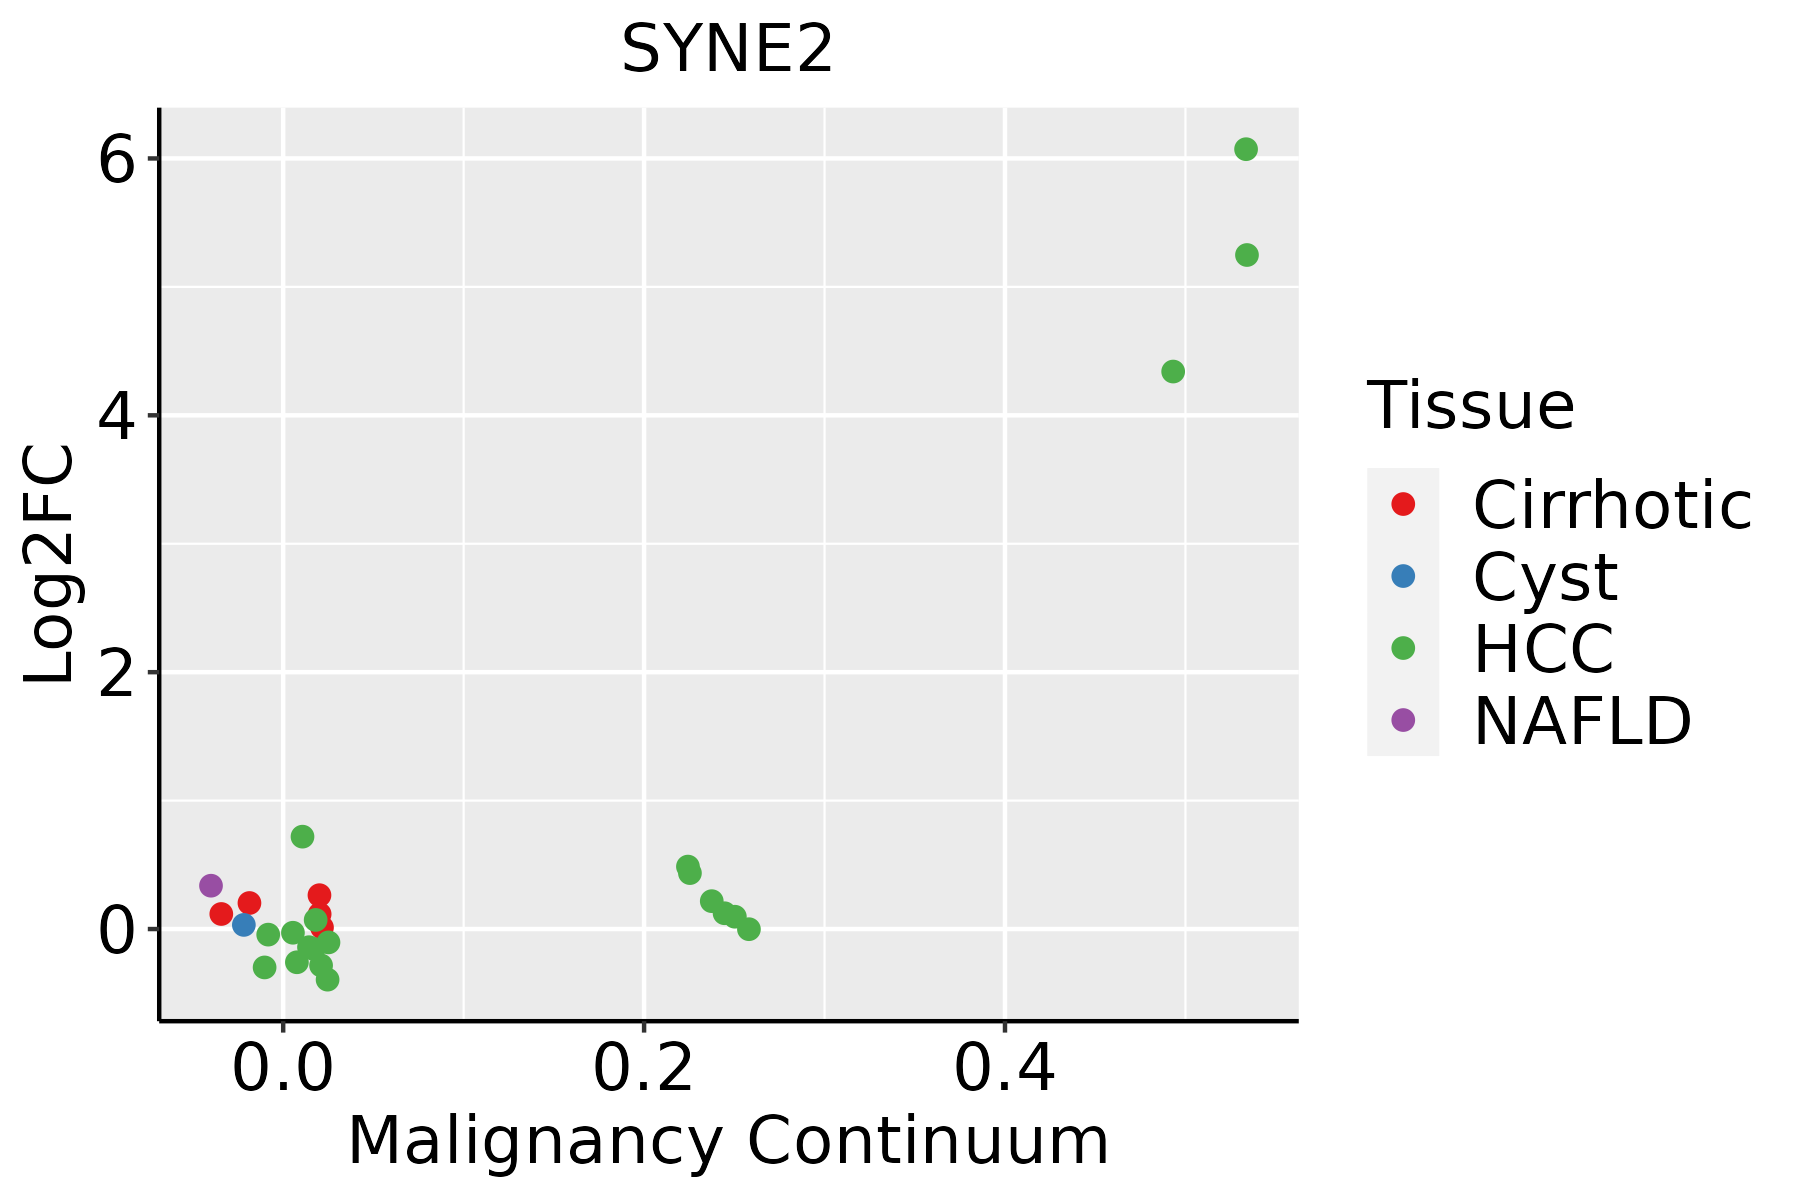 | HCC: Hepatocellular carcinoma |
| NAFLD: Non-alcoholic fatty liver disease |
| Lung |  | AAH: Atypical adenomatous hyperplasia |
| AIS: Adenocarcinoma in situ |
| IAC: Invasive lung adenocarcinoma |
| MIA: Minimally invasive adenocarcinoma |
| Oral Cavity | 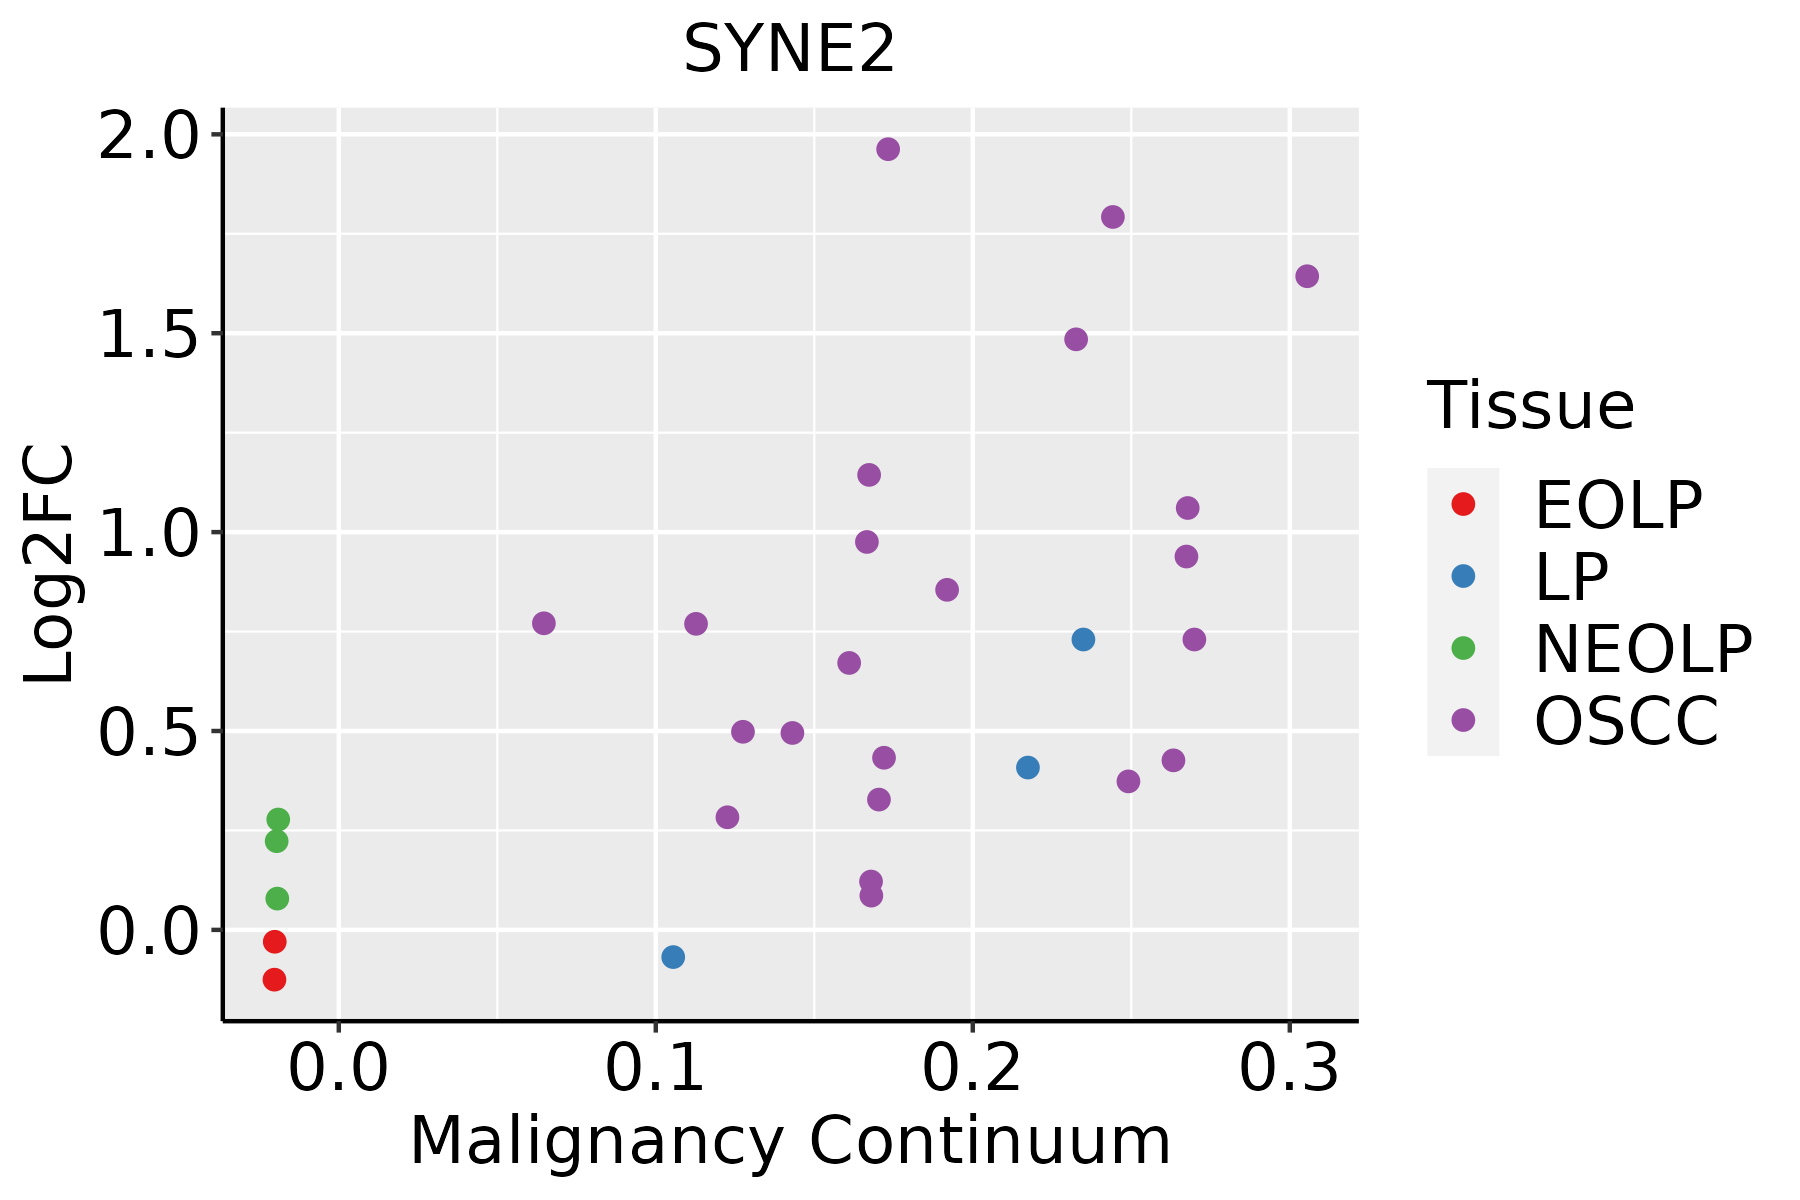 | EOLP: Erosive Oral lichen planus |
| LP: leukoplakia |
| NEOLP: Non-erosive oral lichen planus |
| OSCC: Oral squamous cell carcinoma |
| Prostate | 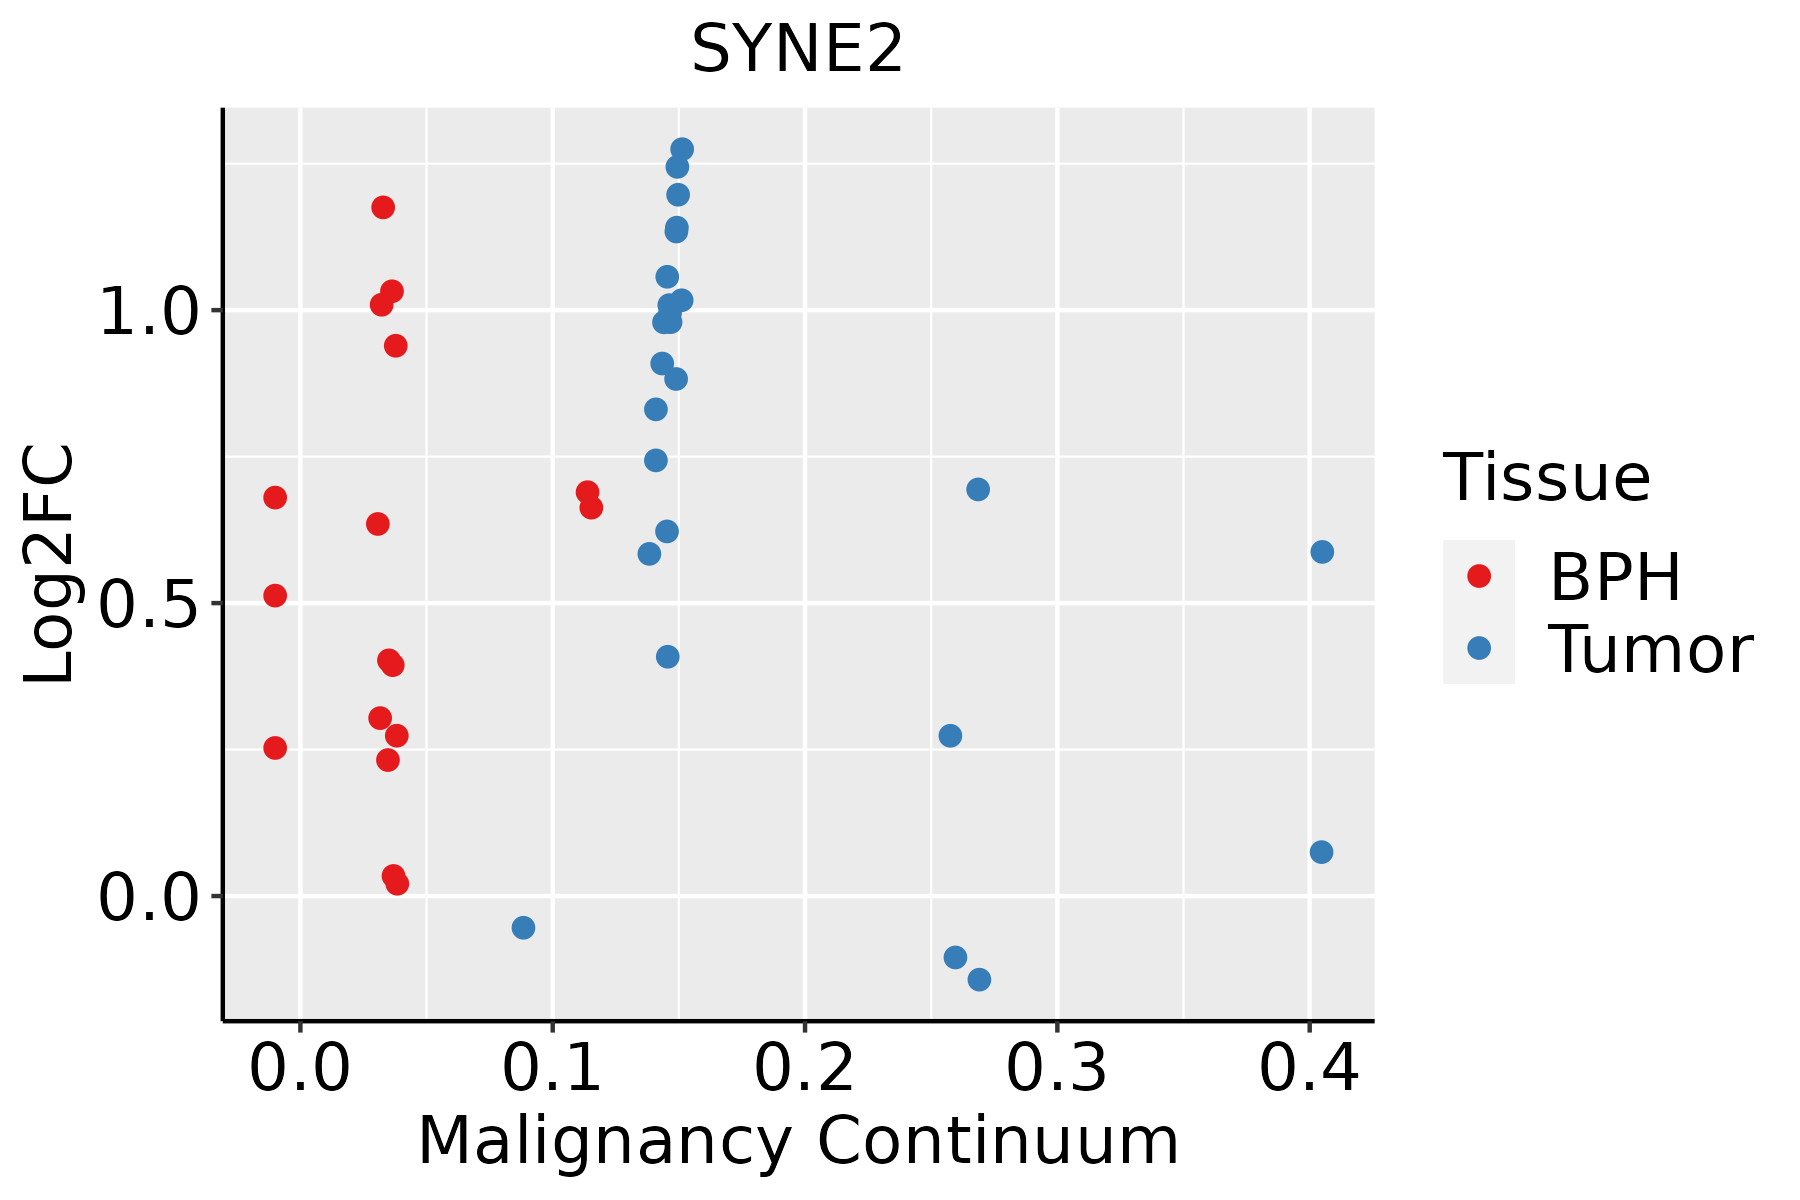 | BPH: Benign Prostatic Hyperplasia |
| Skin | 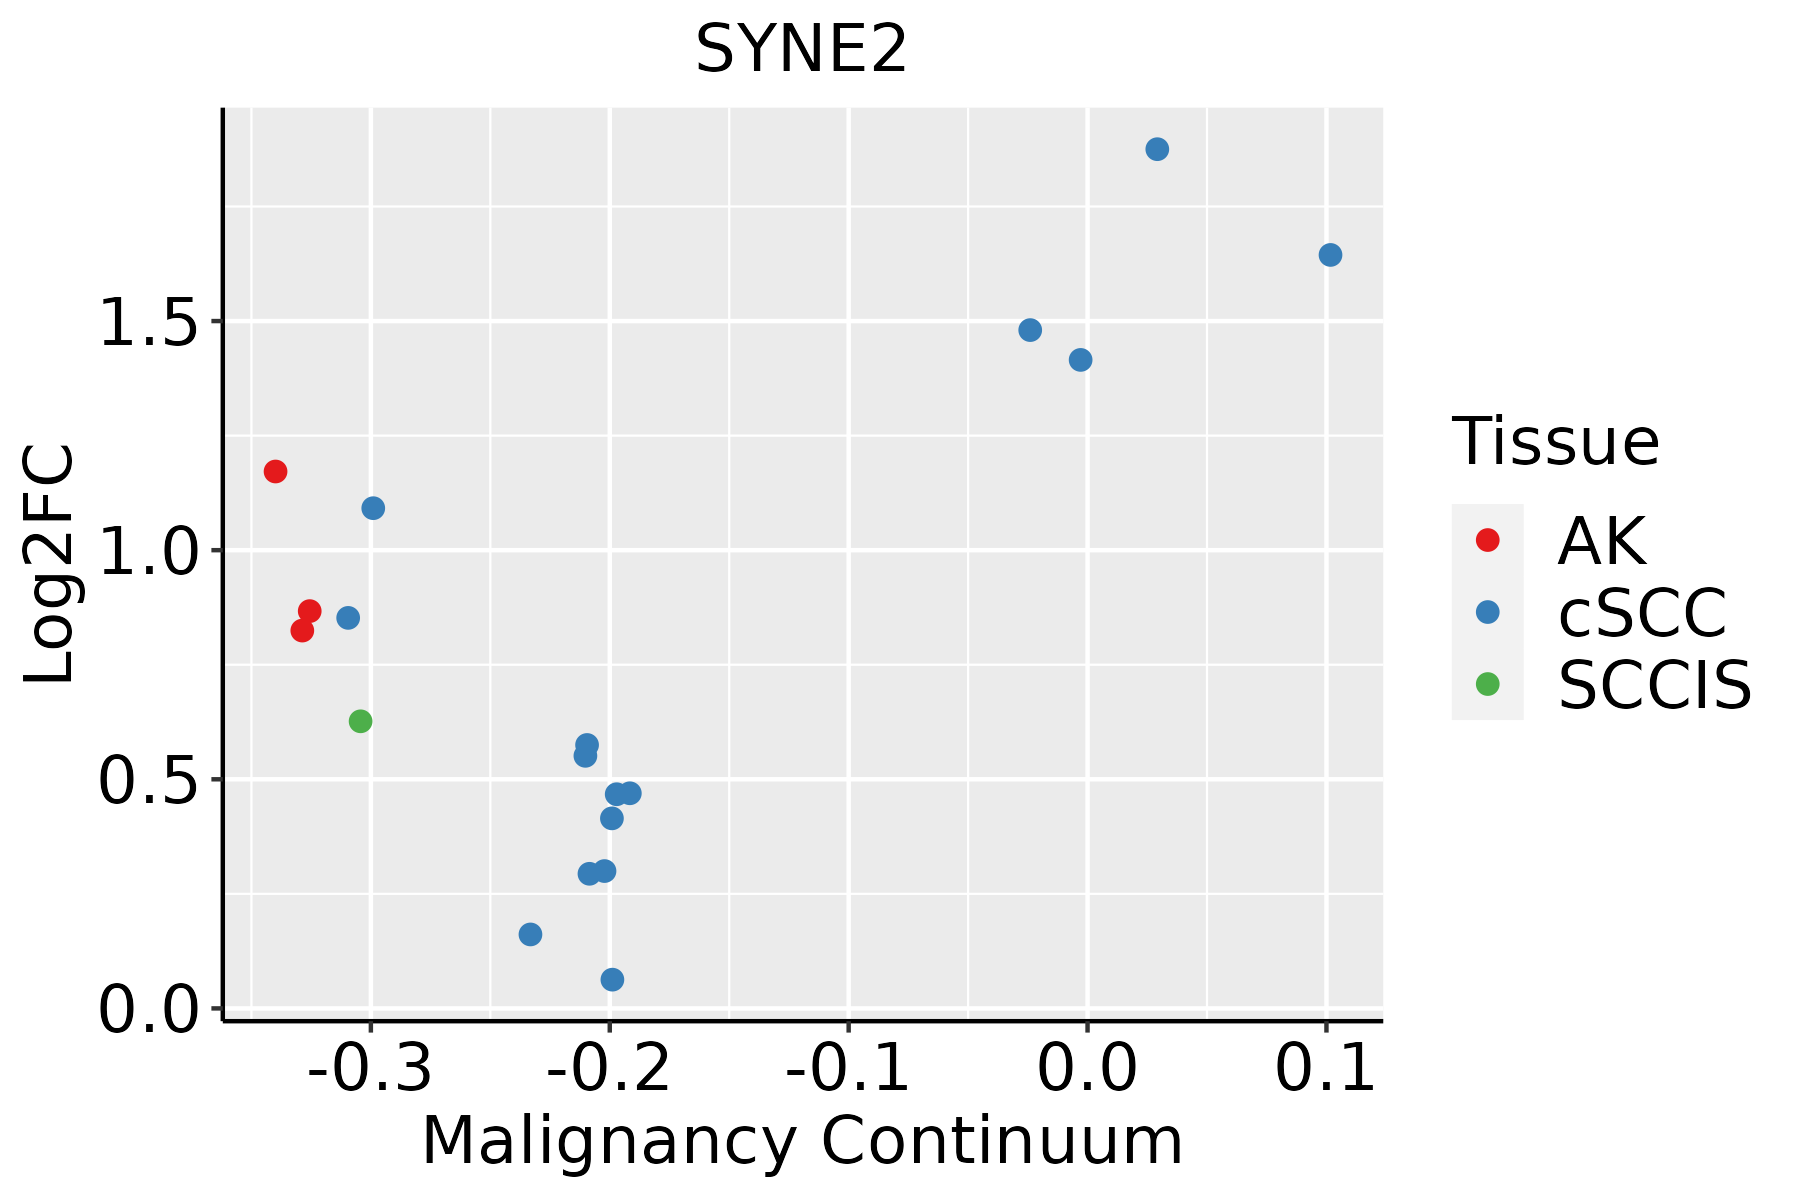 | AK: Actinic keratosis |
| cSCC: Cutaneous squamous cell carcinoma |
| SCCIS:squamous cell carcinoma in situ |
| Thyroid | 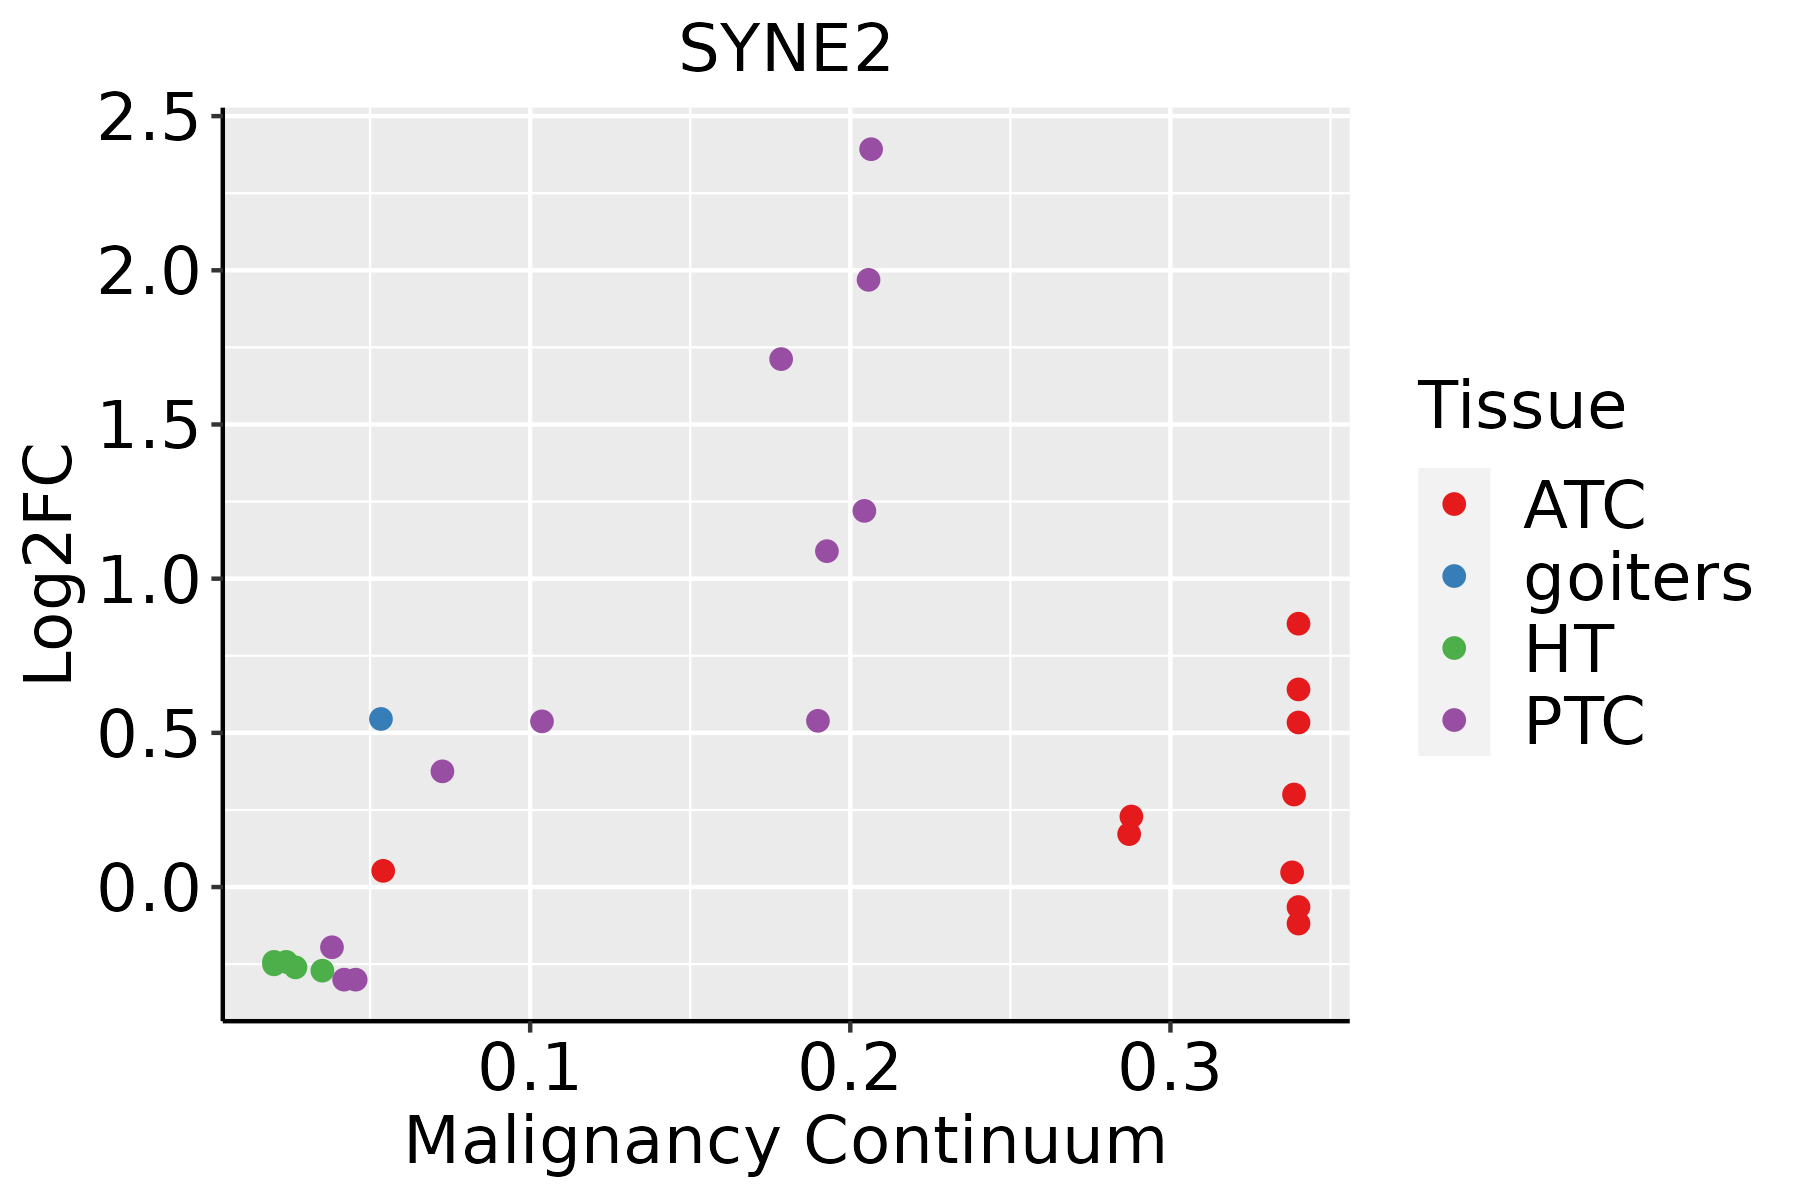 | ATC: Anaplastic thyroid cancer |
| HT: Hashimoto's thyroiditis |
| PTC: Papillary thyroid cancer |
| GO ID | Tissue | Disease Stage | Description | Gene Ratio | Bg Ratio | pvalue | p.adjust | Count |
| GO:00516567 | Cervix | CC | establishment of organelle localization | 76/2311 | 390/18723 | 3.17e-05 | 5.21e-04 | 76 |
| GO:00300487 | Cervix | CC | actin filament-based movement | 29/2311 | 127/18723 | 6.91e-04 | 6.33e-03 | 29 |
| GO:00307057 | Cervix | CC | cytoskeleton-dependent intracellular transport | 40/2311 | 195/18723 | 7.92e-04 | 6.99e-03 | 40 |
| GO:00618425 | Cervix | CC | microtubule organizing center localization | 11/2311 | 33/18723 | 1.42e-03 | 1.11e-02 | 11 |
| GO:00995157 | Cervix | CC | actin filament-based transport | 8/2311 | 21/18723 | 2.44e-03 | 1.71e-02 | 8 |
| GO:00516425 | Cervix | CC | centrosome localization | 10/2311 | 32/18723 | 3.96e-03 | 2.48e-02 | 10 |
| GO:003004813 | Cervix | HSIL_HPV | actin filament-based movement | 12/737 | 127/18723 | 4.37e-03 | 3.68e-02 | 12 |
| GO:006184212 | Cervix | N_HPV | microtubule organizing center localization | 6/534 | 33/18723 | 3.01e-04 | 4.64e-03 | 6 |
| GO:005164211 | Cervix | N_HPV | centrosome localization | 5/534 | 32/18723 | 1.97e-03 | 1.93e-02 | 5 |
| GO:003070513 | Cervix | N_HPV | cytoskeleton-dependent intracellular transport | 13/534 | 195/18723 | 4.03e-03 | 3.16e-02 | 13 |
| GO:0051656 | Colorectum | AD | establishment of organelle localization | 131/3918 | 390/18723 | 3.00e-09 | 2.06e-07 | 131 |
| GO:0030048 | Colorectum | AD | actin filament-based movement | 44/3918 | 127/18723 | 2.31e-04 | 2.99e-03 | 44 |
| GO:0099515 | Colorectum | AD | actin filament-based transport | 12/3918 | 21/18723 | 3.02e-04 | 3.62e-03 | 12 |
| GO:0030705 | Colorectum | AD | cytoskeleton-dependent intracellular transport | 60/3918 | 195/18723 | 7.56e-04 | 7.59e-03 | 60 |
| GO:0007097 | Colorectum | AD | nuclear migration | 10/3918 | 20/18723 | 3.67e-03 | 2.60e-02 | 10 |
| GO:0051647 | Colorectum | AD | nucleus localization | 11/3918 | 24/18723 | 5.43e-03 | 3.55e-02 | 11 |
| GO:00516561 | Colorectum | SER | establishment of organelle localization | 100/2897 | 390/18723 | 1.11e-07 | 6.79e-06 | 100 |
| GO:00300481 | Colorectum | SER | actin filament-based movement | 38/2897 | 127/18723 | 2.80e-05 | 7.56e-04 | 38 |
| GO:00995151 | Colorectum | SER | actin filament-based transport | 11/2897 | 21/18723 | 9.28e-05 | 1.98e-03 | 11 |
| GO:00307051 | Colorectum | SER | cytoskeleton-dependent intracellular transport | 44/2897 | 195/18723 | 5.53e-03 | 4.09e-02 | 44 |
| Hugo Symbol | Variant Class | Variant Classification | dbSNP RS | HGVSc | HGVSp | HGVSp Short | SWISSPROT | BIOTYPE | SIFT | PolyPhen | Tumor Sample Barcode | Tissue | Histology | Sex | Age | Stage | Therapy Types | Drugs | Outcome |
| SYNE2 | SNV | Missense_Mutation | | c.13049C>T | p.Ser4350Leu | p.S4350L | Q8WXH0 | protein_coding | tolerated(0.06) | benign(0.015) | TCGA-5L-AAT1-01 | Breast | breast invasive carcinoma | Female | <65 | III/IV | Hormone Therapy | letrozol | SD |
| SYNE2 | SNV | Missense_Mutation | | c.13813G>C | p.Glu4605Gln | p.E4605Q | Q8WXH0 | protein_coding | tolerated(0.23) | benign(0.107) | TCGA-5L-AAT1-01 | Breast | breast invasive carcinoma | Female | <65 | III/IV | Hormone Therapy | letrozol | SD |
| SYNE2 | SNV | Missense_Mutation | novel | c.18166G>C | p.Asp6056His | p.D6056H | Q8WXH0 | protein_coding | deleterious(0) | benign(0.364) | TCGA-5L-AAT1-01 | Breast | breast invasive carcinoma | Female | <65 | III/IV | Hormone Therapy | letrozol | SD |
| SYNE2 | SNV | Missense_Mutation | | c.5643N>G | p.Phe1881Leu | p.F1881L | Q8WXH0 | protein_coding | deleterious(0.01) | possibly_damaging(0.808) | TCGA-A2-A0CR-01 | Breast | breast invasive carcinoma | Female | <65 | I/II | Chemotherapy | adriamycin | CR |
| SYNE2 | SNV | Missense_Mutation | | c.3278N>T | p.Ser1093Leu | p.S1093L | Q8WXH0 | protein_coding | deleterious(0.03) | benign(0.027) | TCGA-A2-A0EQ-01 | Breast | breast invasive carcinoma | Female | <65 | I/II | Chemotherapy | adriamycin | SD |
| SYNE2 | SNV | Missense_Mutation | | c.15141N>G | p.Ile5047Met | p.I5047M | Q8WXH0 | protein_coding | deleterious(0) | probably_damaging(0.935) | TCGA-A2-A1FW-01 | Breast | breast invasive carcinoma | Female | <65 | III/IV | Chemotherapy | cytoxan | SD |
| SYNE2 | SNV | Missense_Mutation | novel | c.11789G>T | p.Gly3930Val | p.G3930V | Q8WXH0 | protein_coding | deleterious(0.01) | probably_damaging(0.996) | TCGA-A7-A0DB-01 | Breast | breast invasive carcinoma | Female | <65 | I/II | Hormone Therapy | arimidex | SD |
| SYNE2 | SNV | Missense_Mutation | | c.12647C>G | p.Ser4216Cys | p.S4216C | Q8WXH0 | protein_coding | tolerated(0.18) | possibly_damaging(0.614) | TCGA-A7-A0DB-01 | Breast | breast invasive carcinoma | Female | <65 | I/II | Hormone Therapy | arimidex | SD |
| SYNE2 | SNV | Missense_Mutation | novel | c.17066G>T | p.Arg5689Leu | p.R5689L | Q8WXH0 | protein_coding | deleterious(0.03) | benign(0.036) | TCGA-A7-A0DB-01 | Breast | breast invasive carcinoma | Female | <65 | I/II | Hormone Therapy | arimidex | SD |
| SYNE2 | SNV | Missense_Mutation | novel | c.15958N>A | p.Leu5320Ile | p.L5320I | Q8WXH0 | protein_coding | deleterious(0) | probably_damaging(0.988) | TCGA-A7-A26I-01 | Breast | breast invasive carcinoma | Female | >=65 | I/II | Chemotherapy | cytoxan | SD |


