Schematic overview of the cellular and molecular mechanisms involved in the cancer progression, including the proposed cellular and molecular mechanisms in cancer cells trajectory. AT1: alveolar type 1 cells; AT2: alveolar type 2 cells; AAH: atypical adenomatous hyperplasia; AIS: adenocarcinoma in situ; MIA: minimally invasive adenocarcinoma; IA: invasive adenocarcinoma; EMT: epithelial-mesenchymal transition

Home

Download

Statistics

Help

Contact

Center for Computational Systems Medicine
leaf

Gene summary

leaf

Malignant transformation analysis

leaf

Malignant transformation related pathway analysis

leaf

Cell-cell communication analysis

leaf

Single-cell gene regulatory network inference analysis

leaf

Somatic mutation of malignant transformation related genes

leaf

Related drugs of malignant transformation related genes

Gene: SYNCRIP

Gene summary for SYNCRIP

check button Gene summary.

Gene informationSpeciesHuman
Gene symbol

SYNCRIP

Gene ID

10492

Gene namesynaptotagmin binding cytoplasmic RNA interacting protein
Gene AliasGRY-RBP
Cytomap6q14.3
Gene Typeprotein-coding
GO ID

GO:0000375

UniProtAcc

B7Z645


Top

Malignant transformation analysis

check button Identification of the aberrant gene expression in precancerous and cancerous lesions by comparing the gene expression of stem-like cells in diseased tissues with normal stem cells
check button Malignant transformation involving gene list.
Entrez IDSymbolReplicatesSpeciesOrganTissueAdj P-valueLog2FCMalignancy
10492SYNCRIPLZE2THumanEsophagusESCC3.07e-031.08e+000.082
10492SYNCRIPLZE4THumanEsophagusESCC6.94e-055.91e-010.0811
10492SYNCRIPLZE7THumanEsophagusESCC7.01e-047.96e-010.0667
10492SYNCRIPLZE20THumanEsophagusESCC1.99e-03-1.44e-010.0662
10492SYNCRIPLZE22D1HumanEsophagusHGIN1.63e-02-3.33e-010.0595
10492SYNCRIPLZE24THumanEsophagusESCC6.49e-074.37e-010.0596
10492SYNCRIPP1T-EHumanEsophagusESCC5.18e-056.13e-010.0875
10492SYNCRIPP2T-EHumanEsophagusESCC7.64e-481.27e+000.1177
10492SYNCRIPP4T-EHumanEsophagusESCC7.90e-451.68e+000.1323
10492SYNCRIPP5T-EHumanEsophagusESCC7.33e-341.05e+000.1327
10492SYNCRIPP8T-EHumanEsophagusESCC7.73e-247.89e-010.0889
10492SYNCRIPP9T-EHumanEsophagusESCC1.16e-145.88e-010.1131
10492SYNCRIPP10T-EHumanEsophagusESCC8.72e-371.02e+000.116
10492SYNCRIPP11T-EHumanEsophagusESCC1.57e-066.66e-010.1426
10492SYNCRIPP12T-EHumanEsophagusESCC1.54e-341.01e+000.1122
10492SYNCRIPP15T-EHumanEsophagusESCC9.81e-229.81e-010.1149
10492SYNCRIPP16T-EHumanEsophagusESCC2.38e-461.38e+000.1153
10492SYNCRIPP17T-EHumanEsophagusESCC1.26e-045.53e-010.1278
10492SYNCRIPP19T-EHumanEsophagusESCC6.83e-031.05e+000.1662
10492SYNCRIPP20T-EHumanEsophagusESCC1.17e-217.87e-010.1124
Page: 1 2 3 4 5 6 7 8 

check button Transcriptomic changes along malignancy continuum.
TissueExpression DynamicsAbbreviation
EsophagusThe image shows the transcriptomic changes along malignancy continuum.log2FC in expression of this searched gene in stem-like cells from each diseased tissue sample relative to stem-like cells in normal samples in each tissue plotted against the malignancy continuum. Samples are colored based on if they are from different disease stage.ESCC: Esophageal squamous cell carcinoma
HGIN: High-grade intraepithelial neoplasias
LGIN: Low-grade intraepithelial neoplasias
LiverThe image shows the transcriptomic changes along malignancy continuum.log2FC in expression of this searched gene in stem-like cells from each diseased tissue sample relative to stem-like cells in normal samples in each tissue plotted against the malignancy continuum. Samples are colored based on if they are from different disease stage.
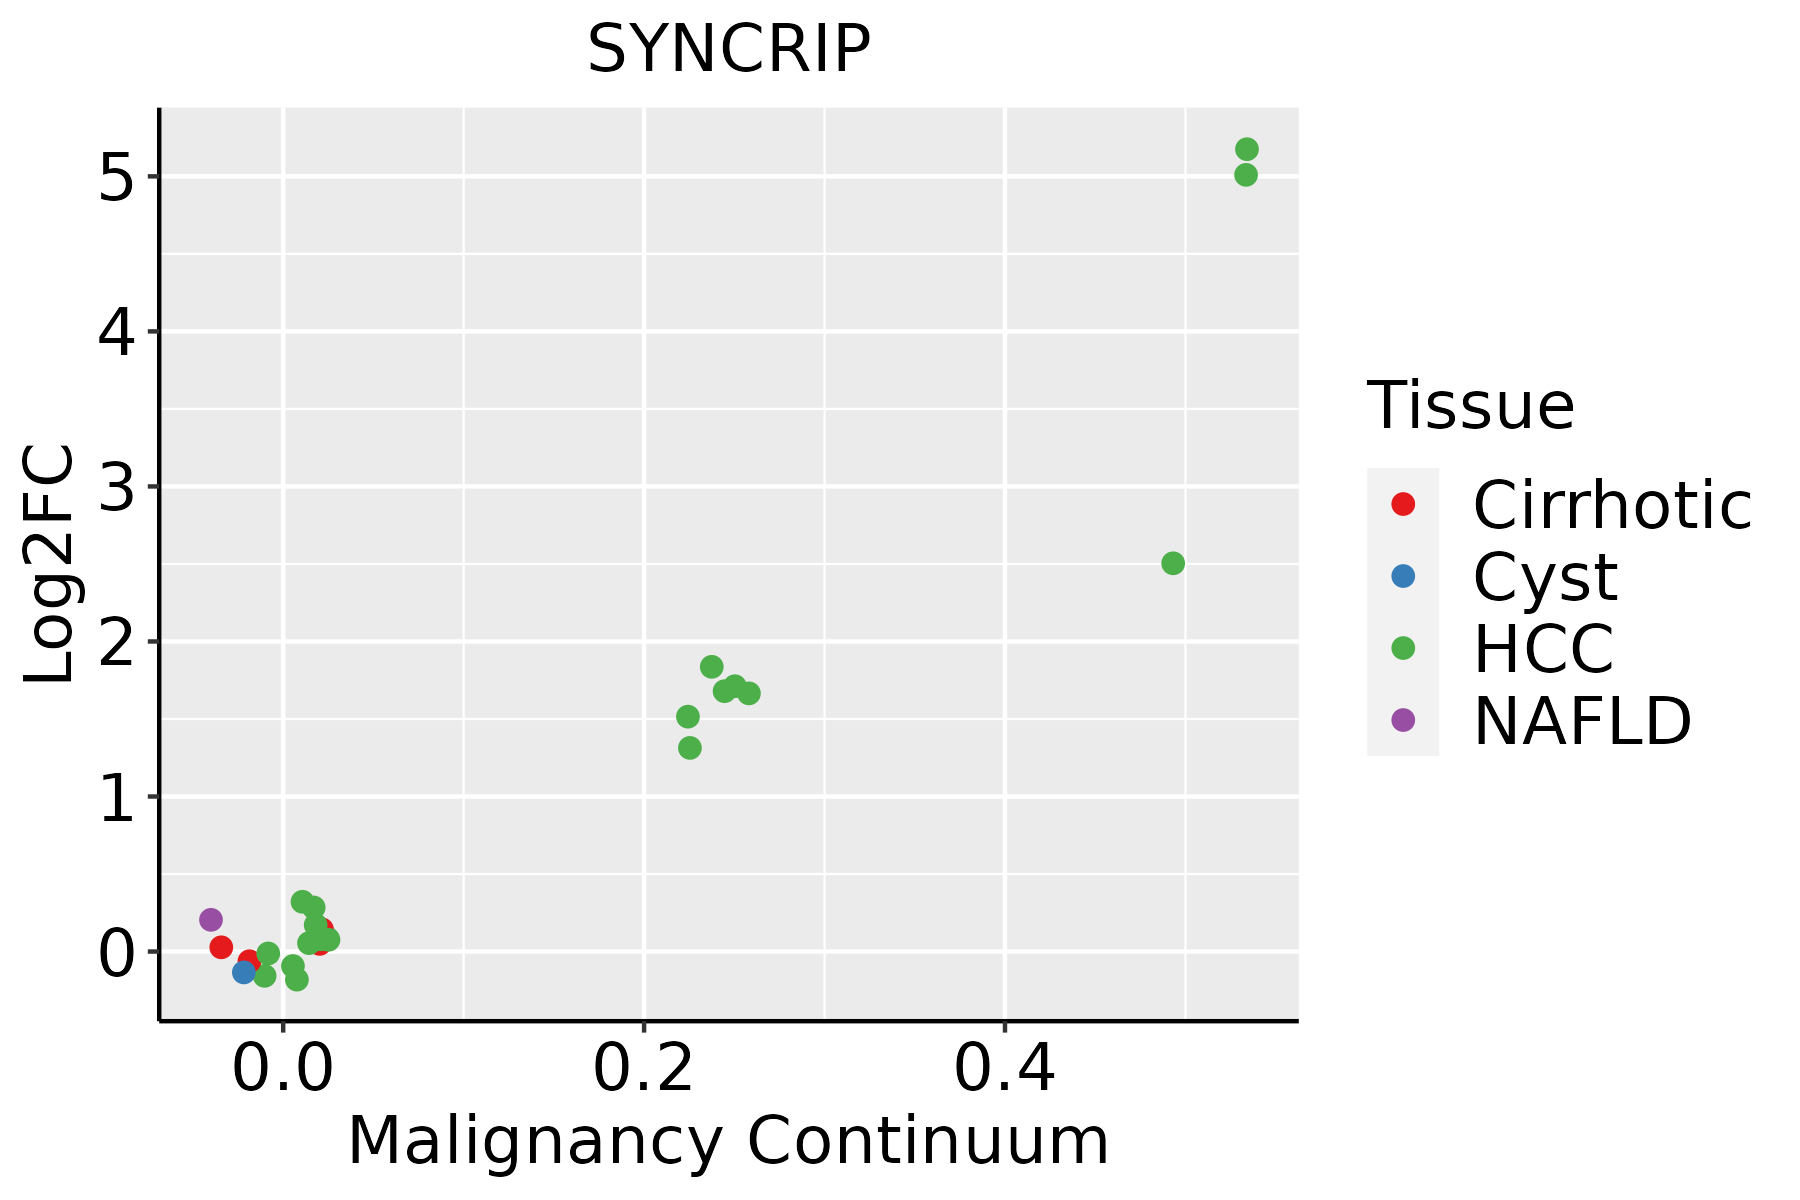
HCC: Hepatocellular carcinoma
NAFLD: Non-alcoholic fatty liver disease
Oral CavityThe image shows the transcriptomic changes along malignancy continuum.log2FC in expression of this searched gene in stem-like cells from each diseased tissue sample relative to stem-like cells in normal samples in each tissue plotted against the malignancy continuum. Samples are colored based on if they are from different disease stage.
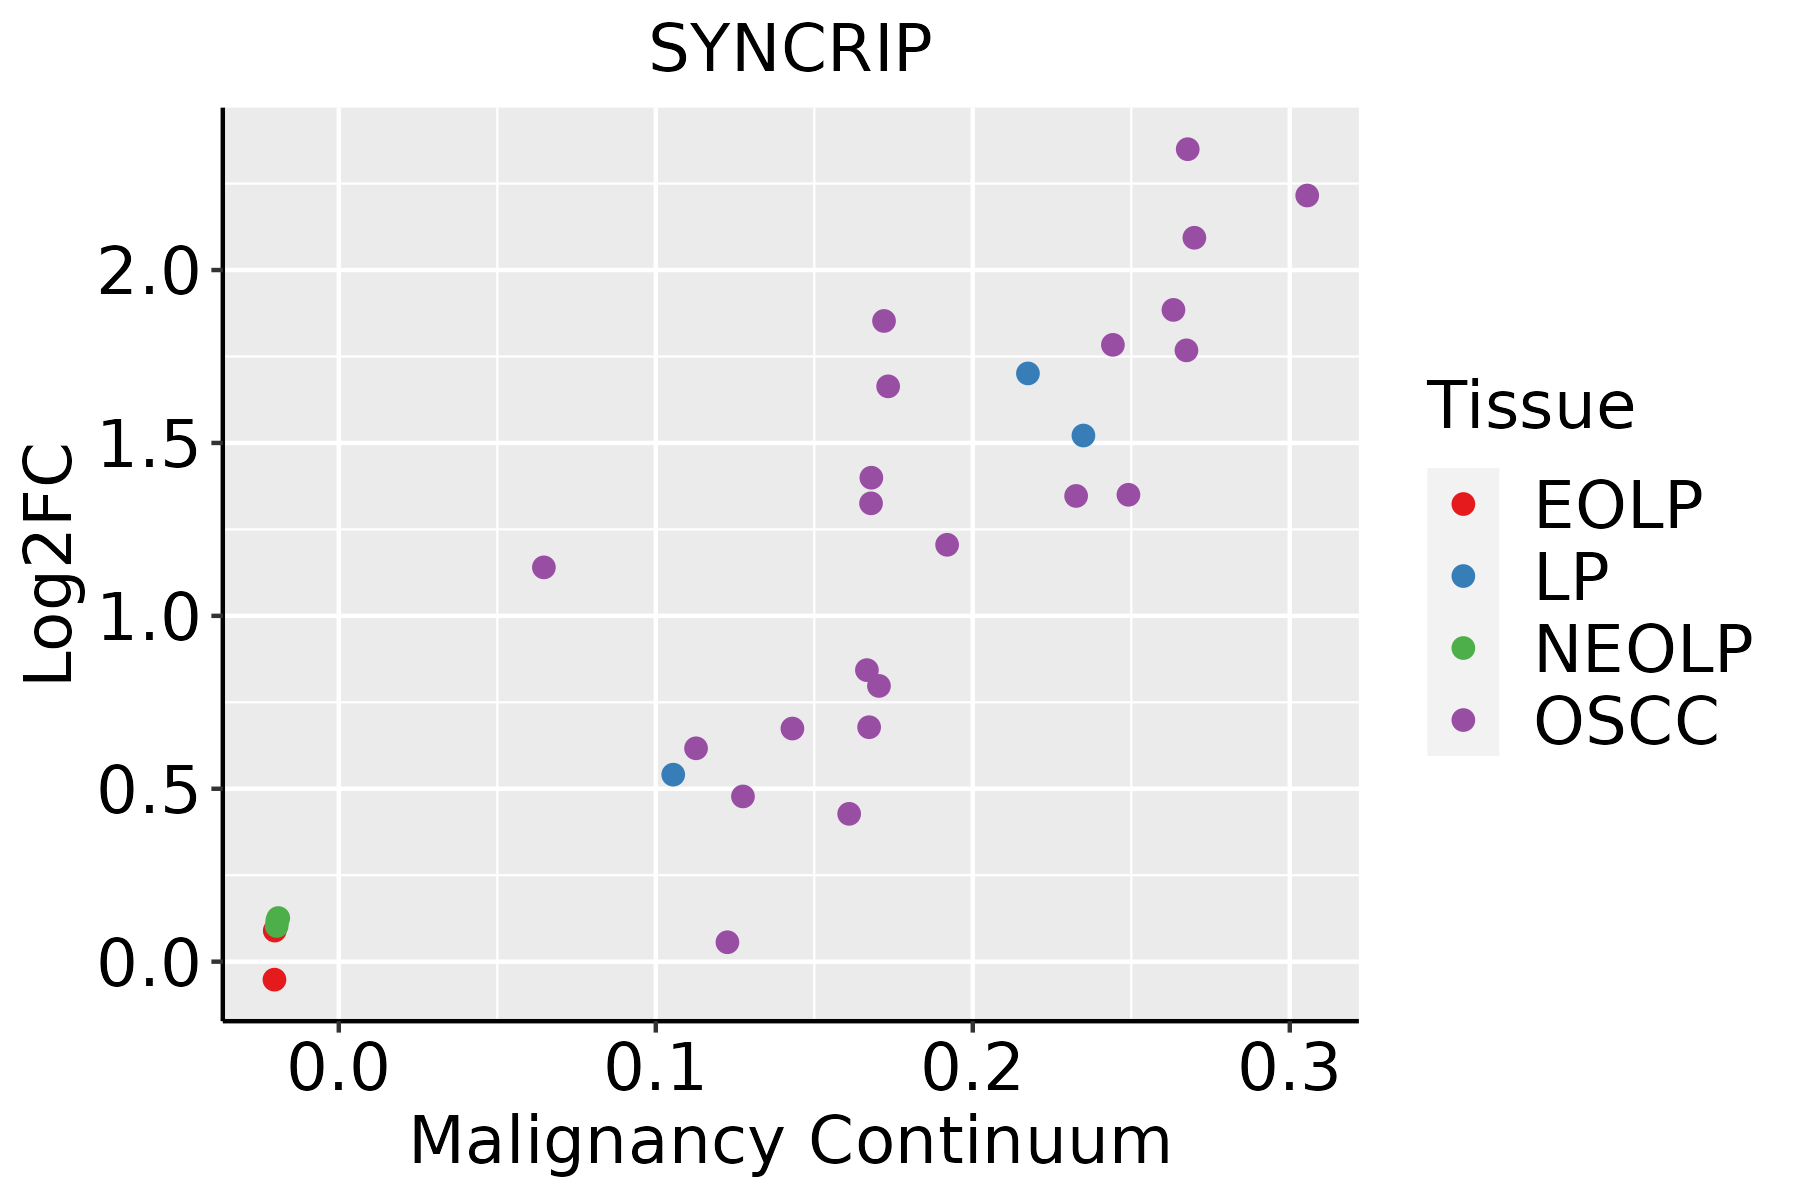
EOLP: Erosive Oral lichen planus
LP: leukoplakia
NEOLP: Non-erosive oral lichen planus
OSCC: Oral squamous cell carcinoma
ProstateThe image shows the transcriptomic changes along malignancy continuum.log2FC in expression of this searched gene in stem-like cells from each diseased tissue sample relative to stem-like cells in normal samples in each tissue plotted against the malignancy continuum. Samples are colored based on if they are from different disease stage.BPH: Benign Prostatic Hyperplasia
SkinThe image shows the transcriptomic changes along malignancy continuum.log2FC in expression of this searched gene in stem-like cells from each diseased tissue sample relative to stem-like cells in normal samples in each tissue plotted against the malignancy continuum. Samples are colored based on if they are from different disease stage.
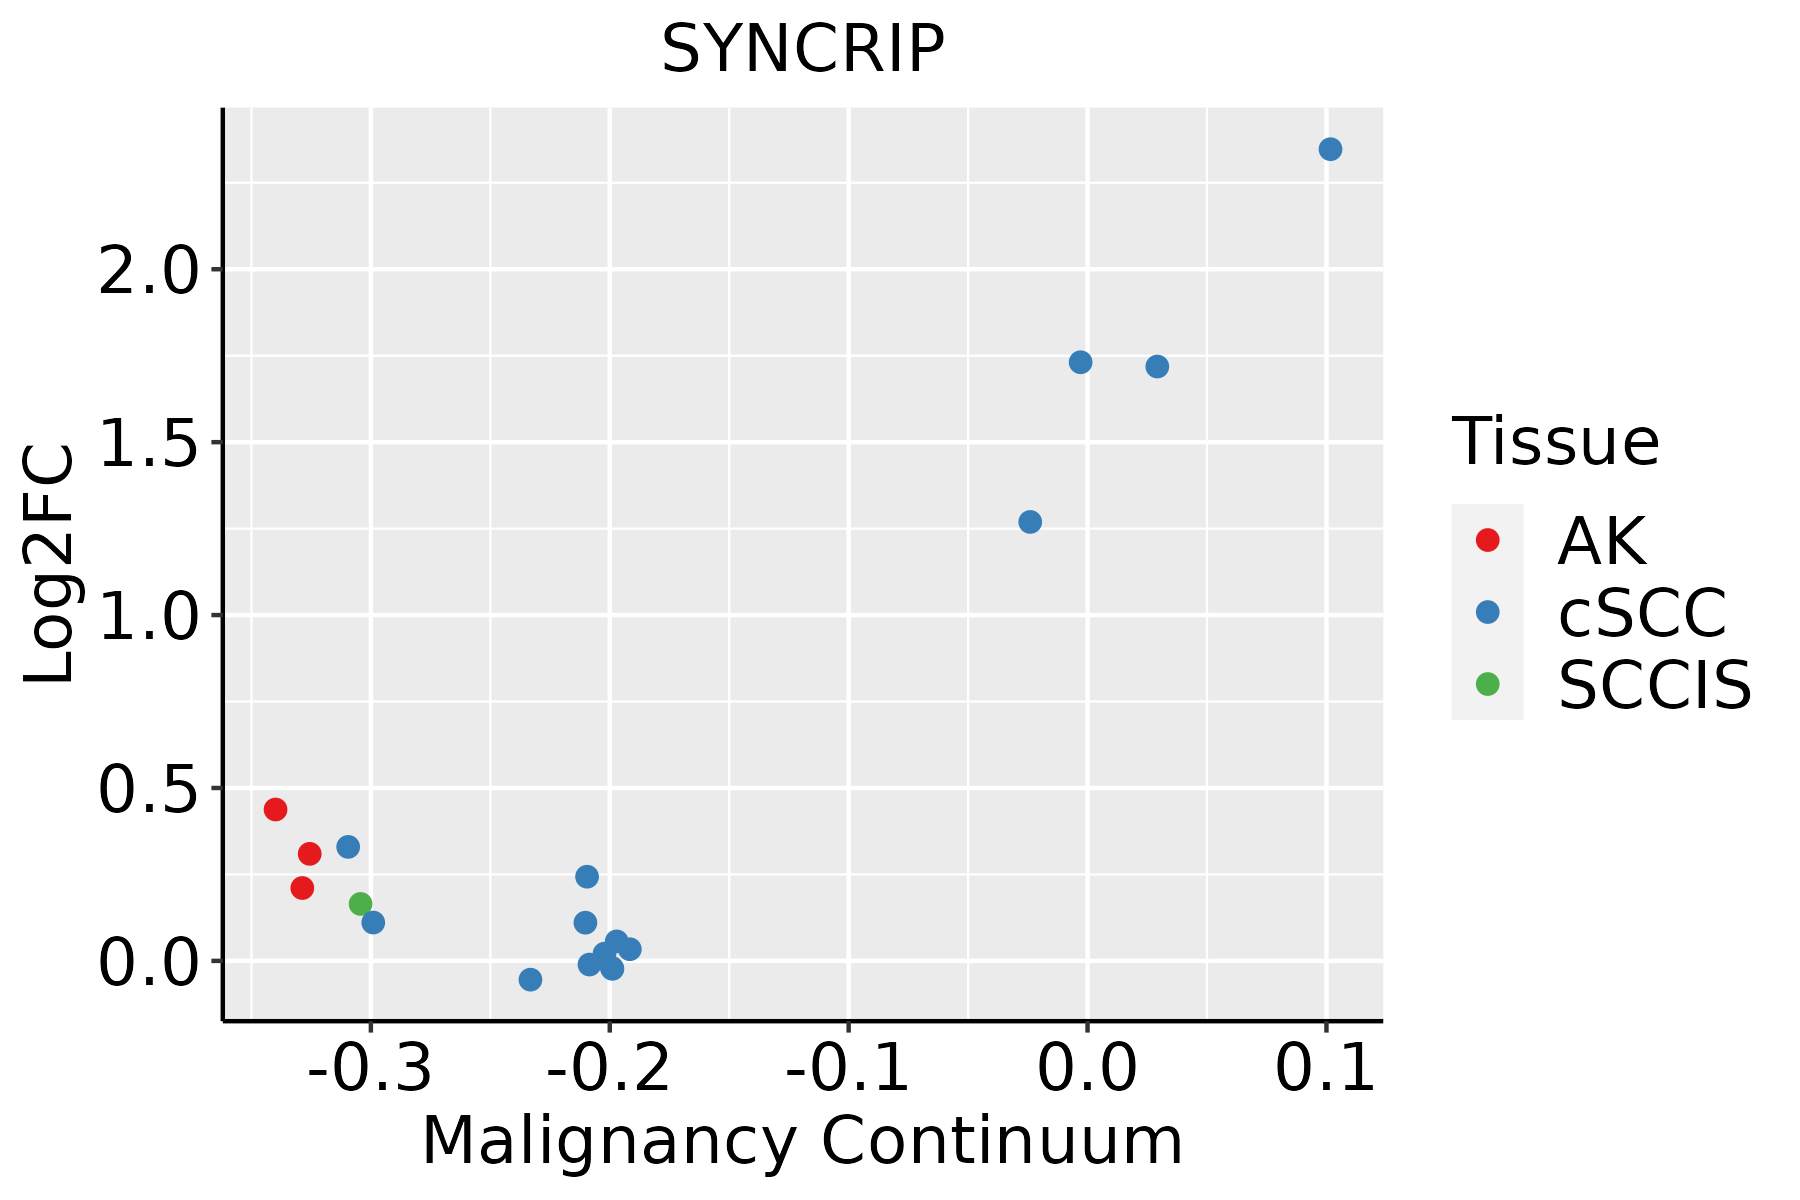
AK: Actinic keratosis
cSCC: Cutaneous squamous cell carcinoma
SCCIS:squamous cell carcinoma in situ
ThyroidThe image shows the transcriptomic changes along malignancy continuum.log2FC in expression of this searched gene in stem-like cells from each diseased tissue sample relative to stem-like cells in normal samples in each tissue plotted against the malignancy continuum. Samples are colored based on if they are from different disease stage.ATC: Anaplastic thyroid cancer
HT: Hashimoto's thyroiditis
PTC: Papillary thyroid cancer
∗log2FC in expression of this searched gene in stem-like cells from each diseased tissue sample relative to stem-like cells in normal samples in each tissue plotted against the malignancy continuum. Samples are colored based on if they are from different disease stage.

Top

Malignant transformation related pathway analysis

check buttonFind out the enriched GO biological processes and KEGG pathways involved in transition from healthy to precancer to cancer
check button Figure of enriched GO biological processes.
TissueDisease StageEnriched GO biological Processes
ColorectumADGO analysis - Figure of enriched GO biological processes: Top 15 enriched GO BP terms are showed in the bar plot of each disease state in each tissue. Each row represents a significant GO biological process which is colored according to the -log10(p.adjust).
ColorectumSERGO analysis - Figure of enriched GO biological processes: Top 15 enriched GO BP terms are showed in the bar plot of each disease state in each tissue. Each row represents a significant GO biological process which is colored according to the -log10(p.adjust).
ColorectumMSSGO analysis - Figure of enriched GO biological processes: Top 15 enriched GO BP terms are showed in the bar plot of each disease state in each tissue. Each row represents a significant GO biological process which is colored according to the -log10(p.adjust).
ColorectumMSI-HGO analysis - Figure of enriched GO biological processes: Top 15 enriched GO BP terms are showed in the bar plot of each disease state in each tissue. Each row represents a significant GO biological process which is colored according to the -log10(p.adjust).
ColorectumFAPGO analysis - Figure of enriched GO biological processes: Top 15 enriched GO BP terms are showed in the bar plot of each disease state in each tissue. Each row represents a significant GO biological process which is colored according to the -log10(p.adjust).
∗Top 15 enriched GO BP terms are showed in the bar plot of each disease state in each tissue. Each row represents a significant GO biological process which is colored according to the -log10(p.adjust).
Page: 1 2 3 4 5 6 7 8 9 

check button Enriched GO biological processes.
GO IDTissueDisease StageDescriptionGene RatioBg Ratiopvaluep.adjustCount
GO:000838026EsophagusHGINRNA splicing160/2587434/187233.74e-341.12e-30160
GO:000037520EsophagusHGINRNA splicing, via transesterification reactions115/2587324/187233.16e-233.80e-20115
GO:000037720EsophagusHGINRNA splicing, via transesterification reactions with bulged adenosine as nucleophile113/2587320/187231.24e-229.26e-20113
GO:000039820EsophagusHGINmRNA splicing, via spliceosome113/2587320/187231.24e-229.26e-20113
GO:000641727EsophagusHGINregulation of translation139/2587468/187231.46e-197.98e-17139
GO:190331120EsophagusHGINregulation of mRNA metabolic process91/2587288/187235.06e-159.78e-1391
GO:000989520EsophagusHGINnegative regulation of catabolic process87/2587320/187231.74e-101.68e-0887
GO:003133026EsophagusHGINnegative regulation of cellular catabolic process74/2587262/187236.27e-105.30e-0874
GO:000640120EsophagusHGINRNA catabolic process77/2587278/187237.63e-106.36e-0877
GO:000640220EsophagusHGINmRNA catabolic process67/2587232/187231.47e-091.13e-0767
GO:003465519EsophagusHGINnucleobase-containing compound catabolic process98/2587407/187231.44e-088.94e-0798
GO:004670017EsophagusHGINheterocycle catabolic process103/2587445/187235.44e-082.99e-06103
GO:004427018EsophagusHGINcellular nitrogen compound catabolic process103/2587451/187231.10e-075.56e-06103
GO:001943917EsophagusHGINaromatic compound catabolic process105/2587467/187231.89e-079.31e-06105
GO:190136117EsophagusHGINorganic cyclic compound catabolic process106/2587495/187231.94e-067.13e-05106
GO:00342496EsophagusHGINnegative regulation of cellular amide metabolic process66/2587273/187232.74e-069.60e-0566
GO:190331226EsophagusHGINnegative regulation of mRNA metabolic process29/258792/187231.01e-052.92e-0429
GO:00171486EsophagusHGINnegative regulation of translation59/2587245/187231.03e-052.96e-0459
GO:006101318EsophagusHGINregulation of mRNA catabolic process43/2587166/187232.48e-056.53e-0443
GO:000164917EsophagusHGINosteoblast differentiation50/2587229/187235.88e-048.30e-0350
Page: 1 2 3 4 5 6 7 8 9 10 11 12 13 14 15 16 17 18 19 

check button Enriched KEGG pathways.
Pathway IDTissueDisease StageDescriptionGene RatioBg Ratiopvaluep.adjustqvalueCount
Page: 1 

Top

Cell-cell communication analysis

check buttonIdentification of potential cell-cell interactions between two cell types and their ligand-receptor pairs for different disease states
LigandReceptorLRpairPathwayTissueDisease Stage
Page: 1 

Top

Single-cell gene regulatory network inference analysis

check buttonFind out the significant the regulons (TFs) and the target genes of each regulon across cell types for different disease states
TFCell TypeTissueDisease StageTarget GeneRSSRegulon Activity
∗The dot plots of a searched regulon are shown for all cell subpopulations in each disease state of each tissue based on the regulon specific score inferred using pySCENIC and by calculating the average expression.
Page: 1 

Top

Somatic mutation of malignant transformation related genes

check buttonAnnotation of somatic variants for genes involved in malignant transformation
Hugo SymbolVariant ClassVariant ClassificationdbSNP RSHGVScHGVSpHGVSp ShortSWISSPROTBIOTYPESIFTPolyPhenTumor Sample BarcodeTissueHistologySexAgeStageTherapy TypesDrugsOutcome
SYNCRIPSNVMissense_Mutationc.1324C>Tp.Pro442Serp.P442SO60506protein_codingtolerated(0.17)probably_damaging(0.968)TCGA-AC-A23H-01Breastbreast invasive carcinomaFemale>=65I/IIUnknownUnknownPD
SYNCRIPSNVMissense_Mutationrs750883103c.1555N>Ap.Gly519Serp.G519SO60506protein_codingtolerated(0.14)probably_damaging(0.987)TCGA-AN-A0AK-01Breastbreast invasive carcinomaFemale>=65I/IIUnknownUnknownSD
SYNCRIPSNVMissense_Mutationnovelc.857N>Ap.Arg286Lysp.R286KO60506protein_codingdeleterious(0.01)probably_damaging(0.945)TCGA-BH-A0B6-01Breastbreast invasive carcinomaFemale<65I/IIUnknownUnknownSD
SYNCRIPSNVMissense_Mutationc.575G>Ap.Arg192Hisp.R192HO60506protein_codingdeleterious(0.03)probably_damaging(1)TCGA-D8-A142-01Breastbreast invasive carcinomaFemale>=65I/IIChemotherapycyclophosphamidSD
SYNCRIPSNVMissense_Mutationc.48N>Ap.Asp16Glup.D16EO60506protein_codingtolerated(0.55)benign(0.007)TCGA-D8-A1XK-01Breastbreast invasive carcinomaFemale<65I/IIChemotherapydoxorubicine+cyclophosphamideSD
SYNCRIPSNVMissense_Mutationnovelc.617C>Tp.Ala206Valp.A206VO60506protein_codingdeleterious(0)probably_damaging(0.999)TCGA-2W-A8YY-01Cervixcervical & endocervical cancerFemale<65I/IIChemotherapycisplatinCR
SYNCRIPSNVMissense_Mutationrs370683161c.1564G>Ap.Gly522Serp.G522SO60506protein_codingtolerated(0.12)benign(0.272)TCGA-EA-A410-01Cervixcervical & endocervical cancerFemale<65I/IIUnknownUnknownSD
SYNCRIPSNVMissense_Mutationc.1598G>Cp.Arg533Thrp.R533TO60506protein_codingtolerated(0.48)benign(0)TCGA-EK-A2PM-01Cervixcervical & endocervical cancerFemale>=65I/IIUnknownUnknownSD
SYNCRIPSNVMissense_Mutationc.316N>Ap.Glu106Lysp.E106KO60506protein_codingtolerated(0.72)benign(0.031)TCGA-MY-A5BD-01Cervixcervical & endocervical cancerFemale<65I/IIChemotherapycisplatinCR
SYNCRIPSNVMissense_Mutationnovelc.508N>Tp.Pro170Serp.P170SO60506protein_codingdeleterious(0)probably_damaging(0.988)TCGA-ZJ-AAXD-01Cervixcervical & endocervical cancerFemale<65III/IVUnknownUnknownSD
Page: 1 2 3 4 5 6 7 8 9 10 

Top

Related drugs of malignant transformation related genes

check buttonIdentification of chemicals and drugs interact with genes involved in malignant transfromation
(DGIdb 4.0)
Entrez IDSymbolCategoryInteraction TypesDrug Claim NameDrug NamePMIDs
Page: 1