
|
|||||
|
 | |
| |
| |
| |
| |
| |
|
Gene: SYNC |
Gene summary for SYNC |
| Gene information | Species | Human | Gene symbol | SYNC | Gene ID | 81493 |
| Gene name | syncoilin, intermediate filament protein | |
| Gene Alias | SYNC1 | |
| Cytomap | 1p35.1 | |
| Gene Type | protein-coding | GO ID | GO:0008150 | UniProtAcc | Q9H7C4 |
Top |
Malignant transformation analysis |
| Identification of the aberrant gene expression in precancerous and cancerous lesions by comparing the gene expression of stem-like cells in diseased tissues with normal stem cells |
| Entrez ID | Symbol | Replicates | Species | Organ | Tissue | Adj P-value | Log2FC | Malignancy |
| 81493 | SYNC | LZE4T | Human | Esophagus | ESCC | 2.17e-07 | 2.43e-01 | 0.0811 |
| 81493 | SYNC | LZE5T | Human | Esophagus | ESCC | 1.55e-04 | 4.48e-01 | 0.0514 |
| 81493 | SYNC | LZE7T | Human | Esophagus | ESCC | 1.96e-16 | 1.00e+00 | 0.0667 |
| 81493 | SYNC | LZE8T | Human | Esophagus | ESCC | 2.34e-05 | 2.78e-01 | 0.067 |
| 81493 | SYNC | LZE20T | Human | Esophagus | ESCC | 2.20e-08 | 2.94e-01 | 0.0662 |
| 81493 | SYNC | LZE22T | Human | Esophagus | ESCC | 1.18e-10 | 6.34e-01 | 0.068 |
| 81493 | SYNC | LZE24T | Human | Esophagus | ESCC | 1.06e-22 | 6.11e-01 | 0.0596 |
| 81493 | SYNC | LZE6T | Human | Esophagus | ESCC | 2.09e-09 | 3.93e-01 | 0.0845 |
| 81493 | SYNC | P2T-E | Human | Esophagus | ESCC | 1.08e-05 | 1.03e-01 | 0.1177 |
| 81493 | SYNC | P10T-E | Human | Esophagus | ESCC | 3.29e-13 | 2.17e-01 | 0.116 |
| 81493 | SYNC | P16T-E | Human | Esophagus | ESCC | 1.88e-02 | 3.11e-02 | 0.1153 |
| 81493 | SYNC | P21T-E | Human | Esophagus | ESCC | 1.50e-03 | 9.06e-02 | 0.1617 |
| 81493 | SYNC | P57T-E | Human | Esophagus | ESCC | 1.22e-05 | 4.68e-02 | 0.0926 |
| 81493 | SYNC | P79T-E | Human | Esophagus | ESCC | 2.86e-05 | 4.35e-02 | 0.1154 |
| 81493 | SYNC | P130T-E | Human | Esophagus | ESCC | 5.72e-19 | 2.99e-01 | 0.1676 |
| Page: 1 |
| Tissue | Expression Dynamics | Abbreviation |
| Esophagus | 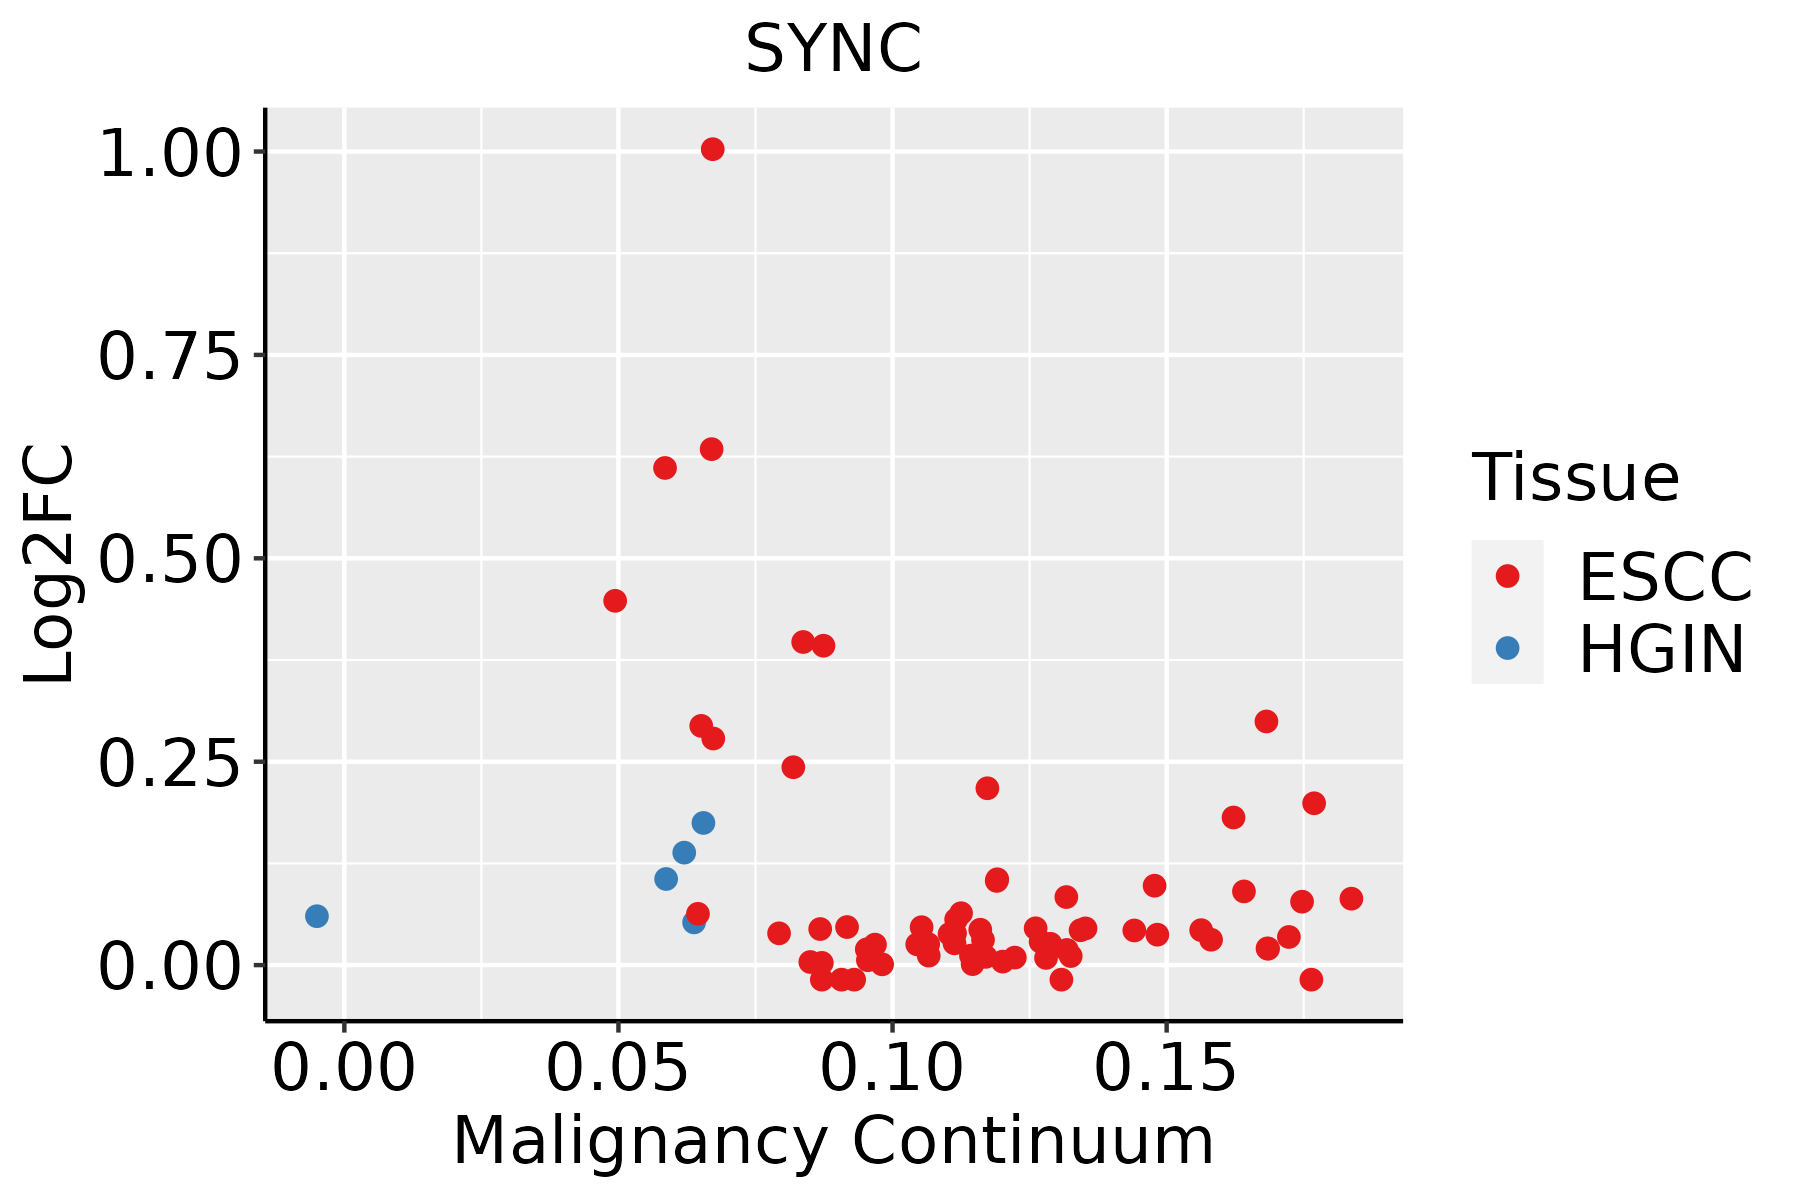 | ESCC: Esophageal squamous cell carcinoma |
| HGIN: High-grade intraepithelial neoplasias | ||
| LGIN: Low-grade intraepithelial neoplasias |
| ∗log2FC in expression of this searched gene in stem-like cells from each diseased tissue sample relative to stem-like cells in normal samples in each tissue plotted against the malignancy continuum. Samples are colored based on if they are from different disease stage. |
Top |
Malignant transformation related pathway analysis |
| Find out the enriched GO biological processes and KEGG pathways involved in transition from healthy to precancer to cancer |
| Tissue | Disease Stage | Enriched GO biological Processes |
| Colorectum | AD |  |
| Colorectum | SER |  |
| Colorectum | MSS |  |
| Colorectum | MSI-H |  |
| Colorectum | FAP |  |
| ∗Top 15 enriched GO BP terms are showed in the bar plot of each disease state in each tissue. Each row represents a significant GO biological process which is colored according to the -log10(p.adjust). |
| Page: 1 2 3 4 5 6 7 8 9 |
| GO ID | Tissue | Disease Stage | Description | Gene Ratio | Bg Ratio | pvalue | p.adjust | Count |
| GO:000838026 | Esophagus | HGIN | RNA splicing | 160/2587 | 434/18723 | 3.74e-34 | 1.12e-30 | 160 |
| GO:000037520 | Esophagus | HGIN | RNA splicing, via transesterification reactions | 115/2587 | 324/18723 | 3.16e-23 | 3.80e-20 | 115 |
| GO:000037720 | Esophagus | HGIN | RNA splicing, via transesterification reactions with bulged adenosine as nucleophile | 113/2587 | 320/18723 | 1.24e-22 | 9.26e-20 | 113 |
| GO:000039820 | Esophagus | HGIN | mRNA splicing, via spliceosome | 113/2587 | 320/18723 | 1.24e-22 | 9.26e-20 | 113 |
| GO:000641727 | Esophagus | HGIN | regulation of translation | 139/2587 | 468/18723 | 1.46e-19 | 7.98e-17 | 139 |
| GO:190331120 | Esophagus | HGIN | regulation of mRNA metabolic process | 91/2587 | 288/18723 | 5.06e-15 | 9.78e-13 | 91 |
| GO:000989520 | Esophagus | HGIN | negative regulation of catabolic process | 87/2587 | 320/18723 | 1.74e-10 | 1.68e-08 | 87 |
| GO:003133026 | Esophagus | HGIN | negative regulation of cellular catabolic process | 74/2587 | 262/18723 | 6.27e-10 | 5.30e-08 | 74 |
| GO:000640120 | Esophagus | HGIN | RNA catabolic process | 77/2587 | 278/18723 | 7.63e-10 | 6.36e-08 | 77 |
| GO:000640220 | Esophagus | HGIN | mRNA catabolic process | 67/2587 | 232/18723 | 1.47e-09 | 1.13e-07 | 67 |
| GO:003465519 | Esophagus | HGIN | nucleobase-containing compound catabolic process | 98/2587 | 407/18723 | 1.44e-08 | 8.94e-07 | 98 |
| GO:004670017 | Esophagus | HGIN | heterocycle catabolic process | 103/2587 | 445/18723 | 5.44e-08 | 2.99e-06 | 103 |
| GO:004427018 | Esophagus | HGIN | cellular nitrogen compound catabolic process | 103/2587 | 451/18723 | 1.10e-07 | 5.56e-06 | 103 |
| GO:001943917 | Esophagus | HGIN | aromatic compound catabolic process | 105/2587 | 467/18723 | 1.89e-07 | 9.31e-06 | 105 |
| GO:190136117 | Esophagus | HGIN | organic cyclic compound catabolic process | 106/2587 | 495/18723 | 1.94e-06 | 7.13e-05 | 106 |
| GO:00342496 | Esophagus | HGIN | negative regulation of cellular amide metabolic process | 66/2587 | 273/18723 | 2.74e-06 | 9.60e-05 | 66 |
| GO:190331226 | Esophagus | HGIN | negative regulation of mRNA metabolic process | 29/2587 | 92/18723 | 1.01e-05 | 2.92e-04 | 29 |
| GO:00171486 | Esophagus | HGIN | negative regulation of translation | 59/2587 | 245/18723 | 1.03e-05 | 2.96e-04 | 59 |
| GO:006101318 | Esophagus | HGIN | regulation of mRNA catabolic process | 43/2587 | 166/18723 | 2.48e-05 | 6.53e-04 | 43 |
| GO:000164917 | Esophagus | HGIN | osteoblast differentiation | 50/2587 | 229/18723 | 5.88e-04 | 8.30e-03 | 50 |
| Page: 1 2 3 4 5 6 7 8 9 10 11 12 13 14 15 16 17 18 19 |
| Pathway ID | Tissue | Disease Stage | Description | Gene Ratio | Bg Ratio | pvalue | p.adjust | qvalue | Count |
| Page: 1 |
Top |
Cell-cell communication analysis |
| Identification of potential cell-cell interactions between two cell types and their ligand-receptor pairs for different disease states |
| Ligand | Receptor | LRpair | Pathway | Tissue | Disease Stage |
| Page: 1 |
Top |
Single-cell gene regulatory network inference analysis |
| Find out the significant the regulons (TFs) and the target genes of each regulon across cell types for different disease states |
| TF | Cell Type | Tissue | Disease Stage | Target Gene | RSS | Regulon Activity |
| ∗The dot plots of a searched regulon are shown for all cell subpopulations in each disease state of each tissue based on the regulon specific score inferred using pySCENIC and by calculating the average expression. |
| Page: 1 |
Top |
Somatic mutation of malignant transformation related genes |
| Annotation of somatic variants for genes involved in malignant transformation |
| Hugo Symbol | Variant Class | Variant Classification | dbSNP RS | HGVSc | HGVSp | HGVSp Short | SWISSPROT | BIOTYPE | SIFT | PolyPhen | Tumor Sample Barcode | Tissue | Histology | Sex | Age | Stage | Therapy Types | Drugs | Outcome |
| SYNC | SNV | Missense_Mutation | c.809N>C | p.Phe270Ser | p.F270S | Q9H7C4 | protein_coding | tolerated(0.19) | probably_damaging(0.977) | TCGA-A6-3809-01 | Colorectum | colon adenocarcinoma | Female | >=65 | I/II | Unknown | Unknown | SD | |
| SYNC | SNV | Missense_Mutation | c.1193T>C | p.Leu398Pro | p.L398P | Q9H7C4 | protein_coding | deleterious(0) | probably_damaging(0.993) | TCGA-AA-3864-01 | Colorectum | colon adenocarcinoma | Male | >=65 | I/II | Unknown | Unknown | SD | |
| SYNC | SNV | Missense_Mutation | novel | c.1120N>A | p.Ala374Thr | p.A374T | Q9H7C4 | protein_coding | tolerated(0.14) | benign(0.053) | TCGA-AA-3947-01 | Colorectum | colon adenocarcinoma | Female | <65 | I/II | Unknown | Unknown | SD |
| SYNC | SNV | Missense_Mutation | c.1090N>G | p.Thr364Ala | p.T364A | Q9H7C4 | protein_coding | tolerated(0.26) | possibly_damaging(0.642) | TCGA-AA-A01P-01 | Colorectum | colon adenocarcinoma | Female | >=65 | III/IV | Unknown | Unknown | PD | |
| SYNC | SNV | Missense_Mutation | c.611N>A | p.Arg204Gln | p.R204Q | Q9H7C4 | protein_coding | tolerated(0.1) | probably_damaging(0.998) | TCGA-AD-A5EJ-01 | Colorectum | colon adenocarcinoma | Female | >=65 | I/II | Unknown | Unknown | SD | |
| SYNC | SNV | Missense_Mutation | rs763587503 | c.472G>A | p.Glu158Lys | p.E158K | Q9H7C4 | protein_coding | tolerated(0.77) | benign(0) | TCGA-AG-3591-01 | Colorectum | rectum adenocarcinoma | Female | >=65 | I/II | Unspecific | Complete Response | |
| SYNC | SNV | Missense_Mutation | novel | c.1116G>T | p.Lys372Asn | p.K372N | Q9H7C4 | protein_coding | deleterious(0) | possibly_damaging(0.864) | TCGA-AG-A002-01 | Colorectum | rectum adenocarcinoma | Male | <65 | I/II | Unknown | Unknown | SD |
| SYNC | SNV | Missense_Mutation | c.418G>A | p.Gly140Arg | p.G140R | Q9H7C4 | protein_coding | tolerated_low_confidence(0.13) | benign(0.01) | TCGA-EI-6507-01 | Colorectum | rectum adenocarcinoma | Male | <65 | I/II | Unknown | Unknown | SD | |
| SYNC | SNV | Missense_Mutation | novel | c.1337C>T | p.Ala446Val | p.A446V | Q9H7C4 | protein_coding | tolerated(0.12) | possibly_damaging(0.698) | TCGA-A5-A1OF-01 | Endometrium | uterine corpus endometrioid carcinoma | Female | <65 | I/II | Unknown | Unknown | SD |
| SYNC | SNV | Missense_Mutation | novel | c.807G>T | p.Gln269His | p.Q269H | Q9H7C4 | protein_coding | deleterious(0.02) | probably_damaging(0.988) | TCGA-A5-A1OF-01 | Endometrium | uterine corpus endometrioid carcinoma | Female | <65 | I/II | Unknown | Unknown | SD |
| Page: 1 2 3 |
Top |
Related drugs of malignant transformation related genes |
| Identification of chemicals and drugs interact with genes involved in malignant transfromation |
| (DGIdb 4.0) |
| Entrez ID | Symbol | Category | Interaction Types | Drug Claim Name | Drug Name | PMIDs |
| Page: 1 |

Copyright 2023-Present -The University of Texas Health Science Center at Houston |