
|
|||||
|
 | |
| |
| |
| |
| |
| |
|
Gene: SYDE1 |
Gene summary for SYDE1 |
| Gene information | Species | Human | Gene symbol | SYDE1 | Gene ID | 85360 |
| Gene name | synapse defective Rho GTPase homolog 1 | |
| Gene Alias | 7h3 | |
| Cytomap | 19p13.12 | |
| Gene Type | protein-coding | GO ID | GO:0000003 | UniProtAcc | Q6ZW31 |
Top |
Malignant transformation analysis |
| Identification of the aberrant gene expression in precancerous and cancerous lesions by comparing the gene expression of stem-like cells in diseased tissues with normal stem cells |
| Entrez ID | Symbol | Replicates | Species | Organ | Tissue | Adj P-value | Log2FC | Malignancy |
| 85360 | SYDE1 | ATC09 | Human | Thyroid | ATC | 2.95e-02 | 1.42e-01 | 0.2871 |
| 85360 | SYDE1 | ATC11 | Human | Thyroid | ATC | 3.71e-05 | 3.98e-01 | 0.3386 |
| 85360 | SYDE1 | ATC12 | Human | Thyroid | ATC | 1.84e-15 | 3.20e-01 | 0.34 |
| 85360 | SYDE1 | ATC13 | Human | Thyroid | ATC | 2.71e-23 | 4.69e-01 | 0.34 |
| 85360 | SYDE1 | ATC1 | Human | Thyroid | ATC | 1.55e-03 | 1.83e-01 | 0.2878 |
| 85360 | SYDE1 | ATC2 | Human | Thyroid | ATC | 1.24e-20 | 9.71e-01 | 0.34 |
| 85360 | SYDE1 | ATC3 | Human | Thyroid | ATC | 4.97e-10 | 4.66e-01 | 0.338 |
| 85360 | SYDE1 | ATC4 | Human | Thyroid | ATC | 5.41e-21 | 4.00e-01 | 0.34 |
| 85360 | SYDE1 | ATC5 | Human | Thyroid | ATC | 6.64e-26 | 5.26e-01 | 0.34 |
| Page: 1 |
| Tissue | Expression Dynamics | Abbreviation |
| Thyroid | 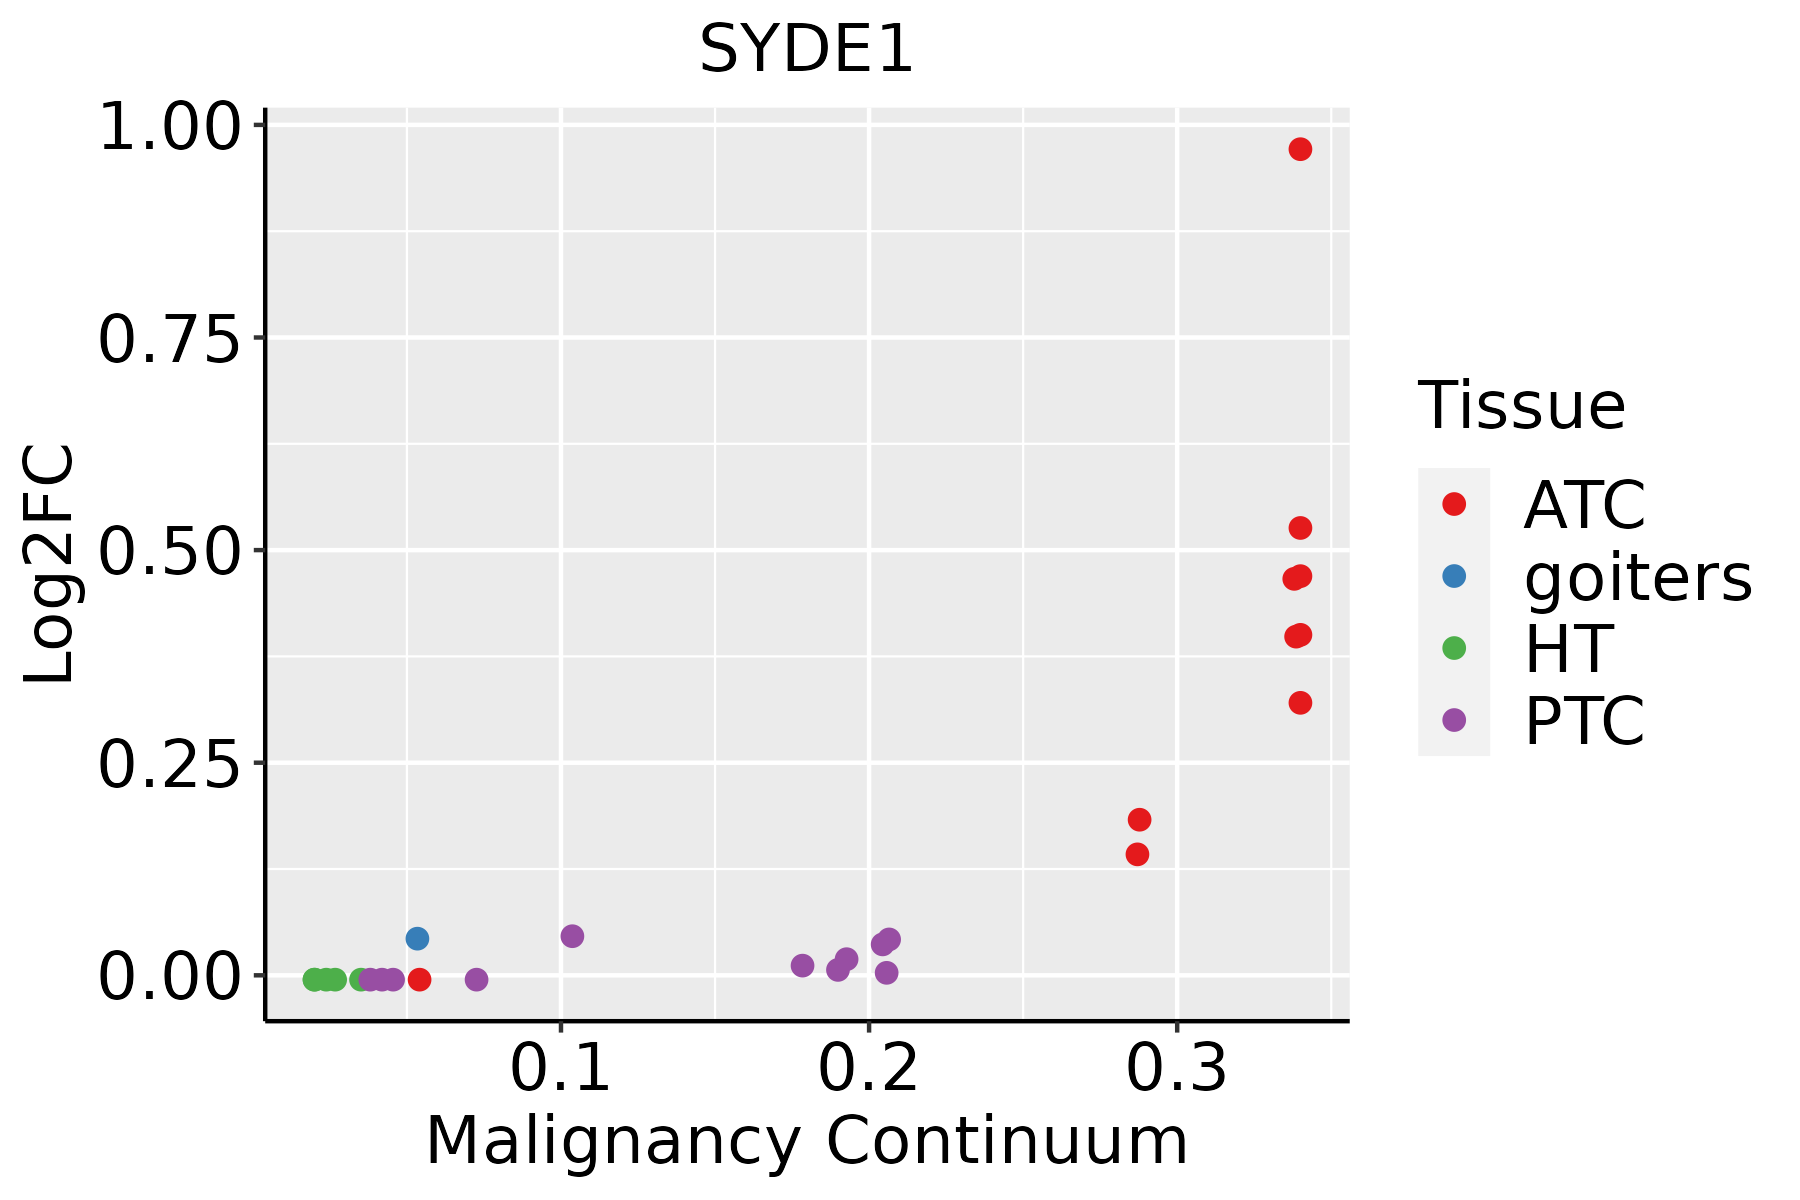 | ATC: Anaplastic thyroid cancer |
| HT: Hashimoto's thyroiditis | ||
| PTC: Papillary thyroid cancer |
| ∗log2FC in expression of this searched gene in stem-like cells from each diseased tissue sample relative to stem-like cells in normal samples in each tissue plotted against the malignancy continuum. Samples are colored based on if they are from different disease stage. |
Top |
Malignant transformation related pathway analysis |
| Find out the enriched GO biological processes and KEGG pathways involved in transition from healthy to precancer to cancer |
| Tissue | Disease Stage | Enriched GO biological Processes |
| Colorectum | AD |  |
| Colorectum | SER |  |
| Colorectum | MSS |  |
| Colorectum | MSI-H |  |
| Colorectum | FAP |  |
| ∗Top 15 enriched GO BP terms are showed in the bar plot of each disease state in each tissue. Each row represents a significant GO biological process which is colored according to the -log10(p.adjust). |
| Page: 1 2 3 4 5 6 7 8 9 |
| GO ID | Tissue | Disease Stage | Description | Gene Ratio | Bg Ratio | pvalue | p.adjust | Count |
| GO:000166731 | Thyroid | ATC | ameboidal-type cell migration | 228/6293 | 475/18723 | 3.72e-11 | 1.22e-09 | 228 |
| GO:0031532111 | Thyroid | ATC | actin cytoskeleton reorganization | 62/6293 | 107/18723 | 2.01e-07 | 3.17e-06 | 62 |
| GO:004308719 | Thyroid | ATC | regulation of GTPase activity | 153/6293 | 348/18723 | 3.24e-05 | 2.68e-04 | 153 |
| GO:004354715 | Thyroid | ATC | positive regulation of GTPase activity | 106/6293 | 255/18723 | 4.58e-03 | 1.89e-02 | 106 |
| GO:000756517 | Thyroid | ATC | female pregnancy | 82/6293 | 193/18723 | 6.04e-03 | 2.42e-02 | 82 |
| Page: 1 |
| Pathway ID | Tissue | Disease Stage | Description | Gene Ratio | Bg Ratio | pvalue | p.adjust | qvalue | Count |
| Page: 1 |
Top |
Cell-cell communication analysis |
| Identification of potential cell-cell interactions between two cell types and their ligand-receptor pairs for different disease states |
| Ligand | Receptor | LRpair | Pathway | Tissue | Disease Stage |
| Page: 1 |
Top |
Single-cell gene regulatory network inference analysis |
| Find out the significant the regulons (TFs) and the target genes of each regulon across cell types for different disease states |
| TF | Cell Type | Tissue | Disease Stage | Target Gene | RSS | Regulon Activity |
| ∗The dot plots of a searched regulon are shown for all cell subpopulations in each disease state of each tissue based on the regulon specific score inferred using pySCENIC and by calculating the average expression. |
| Page: 1 |
Top |
Somatic mutation of malignant transformation related genes |
| Annotation of somatic variants for genes involved in malignant transformation |
| Hugo Symbol | Variant Class | Variant Classification | dbSNP RS | HGVSc | HGVSp | HGVSp Short | SWISSPROT | BIOTYPE | SIFT | PolyPhen | Tumor Sample Barcode | Tissue | Histology | Sex | Age | Stage | Therapy Types | Drugs | Outcome |
| SYDE1 | SNV | Missense_Mutation | c.1404C>G | p.Ile468Met | p.I468M | Q6ZW31 | protein_coding | deleterious(0) | probably_damaging(0.997) | TCGA-A2-A0CM-01 | Breast | breast invasive carcinoma | Female | <65 | I/II | Chemotherapy | adriamycin | PD | |
| SYDE1 | SNV | Missense_Mutation | novel | c.2011N>A | p.Ser671Thr | p.S671T | Q6ZW31 | protein_coding | tolerated(0.1) | benign(0.053) | TCGA-A8-A09E-01 | Breast | breast invasive carcinoma | Female | >=65 | III/IV | Hormone Therapy | anastrozole | SD |
| SYDE1 | SNV | Missense_Mutation | c.2007N>A | p.Phe669Leu | p.F669L | Q6ZW31 | protein_coding | tolerated(0.67) | benign(0.306) | TCGA-A8-A09G-01 | Breast | breast invasive carcinoma | Female | >=65 | III/IV | Unknown | Unknown | SD | |
| SYDE1 | SNV | Missense_Mutation | c.1384N>A | p.Glu462Lys | p.E462K | Q6ZW31 | protein_coding | deleterious(0.02) | probably_damaging(1) | TCGA-D8-A1JA-01 | Breast | breast invasive carcinoma | Female | <65 | III/IV | Chemotherapy | adriamycin | PD | |
| SYDE1 | SNV | Missense_Mutation | c.1609N>T | p.Arg537Cys | p.R537C | Q6ZW31 | protein_coding | deleterious(0.01) | possibly_damaging(0.901) | TCGA-EW-A1P8-01 | Breast | breast invasive carcinoma | Female | <65 | III/IV | Chemotherapy | fluorouracil | PD | |
| SYDE1 | SNV | Missense_Mutation | c.1763N>G | p.His588Arg | p.H588R | Q6ZW31 | protein_coding | tolerated(1) | benign(0) | TCGA-EW-A1P8-01 | Breast | breast invasive carcinoma | Female | <65 | III/IV | Chemotherapy | fluorouracil | PD | |
| SYDE1 | insertion | Frame_Shift_Ins | novel | c.1482_1483insTTTT | p.Val495PhefsTer19 | p.V495Ffs*19 | Q6ZW31 | protein_coding | TCGA-A7-A0CE-01 | Breast | breast invasive carcinoma | Female | <65 | I/II | Chemotherapy | adriamycin | SD | ||
| SYDE1 | insertion | Frame_Shift_Ins | novel | c.1484_1485insTTTGTTTTTTGAGACAGTC | p.Glu497PhefsTer22 | p.E497Ffs*22 | Q6ZW31 | protein_coding | TCGA-A7-A0CE-01 | Breast | breast invasive carcinoma | Female | <65 | I/II | Chemotherapy | adriamycin | SD | ||
| SYDE1 | insertion | In_Frame_Ins | novel | c.2013_2014insTCAAGT | p.Ser671_Gly672insSerSer | p.S671_G672insSS | Q6ZW31 | protein_coding | TCGA-A8-A09E-01 | Breast | breast invasive carcinoma | Female | >=65 | III/IV | Hormone Therapy | anastrozole | SD | ||
| SYDE1 | SNV | Missense_Mutation | novel | c.374N>A | p.Pro125His | p.P125H | Q6ZW31 | protein_coding | deleterious(0.01) | benign(0.319) | TCGA-2W-A8YY-01 | Cervix | cervical & endocervical cancer | Female | <65 | I/II | Chemotherapy | cisplatin | CR |
| Page: 1 2 3 4 5 6 7 |
Top |
Related drugs of malignant transformation related genes |
| Identification of chemicals and drugs interact with genes involved in malignant transfromation |
| (DGIdb 4.0) |
| Entrez ID | Symbol | Category | Interaction Types | Drug Claim Name | Drug Name | PMIDs |
| Page: 1 |

Copyright 2023-Present -The University of Texas Health Science Center at Houston |