
|
|||||
|
 | |
| |
| |
| |
| |
| |
|
Gene: SYCP2 |
Gene summary for SYCP2 |
| Gene information | Species | Human | Gene symbol | SYCP2 | Gene ID | 10388 |
| Gene name | synaptonemal complex protein 2 | |
| Gene Alias | SCP-2 | |
| Cytomap | 20q13.33 | |
| Gene Type | protein-coding | GO ID | GO:0000003 | UniProtAcc | Q9BX26 |
Top |
Malignant transformation analysis |
| Identification of the aberrant gene expression in precancerous and cancerous lesions by comparing the gene expression of stem-like cells in diseased tissues with normal stem cells |
| Entrez ID | Symbol | Replicates | Species | Organ | Tissue | Adj P-value | Log2FC | Malignancy |
| 10388 | SYCP2 | CA_HPV_2 | Human | Cervix | CC | 2.14e-13 | 3.55e-01 | 0.0391 |
| 10388 | SYCP2 | HSIL_HPV_2 | Human | Cervix | HSIL_HPV | 6.49e-16 | 4.22e-01 | 0.0208 |
| 10388 | SYCP2 | CCI_1 | Human | Cervix | CC | 5.05e-10 | 7.66e-01 | 0.528 |
| 10388 | SYCP2 | CCI_2 | Human | Cervix | CC | 1.77e-07 | 6.24e-01 | 0.5249 |
| 10388 | SYCP2 | CCI_3 | Human | Cervix | CC | 1.00e-20 | 8.81e-01 | 0.516 |
| 10388 | SYCP2 | CCII_1 | Human | Cervix | CC | 4.87e-04 | 2.20e-01 | 0.3249 |
| 10388 | SYCP2 | Tumor | Human | Cervix | CC | 2.62e-11 | 2.67e-01 | 0.1241 |
| 10388 | SYCP2 | sample1 | Human | Cervix | CC | 2.31e-03 | 2.92e-01 | 0.0959 |
| 10388 | SYCP2 | sample3 | Human | Cervix | CC | 9.38e-20 | 3.74e-01 | 0.1387 |
| 10388 | SYCP2 | T1 | Human | Cervix | CC | 8.52e-04 | 2.33e-01 | 0.0918 |
| 10388 | SYCP2 | T3 | Human | Cervix | CC | 4.40e-21 | 3.82e-01 | 0.1389 |
| 10388 | SYCP2 | LZE7T | Human | Esophagus | ESCC | 1.95e-03 | 3.13e-01 | 0.0667 |
| 10388 | SYCP2 | LZE24T | Human | Esophagus | ESCC | 1.93e-05 | 1.50e-01 | 0.0596 |
| 10388 | SYCP2 | P2T-E | Human | Esophagus | ESCC | 8.97e-05 | 1.11e-01 | 0.1177 |
| 10388 | SYCP2 | P10T-E | Human | Esophagus | ESCC | 1.73e-03 | 5.90e-02 | 0.116 |
| 10388 | SYCP2 | P12T-E | Human | Esophagus | ESCC | 4.14e-54 | 1.07e+00 | 0.1122 |
| 10388 | SYCP2 | P16T-E | Human | Esophagus | ESCC | 7.04e-12 | 1.32e-01 | 0.1153 |
| 10388 | SYCP2 | P26T-E | Human | Esophagus | ESCC | 2.19e-02 | 1.00e-01 | 0.1276 |
| 10388 | SYCP2 | P36T-E | Human | Esophagus | ESCC | 1.75e-19 | 8.50e-01 | 0.1187 |
| 10388 | SYCP2 | P37T-E | Human | Esophagus | ESCC | 1.31e-03 | 8.68e-02 | 0.1371 |
| Page: 1 2 |
| Tissue | Expression Dynamics | Abbreviation |
| Cervix | 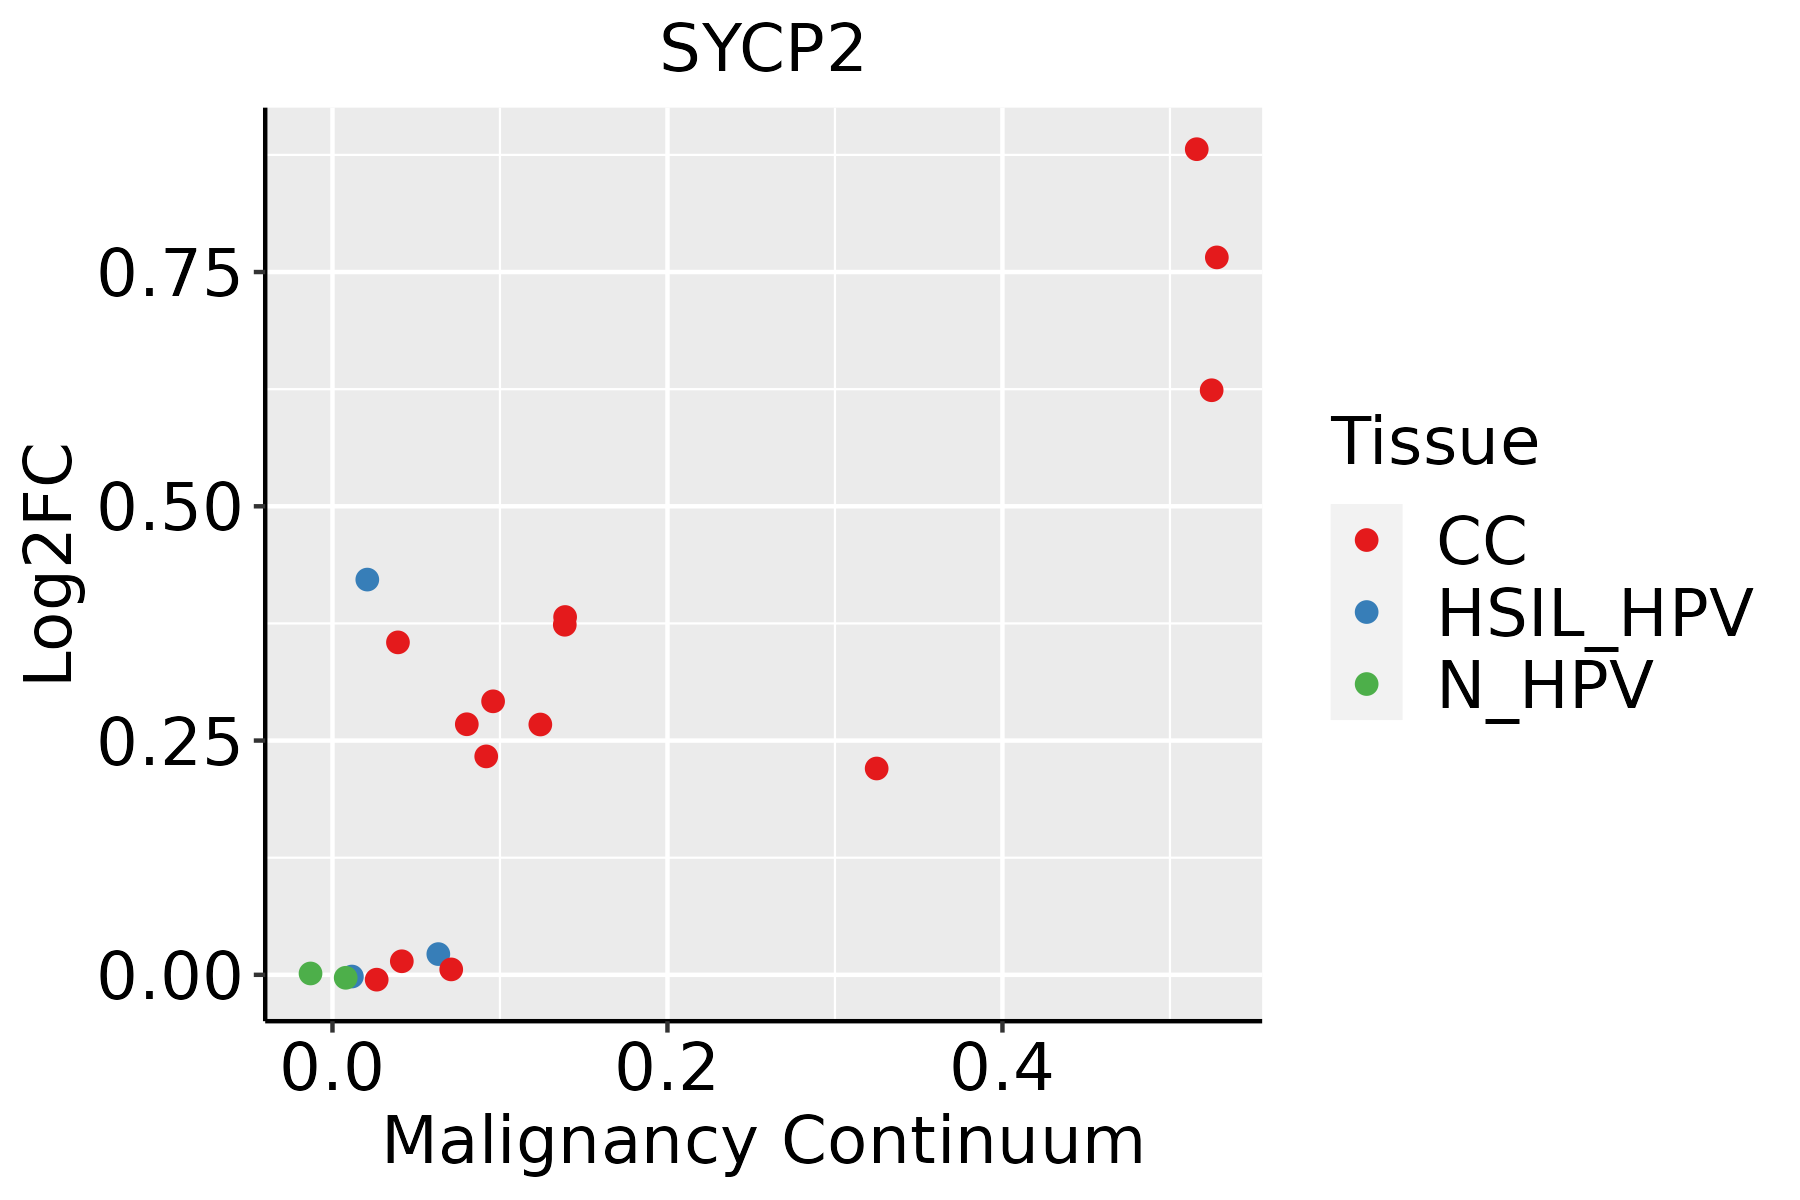 | CC: Cervix cancer |
| HSIL_HPV: HPV-infected high-grade squamous intraepithelial lesions | ||
| N_HPV: HPV-infected normal cervix | ||
| Esophagus | 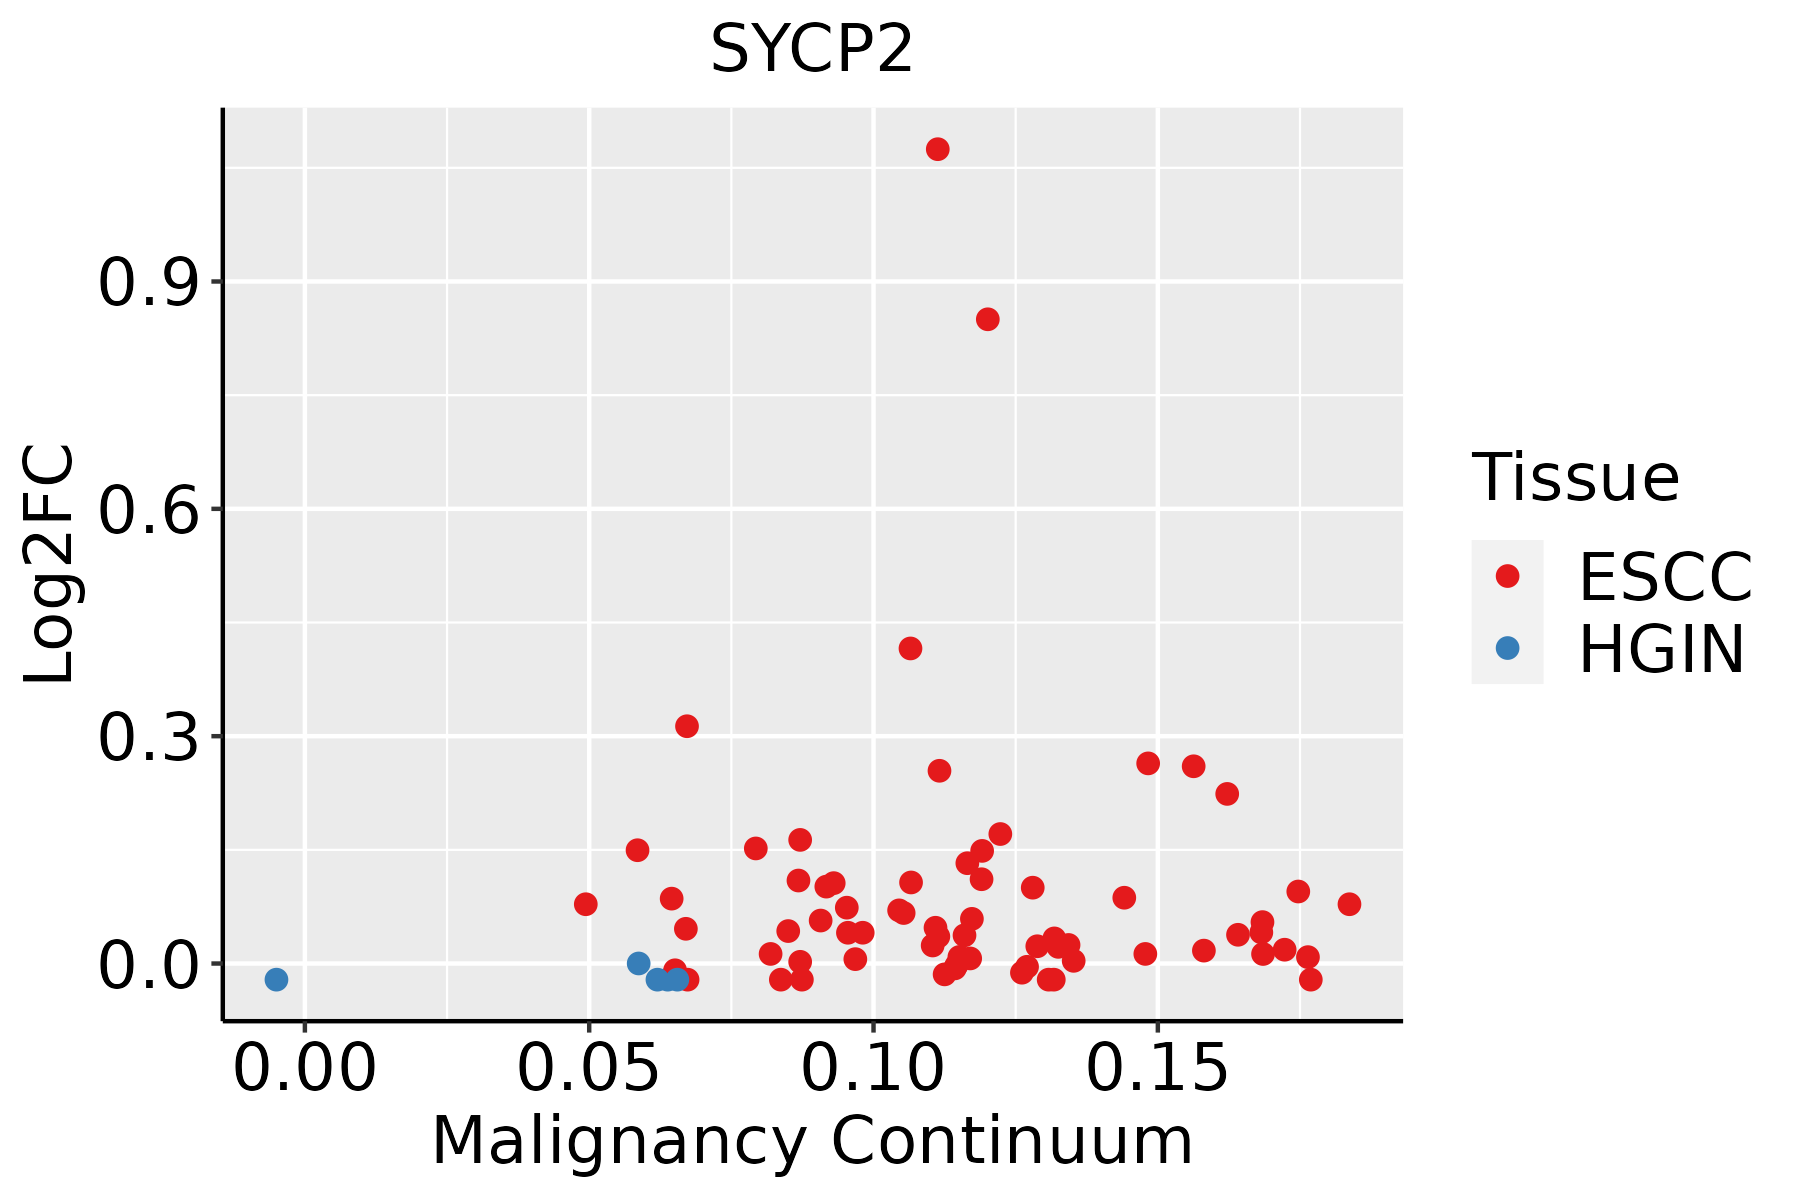 | ESCC: Esophageal squamous cell carcinoma |
| HGIN: High-grade intraepithelial neoplasias | ||
| LGIN: Low-grade intraepithelial neoplasias | ||
| Oral Cavity | 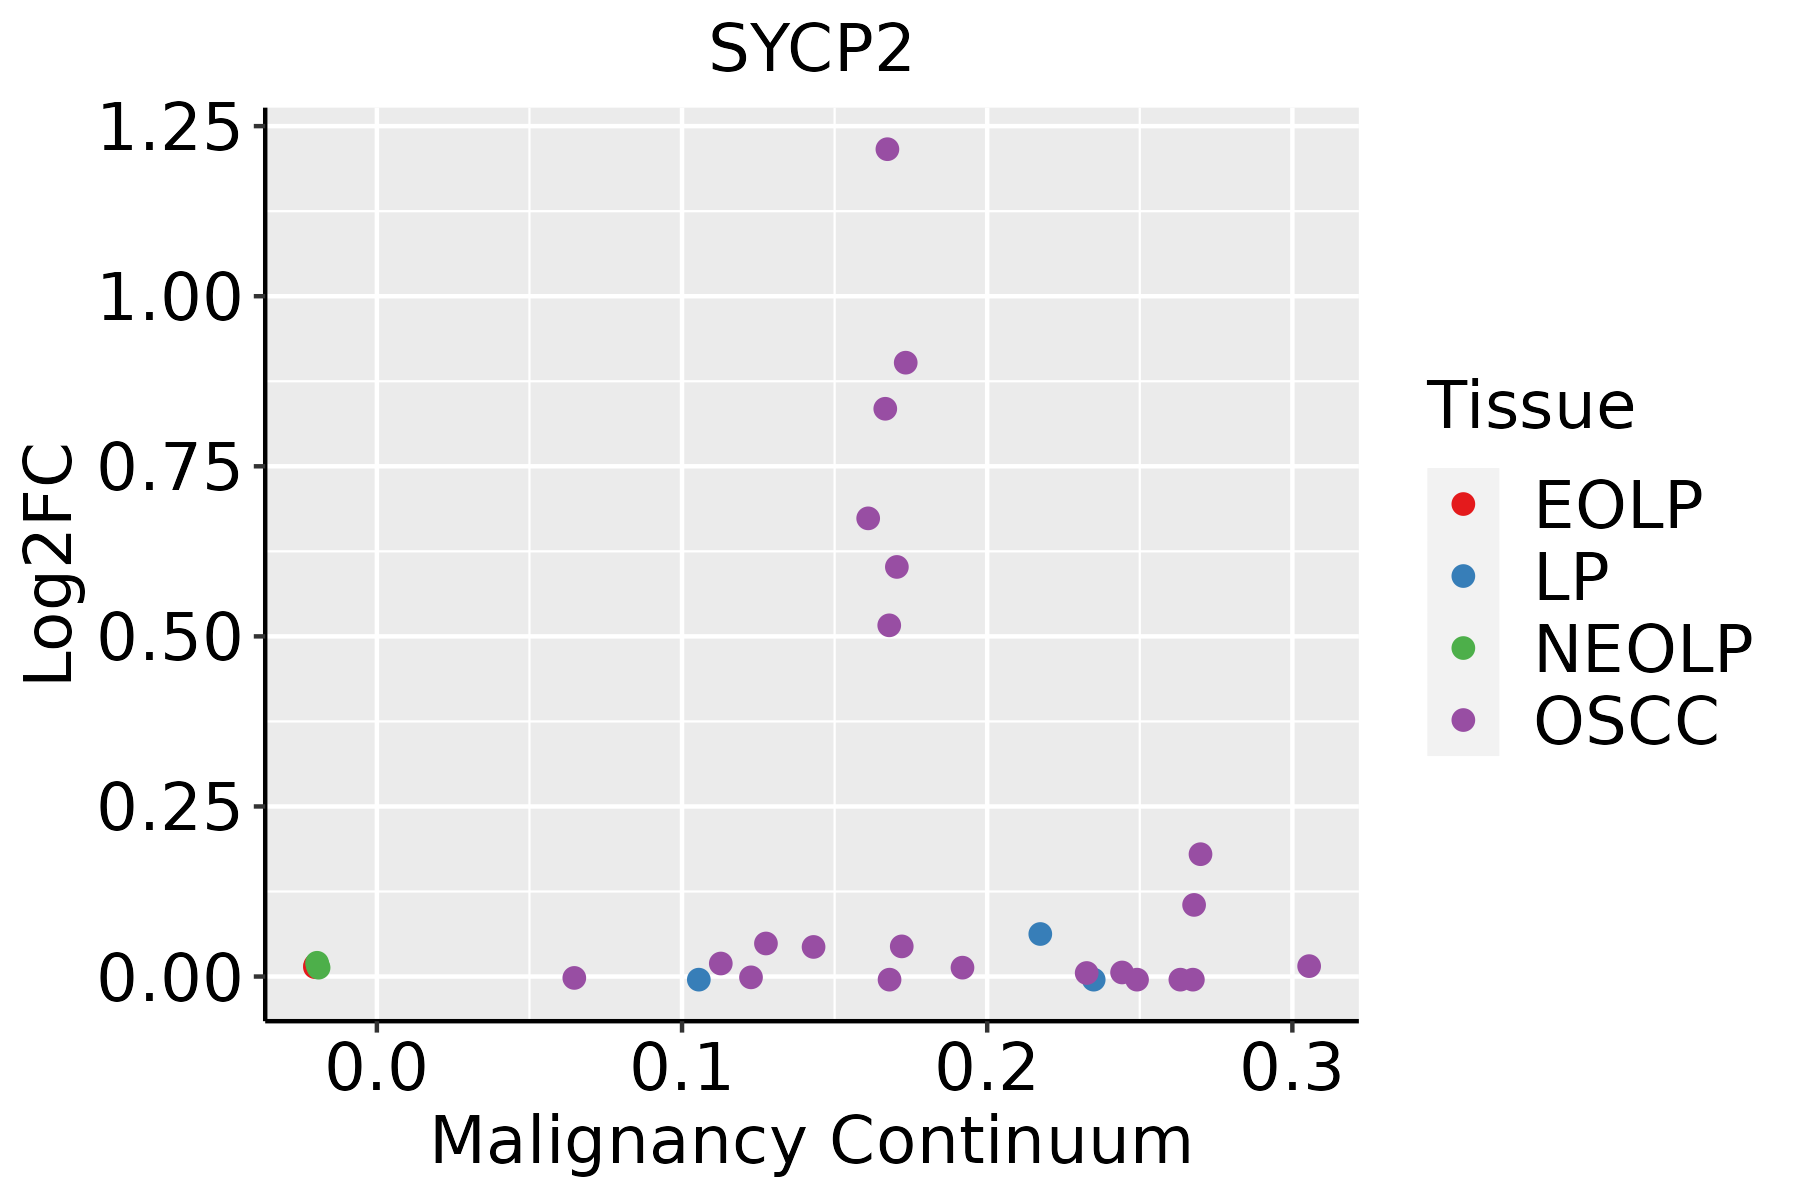 | EOLP: Erosive Oral lichen planus |
| LP: leukoplakia | ||
| NEOLP: Non-erosive oral lichen planus | ||
| OSCC: Oral squamous cell carcinoma |
| ∗log2FC in expression of this searched gene in stem-like cells from each diseased tissue sample relative to stem-like cells in normal samples in each tissue plotted against the malignancy continuum. Samples are colored based on if they are from different disease stage. |
Top |
Malignant transformation related pathway analysis |
| Find out the enriched GO biological processes and KEGG pathways involved in transition from healthy to precancer to cancer |
| Tissue | Disease Stage | Enriched GO biological Processes |
| Colorectum | AD |  |
| Colorectum | SER |  |
| Colorectum | MSS |  |
| Colorectum | MSI-H |  |
| Colorectum | FAP |  |
| ∗Top 15 enriched GO BP terms are showed in the bar plot of each disease state in each tissue. Each row represents a significant GO biological process which is colored according to the -log10(p.adjust). |
| Page: 1 2 3 4 5 6 7 8 9 |
| GO ID | Tissue | Disease Stage | Description | Gene Ratio | Bg Ratio | pvalue | p.adjust | Count |
| GO:00614588 | Cervix | CC | reproductive system development | 87/2311 | 427/18723 | 1.37e-06 | 4.55e-05 | 87 |
| GO:00486088 | Cervix | CC | reproductive structure development | 86/2311 | 424/18723 | 1.90e-06 | 5.97e-05 | 86 |
| GO:00482851 | Cervix | CC | organelle fission | 78/2311 | 488/18723 | 9.70e-03 | 4.79e-02 | 78 |
| GO:004860813 | Cervix | HSIL_HPV | reproductive structure development | 32/737 | 424/18723 | 3.52e-04 | 5.54e-03 | 32 |
| GO:006145814 | Cervix | HSIL_HPV | reproductive system development | 32/737 | 427/18723 | 3.98e-04 | 6.14e-03 | 32 |
| GO:000705911 | Esophagus | ESCC | chromosome segregation | 238/8552 | 346/18723 | 1.72e-18 | 1.82e-16 | 238 |
| GO:00482853 | Esophagus | ESCC | organelle fission | 301/8552 | 488/18723 | 4.64e-13 | 2.12e-11 | 301 |
| GO:00988133 | Esophagus | ESCC | nuclear chromosome segregation | 187/8552 | 281/18723 | 1.00e-12 | 4.36e-11 | 187 |
| GO:00002802 | Esophagus | ESCC | nuclear division | 270/8552 | 439/18723 | 1.17e-11 | 4.24e-10 | 270 |
| GO:0061458110 | Esophagus | ESCC | reproductive system development | 247/8552 | 427/18723 | 2.24e-07 | 3.42e-06 | 247 |
| GO:004860818 | Esophagus | ESCC | reproductive structure development | 245/8552 | 424/18723 | 2.82e-07 | 4.14e-06 | 245 |
| GO:00070592 | Oral cavity | OSCC | chromosome segregation | 206/7305 | 346/18723 | 5.82e-15 | 3.76e-13 | 206 |
| GO:00482852 | Oral cavity | OSCC | organelle fission | 265/7305 | 488/18723 | 3.22e-12 | 1.27e-10 | 265 |
| GO:00002801 | Oral cavity | OSCC | nuclear division | 237/7305 | 439/18723 | 9.62e-11 | 2.90e-09 | 237 |
| GO:00988132 | Oral cavity | OSCC | nuclear chromosome segregation | 162/7305 | 281/18723 | 1.56e-10 | 4.56e-09 | 162 |
| GO:006145817 | Oral cavity | OSCC | reproductive system development | 217/7305 | 427/18723 | 3.75e-07 | 5.63e-06 | 217 |
| GO:004860816 | Oral cavity | OSCC | reproductive structure development | 214/7305 | 424/18723 | 8.58e-07 | 1.18e-05 | 214 |
| Page: 1 |
| Pathway ID | Tissue | Disease Stage | Description | Gene Ratio | Bg Ratio | pvalue | p.adjust | qvalue | Count |
| Page: 1 |
Top |
Cell-cell communication analysis |
| Identification of potential cell-cell interactions between two cell types and their ligand-receptor pairs for different disease states |
| Ligand | Receptor | LRpair | Pathway | Tissue | Disease Stage |
| Page: 1 |
Top |
Single-cell gene regulatory network inference analysis |
| Find out the significant the regulons (TFs) and the target genes of each regulon across cell types for different disease states |
| TF | Cell Type | Tissue | Disease Stage | Target Gene | RSS | Regulon Activity |
| ∗The dot plots of a searched regulon are shown for all cell subpopulations in each disease state of each tissue based on the regulon specific score inferred using pySCENIC and by calculating the average expression. |
| Page: 1 |
Top |
Somatic mutation of malignant transformation related genes |
| Annotation of somatic variants for genes involved in malignant transformation |
| Hugo Symbol | Variant Class | Variant Classification | dbSNP RS | HGVSc | HGVSp | HGVSp Short | SWISSPROT | BIOTYPE | SIFT | PolyPhen | Tumor Sample Barcode | Tissue | Histology | Sex | Age | Stage | Therapy Types | Drugs | Outcome |
| SYCP2 | SNV | Missense_Mutation | rs369942080 | c.1904C>T | p.Ser635Leu | p.S635L | Q9BX26 | protein_coding | tolerated(0.25) | benign(0.029) | TCGA-A2-A0CT-01 | Breast | breast invasive carcinoma | Female | >=65 | I/II | Chemotherapy | cytoxan | SD |
| SYCP2 | SNV | Missense_Mutation | c.1922A>G | p.Asn641Ser | p.N641S | Q9BX26 | protein_coding | tolerated(0.26) | benign(0.018) | TCGA-A8-A090-01 | Breast | breast invasive carcinoma | Female | >=65 | I/II | Unknown | Unknown | SD | |
| SYCP2 | SNV | Missense_Mutation | c.907N>A | p.Glu303Lys | p.E303K | Q9BX26 | protein_coding | deleterious(0) | possibly_damaging(0.621) | TCGA-A8-A09A-01 | Breast | breast invasive carcinoma | Female | <65 | I/II | Hormone Therapy | tamoxiphen | SD | |
| SYCP2 | SNV | Missense_Mutation | c.4274T>G | p.Phe1425Cys | p.F1425C | Q9BX26 | protein_coding | deleterious(0) | probably_damaging(0.911) | TCGA-AC-A23H-01 | Breast | breast invasive carcinoma | Female | >=65 | I/II | Unknown | Unknown | PD | |
| SYCP2 | SNV | Missense_Mutation | novel | c.200C>T | p.Ser67Leu | p.S67L | Q9BX26 | protein_coding | deleterious(0) | probably_damaging(0.999) | TCGA-AC-A8OQ-01 | Breast | breast invasive carcinoma | Female | >=65 | I/II | Unknown | Unknown | SD |
| SYCP2 | SNV | Missense_Mutation | c.4242N>G | p.Phe1414Leu | p.F1414L | Q9BX26 | protein_coding | deleterious(0) | benign(0.027) | TCGA-AR-A0TX-01 | Breast | breast invasive carcinoma | Female | <65 | I/II | Unknown | Unknown | SD | |
| SYCP2 | SNV | Missense_Mutation | c.4276N>A | p.Glu1426Lys | p.E1426K | Q9BX26 | protein_coding | deleterious(0) | probably_damaging(0.919) | TCGA-D8-A27L-01 | Breast | breast invasive carcinoma | Female | <65 | III/IV | Chemotherapy | adriamycin+cuclophosphamide | SD | |
| SYCP2 | SNV | Missense_Mutation | c.3596N>C | p.Arg1199Thr | p.R1199T | Q9BX26 | protein_coding | tolerated(0.5) | benign(0.051) | TCGA-E2-A14V-01 | Breast | breast invasive carcinoma | Female | <65 | I/II | Chemotherapy | cyclophosphamide | SD | |
| SYCP2 | SNV | Missense_Mutation | rs184420704 | c.340N>G | p.Gln114Glu | p.Q114E | Q9BX26 | protein_coding | tolerated(0.06) | benign(0.121) | TCGA-E2-A159-01 | Breast | breast invasive carcinoma | Female | <65 | I/II | Chemotherapy | cyclophosphamide | SD |
| SYCP2 | SNV | Missense_Mutation | novel | c.928C>T | p.Leu310Phe | p.L310F | Q9BX26 | protein_coding | deleterious(0) | possibly_damaging(0.803) | TCGA-GM-A2D9-01 | Breast | breast invasive carcinoma | Female | >=65 | I/II | Hormone Therapy | arimidex | SD |
| Page: 1 2 3 4 5 6 7 8 9 10 11 12 13 14 15 16 17 18 19 20 21 22 23 24 25 26 27 28 29 30 31 |
Top |
Related drugs of malignant transformation related genes |
| Identification of chemicals and drugs interact with genes involved in malignant transfromation |
| (DGIdb 4.0) |
| Entrez ID | Symbol | Category | Interaction Types | Drug Claim Name | Drug Name | PMIDs |
| Page: 1 |

Copyright 2023-Present -The University of Texas Health Science Center at Houston |