
|
|||||
|
 | |
| |
| |
| |
| |
| |
|
Gene: SYBU |
Gene summary for SYBU |
| Gene information | Species | Human | Gene symbol | SYBU | Gene ID | 55638 |
| Gene name | syntabulin | |
| Gene Alias | GOLSYN | |
| Cytomap | 8q23.2 | |
| Gene Type | protein-coding | GO ID | GO:0001678 | UniProtAcc | Q9NX95 |
Top |
Malignant transformation analysis |
| Identification of the aberrant gene expression in precancerous and cancerous lesions by comparing the gene expression of stem-like cells in diseased tissues with normal stem cells |
| Entrez ID | Symbol | Replicates | Species | Organ | Tissue | Adj P-value | Log2FC | Malignancy |
| 55638 | SYBU | LZE24T | Human | Esophagus | ESCC | 1.73e-27 | 8.51e-01 | 0.0596 |
| 55638 | SYBU | P8T-E | Human | Esophagus | ESCC | 9.35e-18 | 2.06e-01 | 0.0889 |
| 55638 | SYBU | P10T-E | Human | Esophagus | ESCC | 2.02e-06 | 6.16e-02 | 0.116 |
| 55638 | SYBU | P12T-E | Human | Esophagus | ESCC | 1.33e-26 | 5.72e-01 | 0.1122 |
| 55638 | SYBU | P15T-E | Human | Esophagus | ESCC | 4.55e-04 | 6.01e-02 | 0.1149 |
| 55638 | SYBU | P20T-E | Human | Esophagus | ESCC | 6.09e-08 | 1.45e-01 | 0.1124 |
| 55638 | SYBU | P21T-E | Human | Esophagus | ESCC | 6.64e-13 | 2.57e-01 | 0.1617 |
| 55638 | SYBU | P23T-E | Human | Esophagus | ESCC | 4.46e-05 | 2.19e-01 | 0.108 |
| 55638 | SYBU | P26T-E | Human | Esophagus | ESCC | 9.56e-08 | 1.57e-01 | 0.1276 |
| 55638 | SYBU | P27T-E | Human | Esophagus | ESCC | 3.69e-28 | 5.50e-01 | 0.1055 |
| 55638 | SYBU | P31T-E | Human | Esophagus | ESCC | 3.75e-03 | 4.27e-02 | 0.1251 |
| 55638 | SYBU | P36T-E | Human | Esophagus | ESCC | 3.59e-04 | 2.42e-01 | 0.1187 |
| 55638 | SYBU | P39T-E | Human | Esophagus | ESCC | 8.08e-19 | 3.71e-01 | 0.0894 |
| 55638 | SYBU | P48T-E | Human | Esophagus | ESCC | 7.90e-03 | 3.10e-02 | 0.0959 |
| 55638 | SYBU | P54T-E | Human | Esophagus | ESCC | 1.41e-17 | 4.32e-01 | 0.0975 |
| 55638 | SYBU | P57T-E | Human | Esophagus | ESCC | 7.90e-12 | 2.33e-01 | 0.0926 |
| 55638 | SYBU | P61T-E | Human | Esophagus | ESCC | 9.44e-07 | 1.98e-01 | 0.099 |
| 55638 | SYBU | P65T-E | Human | Esophagus | ESCC | 7.58e-11 | 2.08e-01 | 0.0978 |
| 55638 | SYBU | P74T-E | Human | Esophagus | ESCC | 2.70e-09 | 3.58e-01 | 0.1479 |
| 55638 | SYBU | P75T-E | Human | Esophagus | ESCC | 3.60e-13 | 2.60e-01 | 0.1125 |
| Page: 1 2 |
| Tissue | Expression Dynamics | Abbreviation |
| Esophagus | 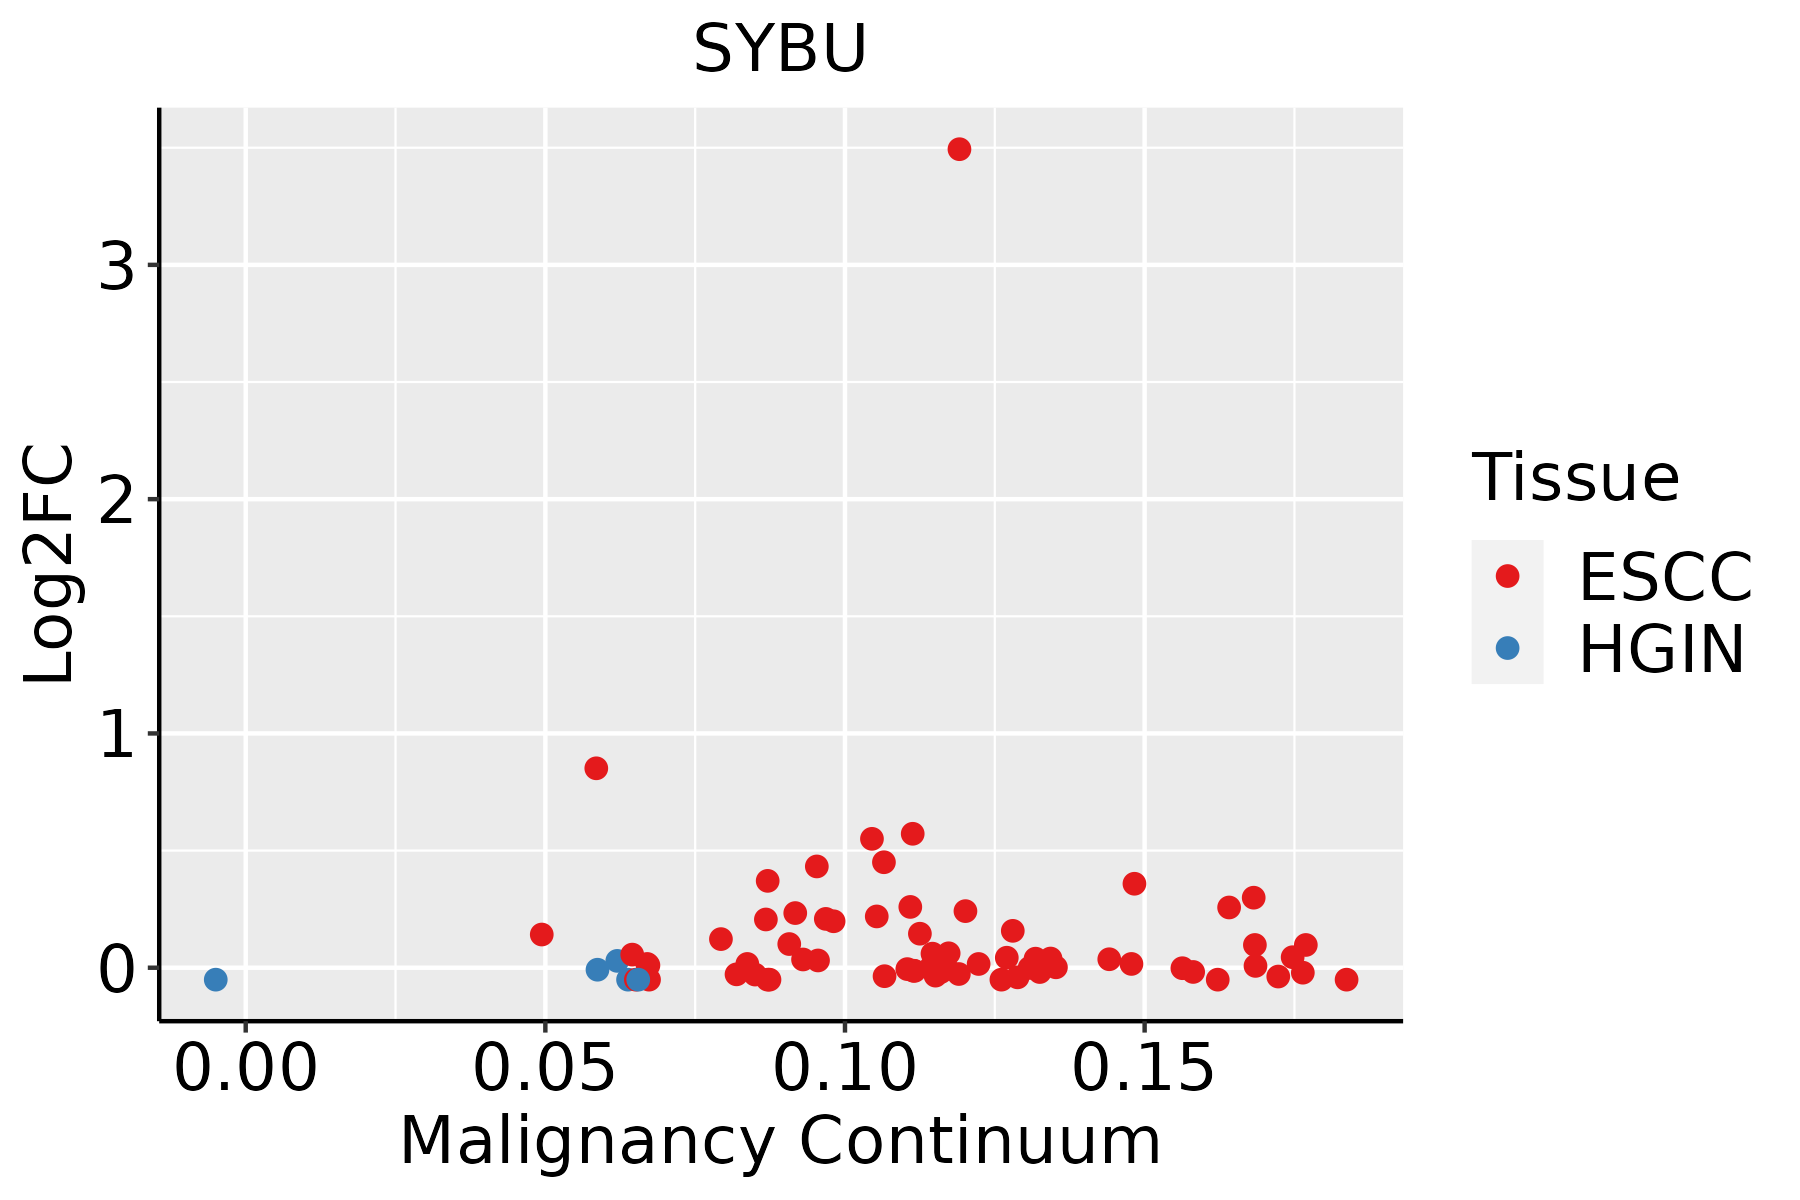 | ESCC: Esophageal squamous cell carcinoma |
| HGIN: High-grade intraepithelial neoplasias | ||
| LGIN: Low-grade intraepithelial neoplasias | ||
| Liver |  | HCC: Hepatocellular carcinoma |
| NAFLD: Non-alcoholic fatty liver disease |
| ∗log2FC in expression of this searched gene in stem-like cells from each diseased tissue sample relative to stem-like cells in normal samples in each tissue plotted against the malignancy continuum. Samples are colored based on if they are from different disease stage. |
Top |
Malignant transformation related pathway analysis |
| Find out the enriched GO biological processes and KEGG pathways involved in transition from healthy to precancer to cancer |
| Tissue | Disease Stage | Enriched GO biological Processes |
| Colorectum | AD |  |
| Colorectum | SER |  |
| Colorectum | MSS |  |
| Colorectum | MSI-H |  |
| Colorectum | FAP |  |
| ∗Top 15 enriched GO BP terms are showed in the bar plot of each disease state in each tissue. Each row represents a significant GO biological process which is colored according to the -log10(p.adjust). |
| Page: 1 2 3 4 5 6 7 8 9 |
| GO ID | Tissue | Disease Stage | Description | Gene Ratio | Bg Ratio | pvalue | p.adjust | Count |
| GO:005165617 | Esophagus | ESCC | establishment of organelle localization | 273/8552 | 390/18723 | 9.13e-23 | 1.81e-20 | 273 |
| GO:1904951111 | Esophagus | ESCC | positive regulation of establishment of protein localization | 216/8552 | 319/18723 | 1.01e-15 | 6.86e-14 | 216 |
| GO:0051222111 | Esophagus | ESCC | positive regulation of protein transport | 204/8552 | 303/18723 | 1.56e-14 | 8.38e-13 | 204 |
| GO:001648210 | Esophagus | ESCC | cytosolic transport | 124/8552 | 168/18723 | 9.69e-14 | 4.69e-12 | 124 |
| GO:005165016 | Esophagus | ESCC | establishment of vesicle localization | 114/8552 | 161/18723 | 8.20e-11 | 2.53e-09 | 114 |
| GO:003070518 | Esophagus | ESCC | cytoskeleton-dependent intracellular transport | 133/8552 | 195/18723 | 1.48e-10 | 4.27e-09 | 133 |
| GO:001097013 | Esophagus | ESCC | transport along microtubule | 107/8552 | 155/18723 | 3.17e-09 | 6.80e-08 | 107 |
| GO:005164815 | Esophagus | ESCC | vesicle localization | 119/8552 | 177/18723 | 5.16e-09 | 1.08e-07 | 119 |
| GO:00723846 | Esophagus | ESCC | organelle transport along microtubule | 65/8552 | 85/18723 | 6.61e-09 | 1.35e-07 | 65 |
| GO:000808810 | Esophagus | ESCC | axo-dendritic transport | 58/8552 | 75/18723 | 2.09e-08 | 4.02e-07 | 58 |
| GO:00989304 | Esophagus | ESCC | axonal transport | 49/8552 | 64/18723 | 4.54e-07 | 6.15e-06 | 49 |
| GO:00474962 | Esophagus | ESCC | vesicle transport along microtubule | 36/8552 | 47/18723 | 1.53e-05 | 1.38e-04 | 36 |
| GO:00991114 | Esophagus | ESCC | microtubule-based transport | 115/8552 | 190/18723 | 2.54e-05 | 2.15e-04 | 115 |
| GO:00080892 | Esophagus | ESCC | anterograde axonal transport | 37/8552 | 50/18723 | 4.42e-05 | 3.51e-04 | 37 |
| GO:005165411 | Esophagus | ESCC | establishment of mitochondrion localization | 24/8552 | 29/18723 | 4.50e-05 | 3.55e-04 | 24 |
| GO:00995185 | Esophagus | ESCC | vesicle cytoskeletal trafficking | 50/8552 | 73/18723 | 6.75e-05 | 5.12e-04 | 50 |
| GO:00346431 | Esophagus | ESCC | establishment of mitochondrion localization, microtubule-mediated | 21/8552 | 26/18723 | 2.69e-04 | 1.63e-03 | 21 |
| GO:00474971 | Esophagus | ESCC | mitochondrion transport along microtubule | 21/8552 | 26/18723 | 2.69e-04 | 1.63e-03 | 21 |
| GO:00516463 | Esophagus | ESCC | mitochondrion localization | 35/8552 | 50/18723 | 4.33e-04 | 2.44e-03 | 35 |
| GO:000930617 | Esophagus | ESCC | protein secretion | 190/8552 | 359/18723 | 3.22e-03 | 1.34e-02 | 190 |
| Page: 1 2 3 4 5 |
| Pathway ID | Tissue | Disease Stage | Description | Gene Ratio | Bg Ratio | pvalue | p.adjust | qvalue | Count |
| Page: 1 |
Top |
Cell-cell communication analysis |
| Identification of potential cell-cell interactions between two cell types and their ligand-receptor pairs for different disease states |
| Ligand | Receptor | LRpair | Pathway | Tissue | Disease Stage |
| Page: 1 |
Top |
Single-cell gene regulatory network inference analysis |
| Find out the significant the regulons (TFs) and the target genes of each regulon across cell types for different disease states |
| TF | Cell Type | Tissue | Disease Stage | Target Gene | RSS | Regulon Activity |
| ∗The dot plots of a searched regulon are shown for all cell subpopulations in each disease state of each tissue based on the regulon specific score inferred using pySCENIC and by calculating the average expression. |
| Page: 1 |
Top |
Somatic mutation of malignant transformation related genes |
| Annotation of somatic variants for genes involved in malignant transformation |
| Hugo Symbol | Variant Class | Variant Classification | dbSNP RS | HGVSc | HGVSp | HGVSp Short | SWISSPROT | BIOTYPE | SIFT | PolyPhen | Tumor Sample Barcode | Tissue | Histology | Sex | Age | Stage | Therapy Types | Drugs | Outcome |
| SYBU | SNV | Missense_Mutation | c.563N>G | p.Ser188Trp | p.S188W | Q9NX95 | protein_coding | tolerated(0.08) | probably_damaging(0.985) | TCGA-A2-A04T-01 | Breast | breast invasive carcinoma | Female | <65 | I/II | Chemotherapy | cyclophosphamide | SD | |
| SYBU | SNV | Missense_Mutation | c.1075T>G | p.Phe359Val | p.F359V | Q9NX95 | protein_coding | deleterious(0) | probably_damaging(0.997) | TCGA-A2-A0D3-01 | Breast | breast invasive carcinoma | Female | <65 | I/II | Chemotherapy | carboplatin | SD | |
| SYBU | SNV | Missense_Mutation | c.171N>A | p.Phe57Leu | p.F57L | Q9NX95 | protein_coding | tolerated(0.15) | possibly_damaging(0.84) | TCGA-A2-A0T3-01 | Breast | breast invasive carcinoma | Female | <65 | I/II | Chemotherapy | adriamycin | SD | |
| SYBU | SNV | Missense_Mutation | c.1928N>G | p.Leu643Arg | p.L643R | Q9NX95 | protein_coding | deleterious(0) | probably_damaging(0.976) | TCGA-A8-A08L-01 | Breast | breast invasive carcinoma | Female | >=65 | III/IV | Unknown | Unknown | SD | |
| SYBU | SNV | Missense_Mutation | c.1081G>A | p.Asp361Asn | p.D361N | Q9NX95 | protein_coding | deleterious(0) | probably_damaging(0.998) | TCGA-AC-A23C-01 | Breast | breast invasive carcinoma | Female | <65 | I/II | Chemotherapy | chemo | CR | |
| SYBU | SNV | Missense_Mutation | c.287C>T | p.Ala96Val | p.A96V | Q9NX95 | protein_coding | deleterious(0.01) | benign(0.254) | TCGA-AN-A0AK-01 | Breast | breast invasive carcinoma | Female | >=65 | I/II | Unknown | Unknown | SD | |
| SYBU | SNV | Missense_Mutation | c.1250N>G | p.Glu417Gly | p.E417G | Q9NX95 | protein_coding | tolerated(0.37) | possibly_damaging(0.74) | TCGA-AR-A0TV-01 | Breast | breast invasive carcinoma | Female | >=65 | I/II | Unknown | Unknown | SD | |
| SYBU | SNV | Missense_Mutation | c.1330N>A | p.Glu444Lys | p.E444K | Q9NX95 | protein_coding | tolerated(0.17) | benign(0.443) | TCGA-B6-A0WZ-01 | Breast | breast invasive carcinoma | Female | <65 | I/II | Unknown | Unknown | PD | |
| SYBU | SNV | Missense_Mutation | c.84N>C | p.Leu28Phe | p.L28F | Q9NX95 | protein_coding | deleterious(0.03) | probably_damaging(0.999) | TCGA-D8-A1J8-01 | Breast | breast invasive carcinoma | Female | >=65 | I/II | Hormone Therapy | nolvadex | SD | |
| SYBU | SNV | Missense_Mutation | c.1427N>A | p.Gly476Asp | p.G476D | Q9NX95 | protein_coding | tolerated(0.38) | benign(0) | TCGA-E2-A159-01 | Breast | breast invasive carcinoma | Female | <65 | I/II | Chemotherapy | cyclophosphamide | SD |
| Page: 1 2 3 4 5 6 7 8 9 |
Top |
Related drugs of malignant transformation related genes |
| Identification of chemicals and drugs interact with genes involved in malignant transfromation |
| (DGIdb 4.0) |
| Entrez ID | Symbol | Category | Interaction Types | Drug Claim Name | Drug Name | PMIDs |
| Page: 1 |

Copyright 2023-Present -The University of Texas Health Science Center at Houston |