Schematic overview of the cellular and molecular mechanisms involved in the cancer progression, including the proposed cellular and molecular mechanisms in cancer cells trajectory. AT1: alveolar type 1 cells; AT2: alveolar type 2 cells; AAH: atypical adenomatous hyperplasia; AIS: adenocarcinoma in situ; MIA: minimally invasive adenocarcinoma; IA: invasive adenocarcinoma; EMT: epithelial-mesenchymal transition

Home

Download

Statistics

Help

Contact

Center for Computational Systems Medicine
leaf

Gene summary

leaf

Malignant transformation analysis

leaf

Malignant transformation related pathway analysis

leaf

Cell-cell communication analysis

leaf

Single-cell gene regulatory network inference analysis

leaf

Somatic mutation of malignant transformation related genes

leaf

Related drugs of malignant transformation related genes

Gene: SWI5

Gene summary for SWI5

check button Gene summary.

Gene informationSpeciesHuman
Gene symbol

SWI5

Gene ID

375757

Gene nameSWI5 homologous recombination repair protein
Gene AliasC9orf119
Cytomap9q34.11
Gene Typeprotein-coding
GO ID

GO:0000724

UniProtAcc

Q1ZZU3


Top

Malignant transformation analysis

check button Identification of the aberrant gene expression in precancerous and cancerous lesions by comparing the gene expression of stem-like cells in diseased tissues with normal stem cells
check button Malignant transformation involving gene list.
Entrez IDSymbolReplicatesSpeciesOrganTissueAdj P-valueLog2FCMalignancy
375757SWI5LZE4THumanEsophagusESCC4.46e-164.42e-010.0811
375757SWI5LZE5THumanEsophagusESCC5.35e-053.25e-010.0514
375757SWI5LZE7THumanEsophagusESCC3.29e-147.46e-010.0667
375757SWI5LZE8THumanEsophagusESCC3.24e-062.73e-010.067
375757SWI5LZE20THumanEsophagusESCC1.37e-115.78e-010.0662
375757SWI5LZE22D1HumanEsophagusHGIN7.56e-031.91e-010.0595
375757SWI5LZE24THumanEsophagusESCC7.01e-266.68e-010.0596
375757SWI5LZE21THumanEsophagusESCC6.02e-116.95e-010.0655
375757SWI5LZE6THumanEsophagusESCC5.35e-158.22e-010.0845
375757SWI5P1T-EHumanEsophagusESCC1.74e-106.06e-010.0875
375757SWI5P2T-EHumanEsophagusESCC1.93e-448.41e-010.1177
375757SWI5P4T-EHumanEsophagusESCC1.10e-521.15e+000.1323
375757SWI5P5T-EHumanEsophagusESCC6.92e-233.55e-010.1327
375757SWI5P8T-EHumanEsophagusESCC1.62e-315.70e-010.0889
375757SWI5P9T-EHumanEsophagusESCC1.91e-265.67e-010.1131
375757SWI5P10T-EHumanEsophagusESCC8.44e-436.85e-010.116
375757SWI5P11T-EHumanEsophagusESCC4.81e-257.72e-010.1426
375757SWI5P12T-EHumanEsophagusESCC5.98e-335.98e-010.1122
375757SWI5P15T-EHumanEsophagusESCC2.18e-214.62e-010.1149
375757SWI5P16T-EHumanEsophagusESCC6.52e-345.38e-010.1153
Page: 1 2 3 4 5 6 

check button Transcriptomic changes along malignancy continuum.
TissueExpression DynamicsAbbreviation
EsophagusThe image shows the transcriptomic changes along malignancy continuum.log2FC in expression of this searched gene in stem-like cells from each diseased tissue sample relative to stem-like cells in normal samples in each tissue plotted against the malignancy continuum. Samples are colored based on if they are from different disease stage.ESCC: Esophageal squamous cell carcinoma
HGIN: High-grade intraepithelial neoplasias
LGIN: Low-grade intraepithelial neoplasias
LiverThe image shows the transcriptomic changes along malignancy continuum.log2FC in expression of this searched gene in stem-like cells from each diseased tissue sample relative to stem-like cells in normal samples in each tissue plotted against the malignancy continuum. Samples are colored based on if they are from different disease stage.HCC: Hepatocellular carcinoma
NAFLD: Non-alcoholic fatty liver disease
Oral CavityThe image shows the transcriptomic changes along malignancy continuum.log2FC in expression of this searched gene in stem-like cells from each diseased tissue sample relative to stem-like cells in normal samples in each tissue plotted against the malignancy continuum. Samples are colored based on if they are from different disease stage.EOLP: Erosive Oral lichen planus
LP: leukoplakia
NEOLP: Non-erosive oral lichen planus
OSCC: Oral squamous cell carcinoma
ProstateThe image shows the transcriptomic changes along malignancy continuum.log2FC in expression of this searched gene in stem-like cells from each diseased tissue sample relative to stem-like cells in normal samples in each tissue plotted against the malignancy continuum. Samples are colored based on if they are from different disease stage.
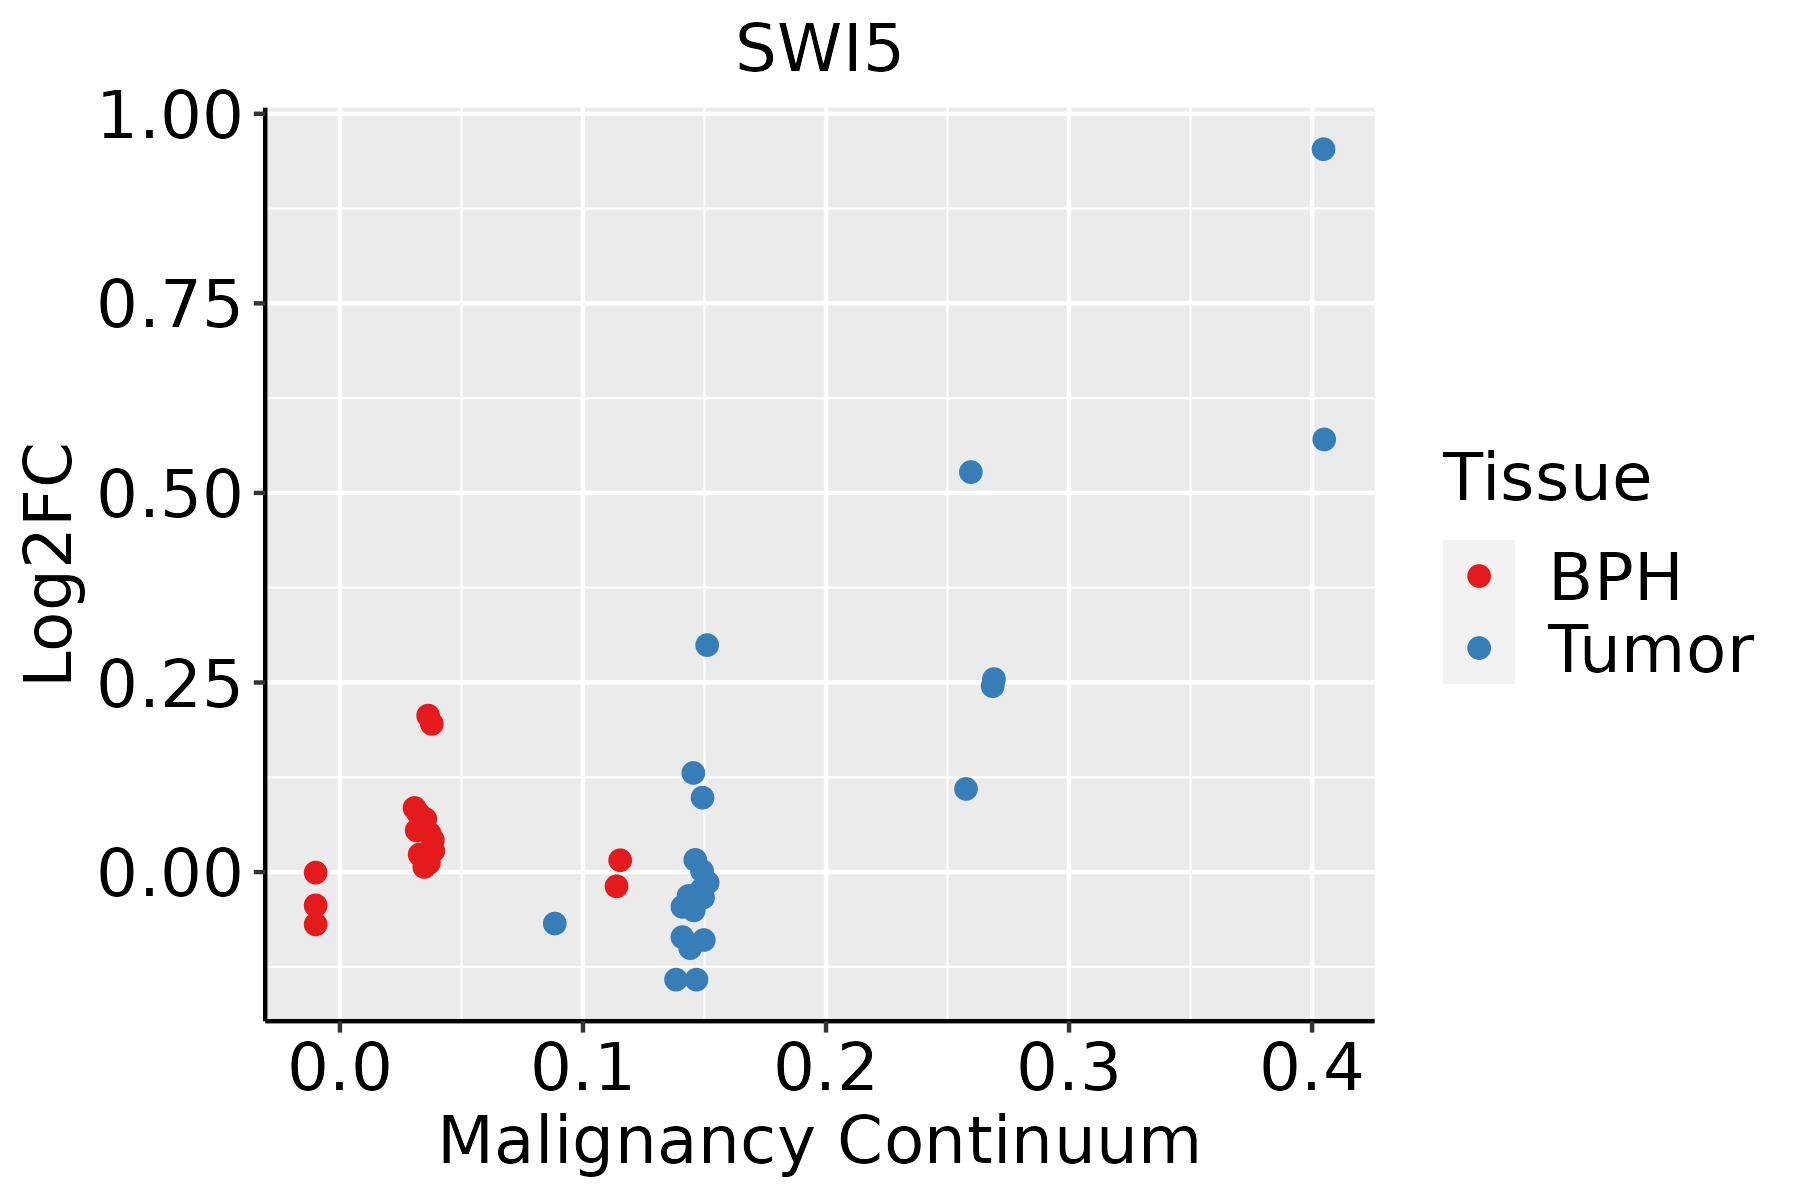
BPH: Benign Prostatic Hyperplasia
SkinThe image shows the transcriptomic changes along malignancy continuum.log2FC in expression of this searched gene in stem-like cells from each diseased tissue sample relative to stem-like cells in normal samples in each tissue plotted against the malignancy continuum. Samples are colored based on if they are from different disease stage.
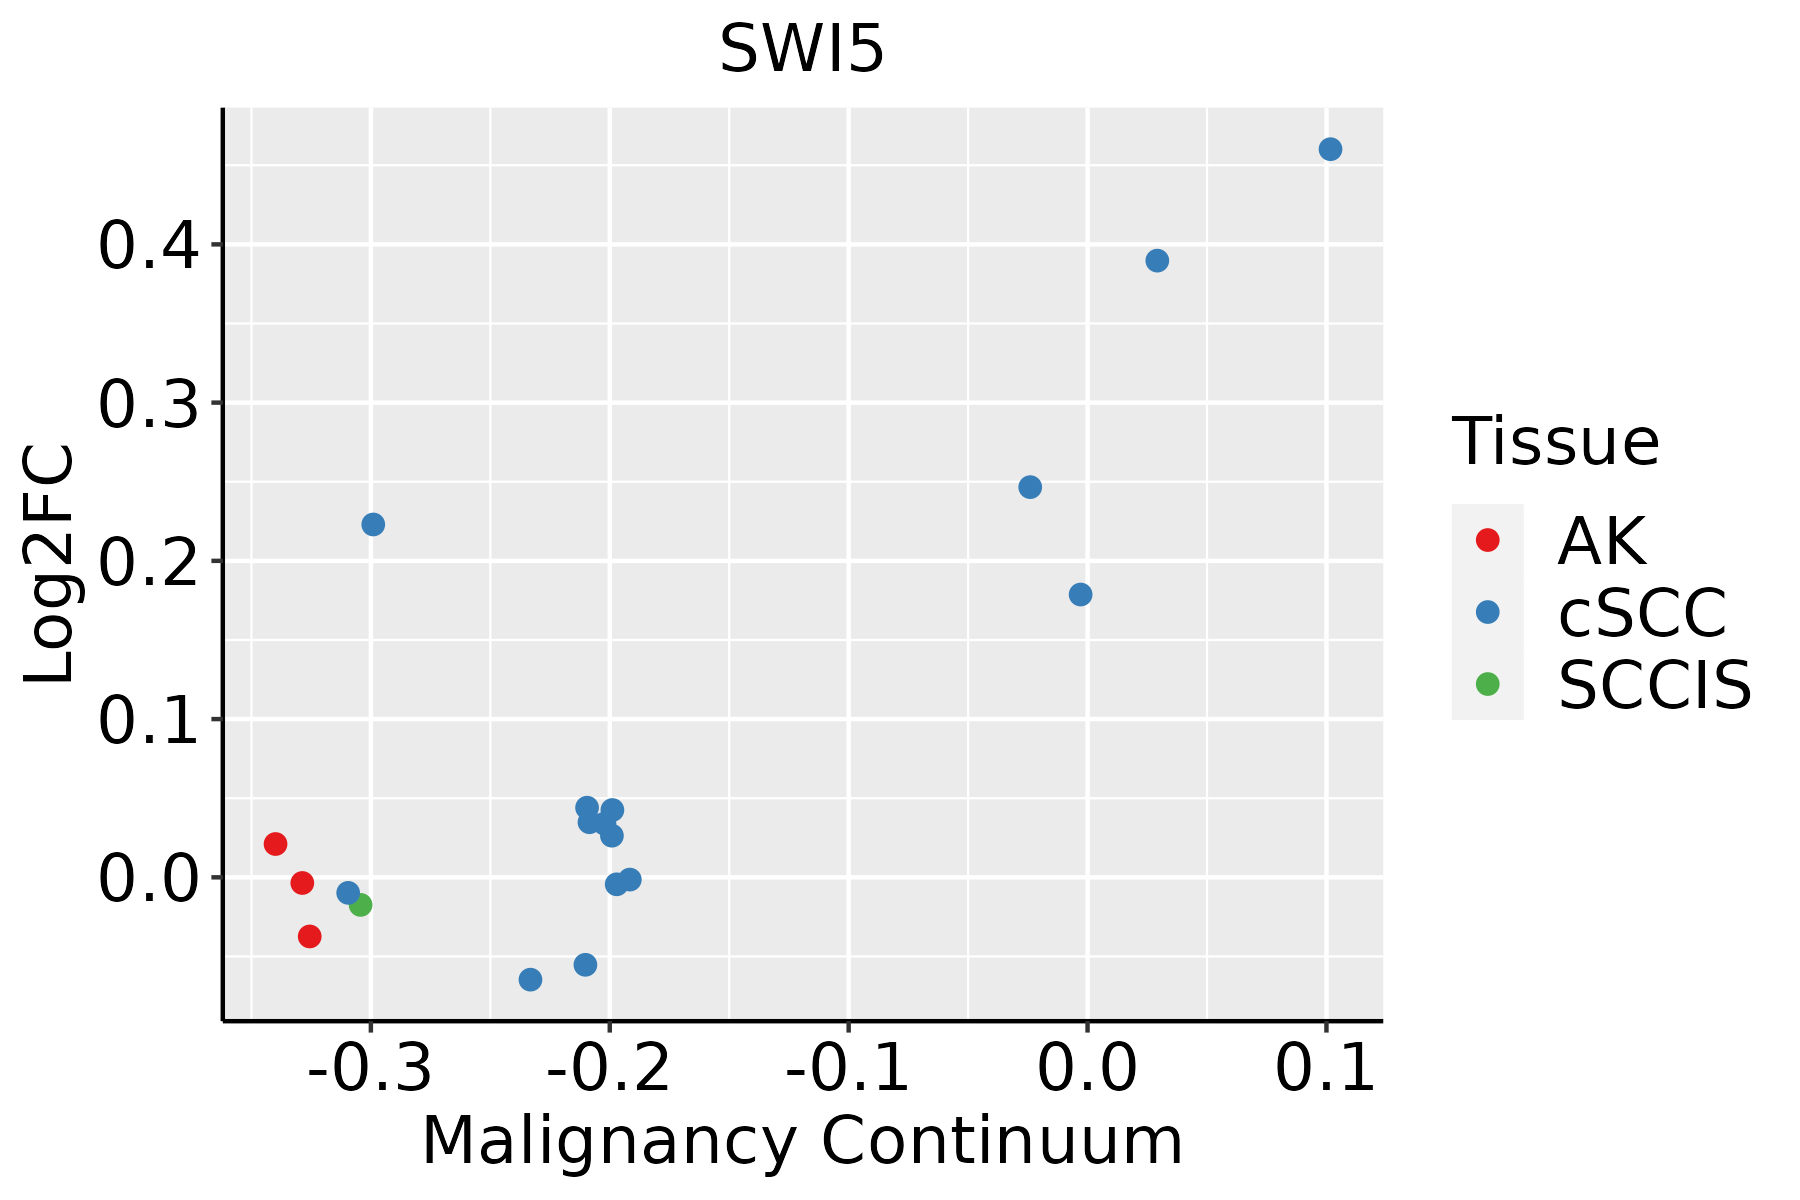
AK: Actinic keratosis
cSCC: Cutaneous squamous cell carcinoma
SCCIS:squamous cell carcinoma in situ
ThyroidThe image shows the transcriptomic changes along malignancy continuum.log2FC in expression of this searched gene in stem-like cells from each diseased tissue sample relative to stem-like cells in normal samples in each tissue plotted against the malignancy continuum. Samples are colored based on if they are from different disease stage.ATC: Anaplastic thyroid cancer
HT: Hashimoto's thyroiditis
PTC: Papillary thyroid cancer
∗log2FC in expression of this searched gene in stem-like cells from each diseased tissue sample relative to stem-like cells in normal samples in each tissue plotted against the malignancy continuum. Samples are colored based on if they are from different disease stage.

Top

Malignant transformation related pathway analysis

check buttonFind out the enriched GO biological processes and KEGG pathways involved in transition from healthy to precancer to cancer
check button Figure of enriched GO biological processes.
TissueDisease StageEnriched GO biological Processes
ColorectumADGO analysis - Figure of enriched GO biological processes: Top 15 enriched GO BP terms are showed in the bar plot of each disease state in each tissue. Each row represents a significant GO biological process which is colored according to the -log10(p.adjust).
ColorectumSERGO analysis - Figure of enriched GO biological processes: Top 15 enriched GO BP terms are showed in the bar plot of each disease state in each tissue. Each row represents a significant GO biological process which is colored according to the -log10(p.adjust).
ColorectumMSSGO analysis - Figure of enriched GO biological processes: Top 15 enriched GO BP terms are showed in the bar plot of each disease state in each tissue. Each row represents a significant GO biological process which is colored according to the -log10(p.adjust).
ColorectumMSI-HGO analysis - Figure of enriched GO biological processes: Top 15 enriched GO BP terms are showed in the bar plot of each disease state in each tissue. Each row represents a significant GO biological process which is colored according to the -log10(p.adjust).
ColorectumFAPGO analysis - Figure of enriched GO biological processes: Top 15 enriched GO BP terms are showed in the bar plot of each disease state in each tissue. Each row represents a significant GO biological process which is colored according to the -log10(p.adjust).
∗Top 15 enriched GO BP terms are showed in the bar plot of each disease state in each tissue. Each row represents a significant GO biological process which is colored according to the -log10(p.adjust).
Page: 1 2 3 4 5 6 7 8 9 

check button Enriched GO biological processes.
GO IDTissueDisease StageDescriptionGene RatioBg Ratiopvaluep.adjustCount
GO:007147919EsophagusHGINcellular response to ionizing radiation21/258772/187235.31e-047.59e-0321
GO:000931418EsophagusHGINresponse to radiation88/2587456/187236.26e-048.65e-0388
GO:00714789EsophagusHGINcellular response to radiation42/2587186/187237.66e-041.00e-0242
GO:007121418EsophagusHGINcellular response to abiotic stimulus66/2587331/187231.21e-031.45e-0266
GO:010400418EsophagusHGINcellular response to environmental stimulus66/2587331/187231.21e-031.45e-0266
GO:00102129EsophagusHGINresponse to ionizing radiation33/2587148/187233.28e-033.10e-0233
GO:001021217EsophagusESCCresponse to ionizing radiation110/8552148/187231.11e-124.78e-11110
GO:000931419EsophagusESCCresponse to radiation277/8552456/187234.42e-111.43e-09277
GO:007121419EsophagusESCCcellular response to abiotic stimulus206/8552331/187237.52e-101.88e-08206
GO:010400419EsophagusESCCcellular response to environmental stimulus206/8552331/187237.52e-101.88e-08206
GO:007147816EsophagusESCCcellular response to radiation122/8552186/187233.07e-085.73e-07122
GO:0071479110EsophagusESCCcellular response to ionizing radiation54/855272/187233.85e-075.32e-0654
GO:00063024EsophagusESCCdouble-strand break repair152/8552251/187231.33e-061.62e-05152
GO:00063101EsophagusESCCDNA recombination168/8552305/187235.58e-043.05e-03168
GO:00007241EsophagusESCCdouble-strand break repair via homologous recombination79/8552138/187234.05e-031.62e-0279
GO:00007251EsophagusESCCrecombinational repair80/8552140/187234.10e-031.63e-0280
GO:007121411LiverCirrhoticcellular response to abiotic stimulus115/4634331/187232.62e-053.38e-04115
GO:010400411LiverCirrhoticcellular response to environmental stimulus115/4634331/187232.62e-053.38e-04115
GO:007147911LiverCirrhoticcellular response to ionizing radiation34/463472/187232.86e-053.64e-0434
GO:007147811LiverCirrhoticcellular response to radiation68/4634186/187232.11e-041.94e-0368
Page: 1 2 3 4 5 

check button Enriched KEGG pathways.
Pathway IDTissueDisease StageDescriptionGene RatioBg Ratiopvaluep.adjustqvalueCount
Page: 1 

Top

Cell-cell communication analysis

check buttonIdentification of potential cell-cell interactions between two cell types and their ligand-receptor pairs for different disease states
LigandReceptorLRpairPathwayTissueDisease Stage
Page: 1 

Top

Single-cell gene regulatory network inference analysis

check buttonFind out the significant the regulons (TFs) and the target genes of each regulon across cell types for different disease states
TFCell TypeTissueDisease StageTarget GeneRSSRegulon Activity
∗The dot plots of a searched regulon are shown for all cell subpopulations in each disease state of each tissue based on the regulon specific score inferred using pySCENIC and by calculating the average expression.
Page: 1 

Top

Somatic mutation of malignant transformation related genes

check buttonAnnotation of somatic variants for genes involved in malignant transformation
Hugo SymbolVariant ClassVariant ClassificationdbSNP RSHGVScHGVSpHGVSp ShortSWISSPROTBIOTYPESIFTPolyPhenTumor Sample BarcodeTissueHistologySexAgeStageTherapy TypesDrugsOutcome
SWI5SNVMissense_Mutationnovelc.149N>Cp.Arg50Thrp.R50TQ1ZZU3protein_codingtolerated_low_confidence(0.28)benign(0.01)TCGA-5L-AAT1-01Breastbreast invasive carcinomaFemale<65III/IVHormone TherapyletrozolSD
SWI5SNVMissense_Mutationc.100N>Tp.Pro34Serp.P34SQ1ZZU3protein_codingtolerated_low_confidence(0.54)benign(0.021)TCGA-D8-A27V-01Breastbreast invasive carcinomaFemale<65I/IIHormone TherapytamoxiphenSD
SWI5SNVMissense_Mutationc.158N>Ap.Gly53Aspp.G53DQ1ZZU3protein_codingtolerated_low_confidence(0.65)benign(0)TCGA-E9-A22E-01Breastbreast invasive carcinomaFemale<65III/IVChemotherapycyclophosphaneSD
SWI5deletionFrame_Shift_Delc.28_47delTGGCGTCACAACAAAAGCTGp.Trp10ArgfsTer110p.W10Rfs*110Q1ZZU3protein_codingTCGA-AN-A0AR-01Breastbreast invasive carcinomaFemale<65I/IIUnknownUnknownSD
SWI5SNVMissense_Mutationrs758005489c.28N>Cp.Trp10Argp.W10RQ1ZZU3protein_codingdeleterious_low_confidence(0)benign(0.001)TCGA-JX-A3Q0-01Cervixcervical & endocervical cancerFemale<65III/IVUnknownUnknownSD
SWI5SNVMissense_Mutationc.83N>Tp.Arg28Metp.R28MQ1ZZU3protein_codingdeleterious_low_confidence(0.04)benign(0.043)TCGA-AD-6888-01Colorectumcolon adenocarcinomaMale>=65III/IVUnknownUnknownPD
SWI5SNVMissense_Mutationc.137N>Tp.Thr46Ilep.T46IQ1ZZU3protein_codingtolerated_low_confidence(0.12)benign(0)TCGA-AZ-6599-01Colorectumcolon adenocarcinomaMale>=65I/IIUnknownUnknownSD
SWI5SNVMissense_Mutationc.154C>Tp.Pro52Serp.P52SQ1ZZU3protein_codingtolerated_low_confidence(0.28)benign(0.003)TCGA-CM-4743-01Colorectumcolon adenocarcinomaMale>=65I/IIChemotherapycapecitabineSD
SWI5SNVMissense_Mutationnovelc.452N>Tp.Ala151Valp.A151VQ1ZZU3protein_codingtolerated(0.07)possibly_damaging(0.71)TCGA-A5-A0G1-01Endometriumuterine corpus endometrioid carcinomaFemale>=65I/IIUnknownUnknownSD
SWI5SNVMissense_Mutationnovelc.624N>Tp.Gln208Hisp.Q208HQ1ZZU3protein_codingdeleterious(0)probably_damaging(0.999)TCGA-A5-A0G2-01Endometriumuterine corpus endometrioid carcinomaFemale<65III/IVUnknownUnknownSD
Page: 1 2 3 

Top

Related drugs of malignant transformation related genes

check buttonIdentification of chemicals and drugs interact with genes involved in malignant transfromation
(DGIdb 4.0)
Entrez IDSymbolCategoryInteraction TypesDrug Claim NameDrug NamePMIDs
Page: 1