Schematic overview of the cellular and molecular mechanisms involved in the cancer progression, including the proposed cellular and molecular mechanisms in cancer cells trajectory. AT1: alveolar type 1 cells; AT2: alveolar type 2 cells; AAH: atypical adenomatous hyperplasia; AIS: adenocarcinoma in situ; MIA: minimally invasive adenocarcinoma; IA: invasive adenocarcinoma; EMT: epithelial-mesenchymal transition

Home

Download

Statistics

Help

Contact

Center for Computational Systems Medicine
leaf

Gene summary

leaf

Malignant transformation analysis

leaf

Malignant transformation related pathway analysis

leaf

Cell-cell communication analysis

leaf

Single-cell gene regulatory network inference analysis

leaf

Somatic mutation of malignant transformation related genes

leaf

Related drugs of malignant transformation related genes

Gene: SWAP70

Gene summary for SWAP70

check button Gene summary.

Gene informationSpeciesHuman
Gene symbol

SWAP70

Gene ID

23075

Gene nameswitching B cell complex subunit SWAP70
Gene AliasHSPC321
Cytomap11p15.4
Gene Typeprotein-coding
GO ID

GO:0001775

UniProtAcc

B3KUB9


Top

Malignant transformation analysis

check button Identification of the aberrant gene expression in precancerous and cancerous lesions by comparing the gene expression of stem-like cells in diseased tissues with normal stem cells
check button Malignant transformation involving gene list.
Entrez IDSymbolReplicatesSpeciesOrganTissueAdj P-valueLog2FCMalignancy
23075SWAP70LZE4THumanEsophagusESCC1.30e-082.96e-010.0811
23075SWAP70LZE5THumanEsophagusESCC4.41e-022.54e-010.0514
23075SWAP70LZE8THumanEsophagusESCC2.85e-052.63e-010.067
23075SWAP70LZE20THumanEsophagusESCC2.57e-041.41e-010.0662
23075SWAP70LZE22THumanEsophagusESCC6.46e-043.29e-010.068
23075SWAP70LZE24THumanEsophagusESCC6.62e-204.52e-010.0596
23075SWAP70P1T-EHumanEsophagusESCC9.01e-074.38e-010.0875
23075SWAP70P2T-EHumanEsophagusESCC5.64e-265.06e-010.1177
23075SWAP70P4T-EHumanEsophagusESCC8.86e-142.20e-010.1323
23075SWAP70P5T-EHumanEsophagusESCC4.16e-131.76e-010.1327
23075SWAP70P8T-EHumanEsophagusESCC3.91e-101.79e-010.0889
23075SWAP70P9T-EHumanEsophagusESCC4.11e-083.60e-010.1131
23075SWAP70P10T-EHumanEsophagusESCC3.68e-296.87e-010.116
23075SWAP70P11T-EHumanEsophagusESCC5.42e-076.26e-010.1426
23075SWAP70P12T-EHumanEsophagusESCC4.56e-041.89e-010.1122
23075SWAP70P15T-EHumanEsophagusESCC2.27e-245.72e-010.1149
23075SWAP70P16T-EHumanEsophagusESCC3.42e-142.94e-010.1153
23075SWAP70P17T-EHumanEsophagusESCC4.79e-084.60e-010.1278
23075SWAP70P20T-EHumanEsophagusESCC1.75e-184.47e-010.1124
23075SWAP70P21T-EHumanEsophagusESCC1.49e-123.99e-010.1617
Page: 1 2 3 4 5 6 

check button Transcriptomic changes along malignancy continuum.
TissueExpression DynamicsAbbreviation
EsophagusThe image shows the transcriptomic changes along malignancy continuum.log2FC in expression of this searched gene in stem-like cells from each diseased tissue sample relative to stem-like cells in normal samples in each tissue plotted against the malignancy continuum. Samples are colored based on if they are from different disease stage.
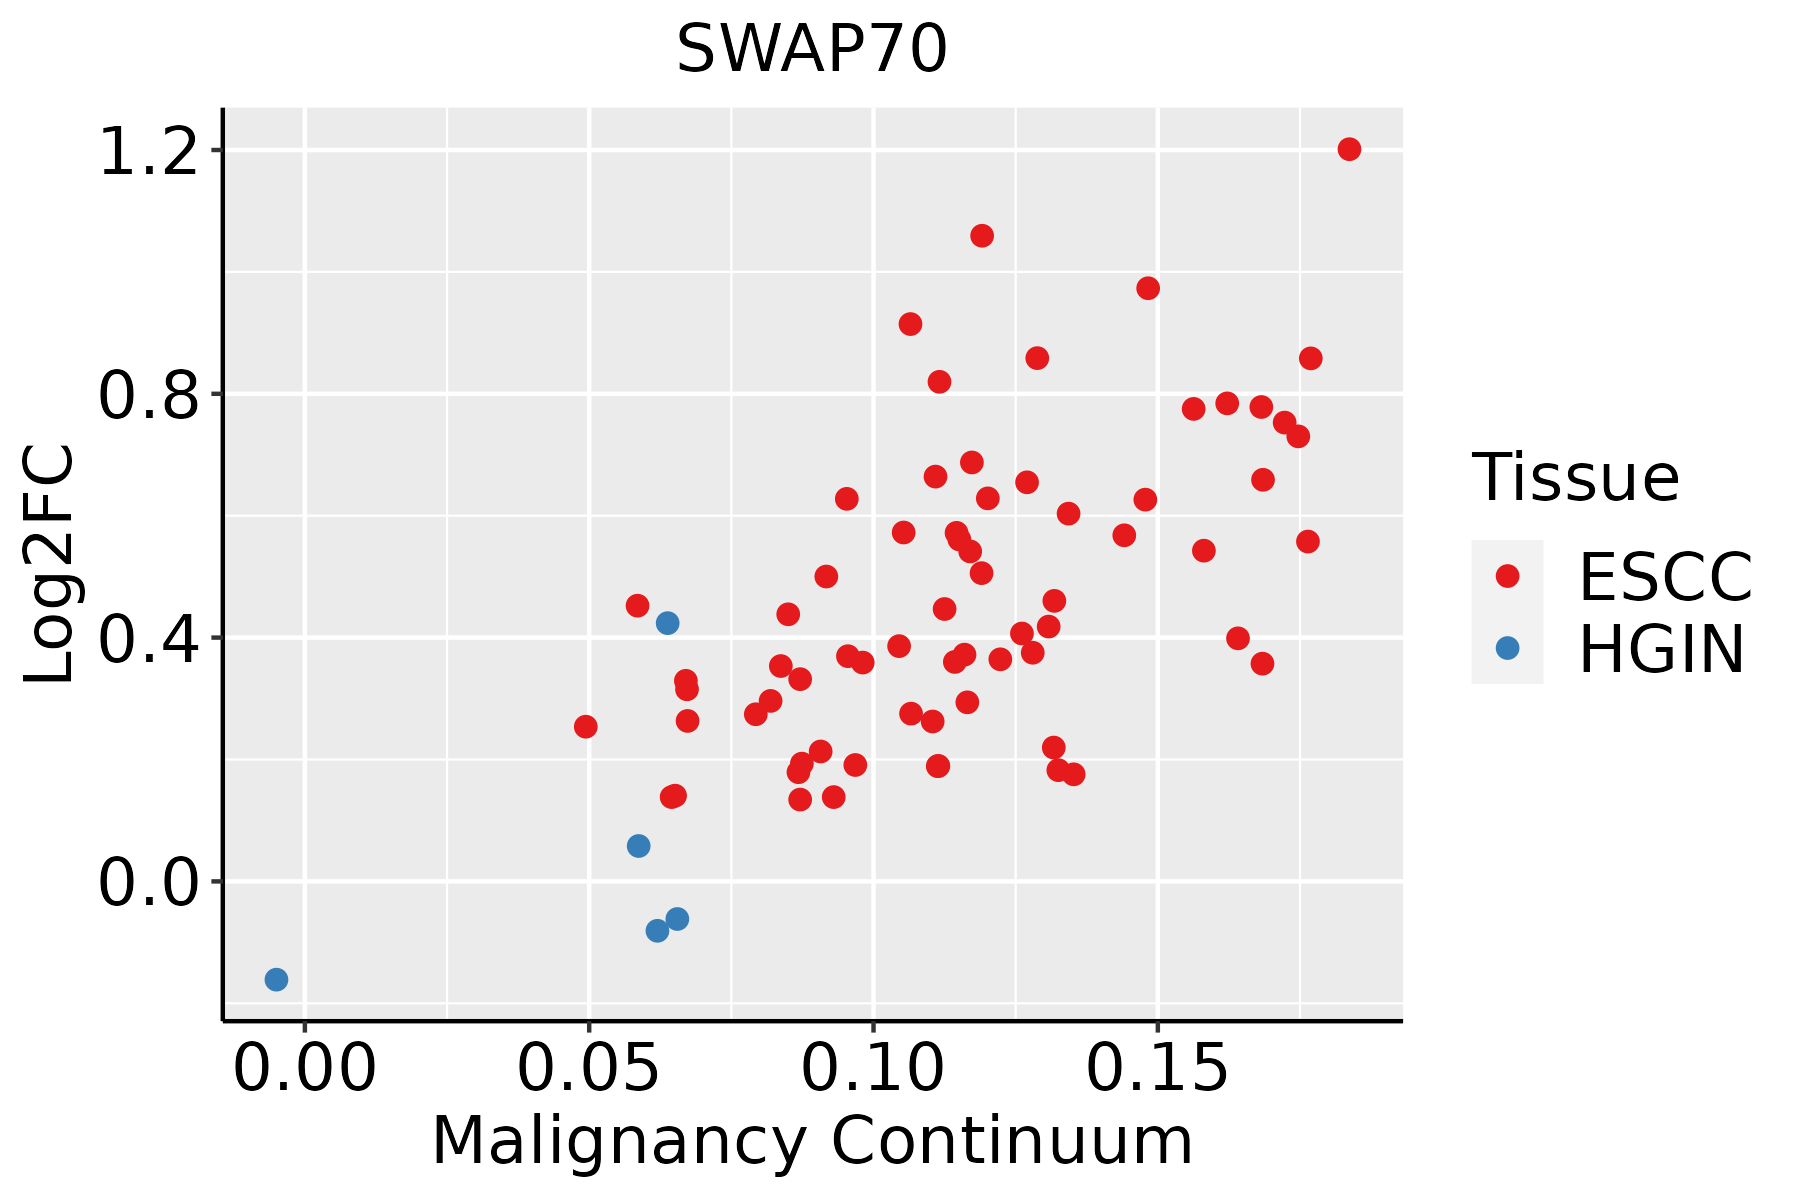
ESCC: Esophageal squamous cell carcinoma
HGIN: High-grade intraepithelial neoplasias
LGIN: Low-grade intraepithelial neoplasias
LiverThe image shows the transcriptomic changes along malignancy continuum.log2FC in expression of this searched gene in stem-like cells from each diseased tissue sample relative to stem-like cells in normal samples in each tissue plotted against the malignancy continuum. Samples are colored based on if they are from different disease stage.
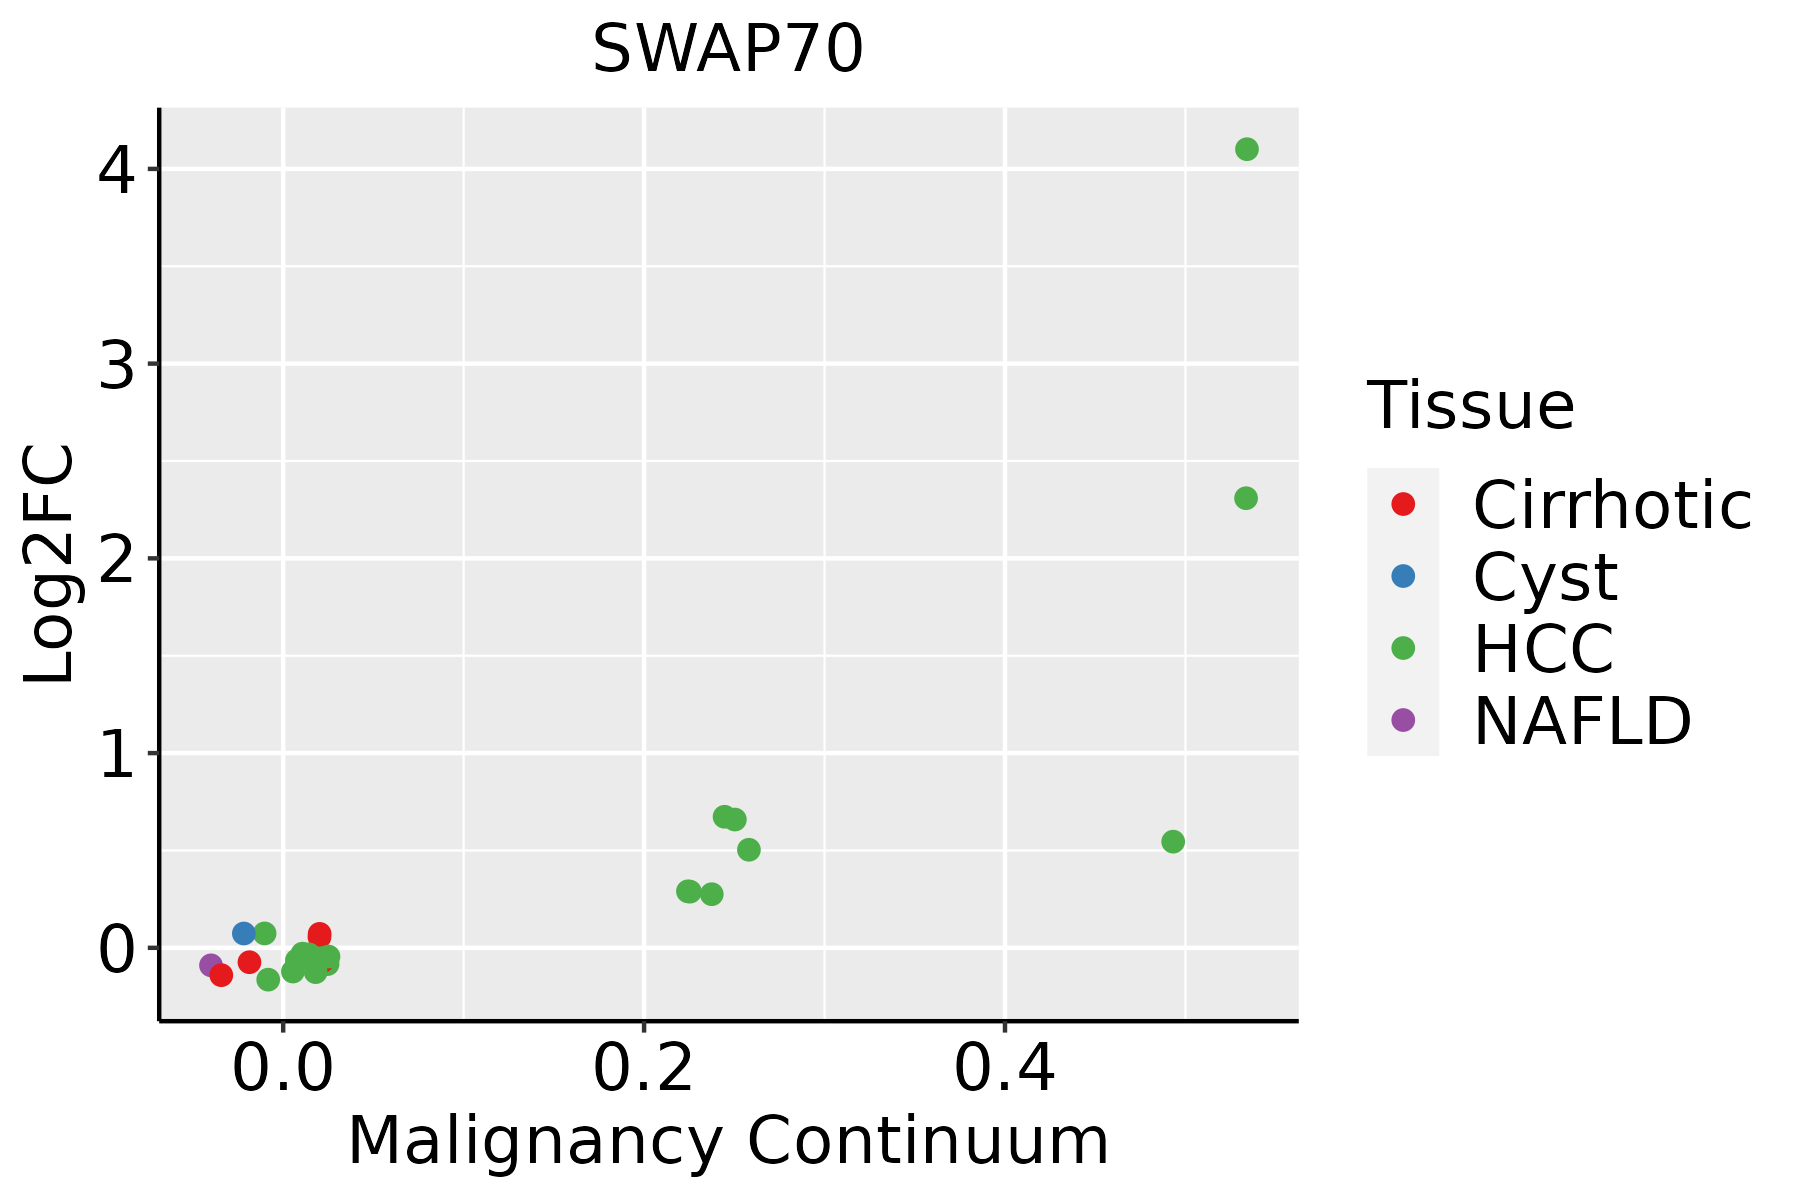
HCC: Hepatocellular carcinoma
NAFLD: Non-alcoholic fatty liver disease
LungThe image shows the transcriptomic changes along malignancy continuum.log2FC in expression of this searched gene in stem-like cells from each diseased tissue sample relative to stem-like cells in normal samples in each tissue plotted against the malignancy continuum. Samples are colored based on if they are from different disease stage.
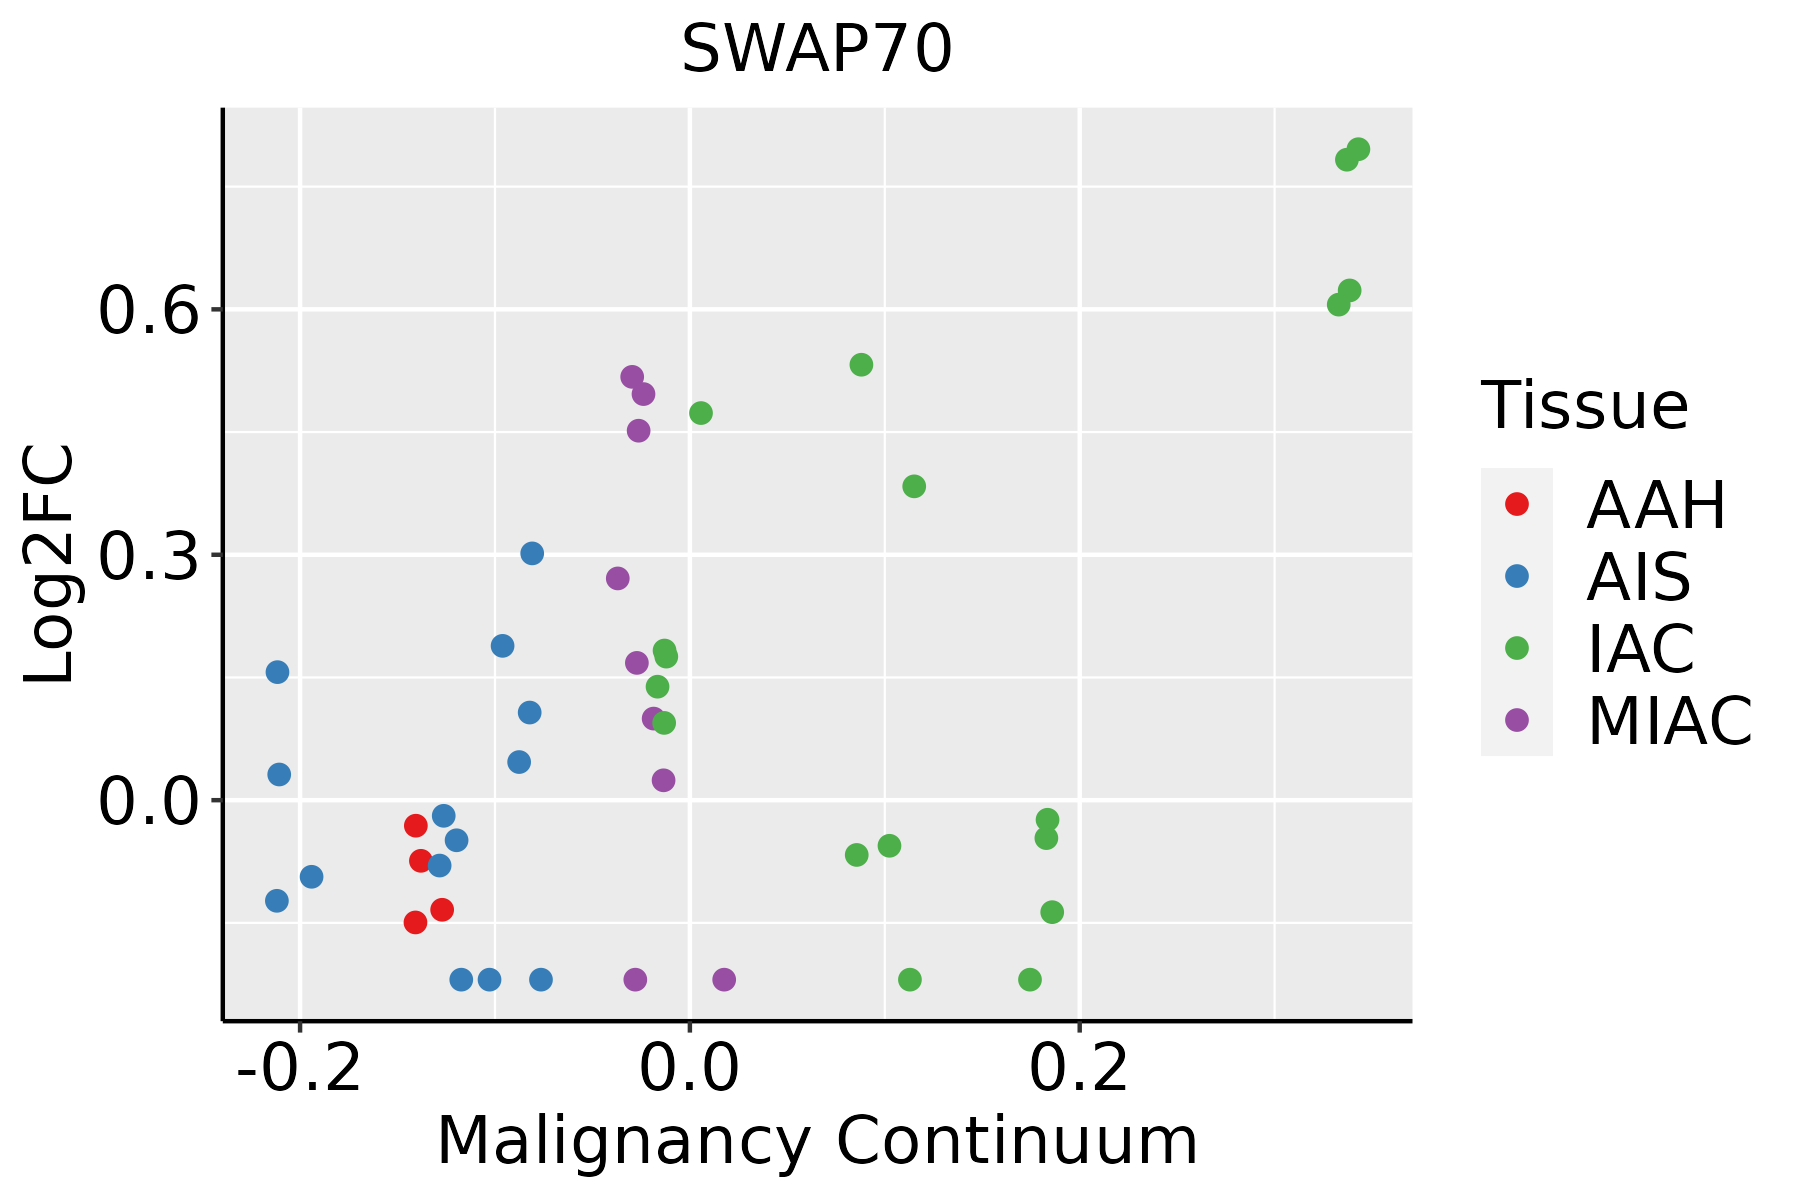
AAH: Atypical adenomatous hyperplasia
AIS: Adenocarcinoma in situ
IAC: Invasive lung adenocarcinoma
MIA: Minimally invasive adenocarcinoma
Oral CavityThe image shows the transcriptomic changes along malignancy continuum.log2FC in expression of this searched gene in stem-like cells from each diseased tissue sample relative to stem-like cells in normal samples in each tissue plotted against the malignancy continuum. Samples are colored based on if they are from different disease stage.EOLP: Erosive Oral lichen planus
LP: leukoplakia
NEOLP: Non-erosive oral lichen planus
OSCC: Oral squamous cell carcinoma
SkinThe image shows the transcriptomic changes along malignancy continuum.log2FC in expression of this searched gene in stem-like cells from each diseased tissue sample relative to stem-like cells in normal samples in each tissue plotted against the malignancy continuum. Samples are colored based on if they are from different disease stage.AK: Actinic keratosis
cSCC: Cutaneous squamous cell carcinoma
SCCIS:squamous cell carcinoma in situ
ThyroidThe image shows the transcriptomic changes along malignancy continuum.log2FC in expression of this searched gene in stem-like cells from each diseased tissue sample relative to stem-like cells in normal samples in each tissue plotted against the malignancy continuum. Samples are colored based on if they are from different disease stage.
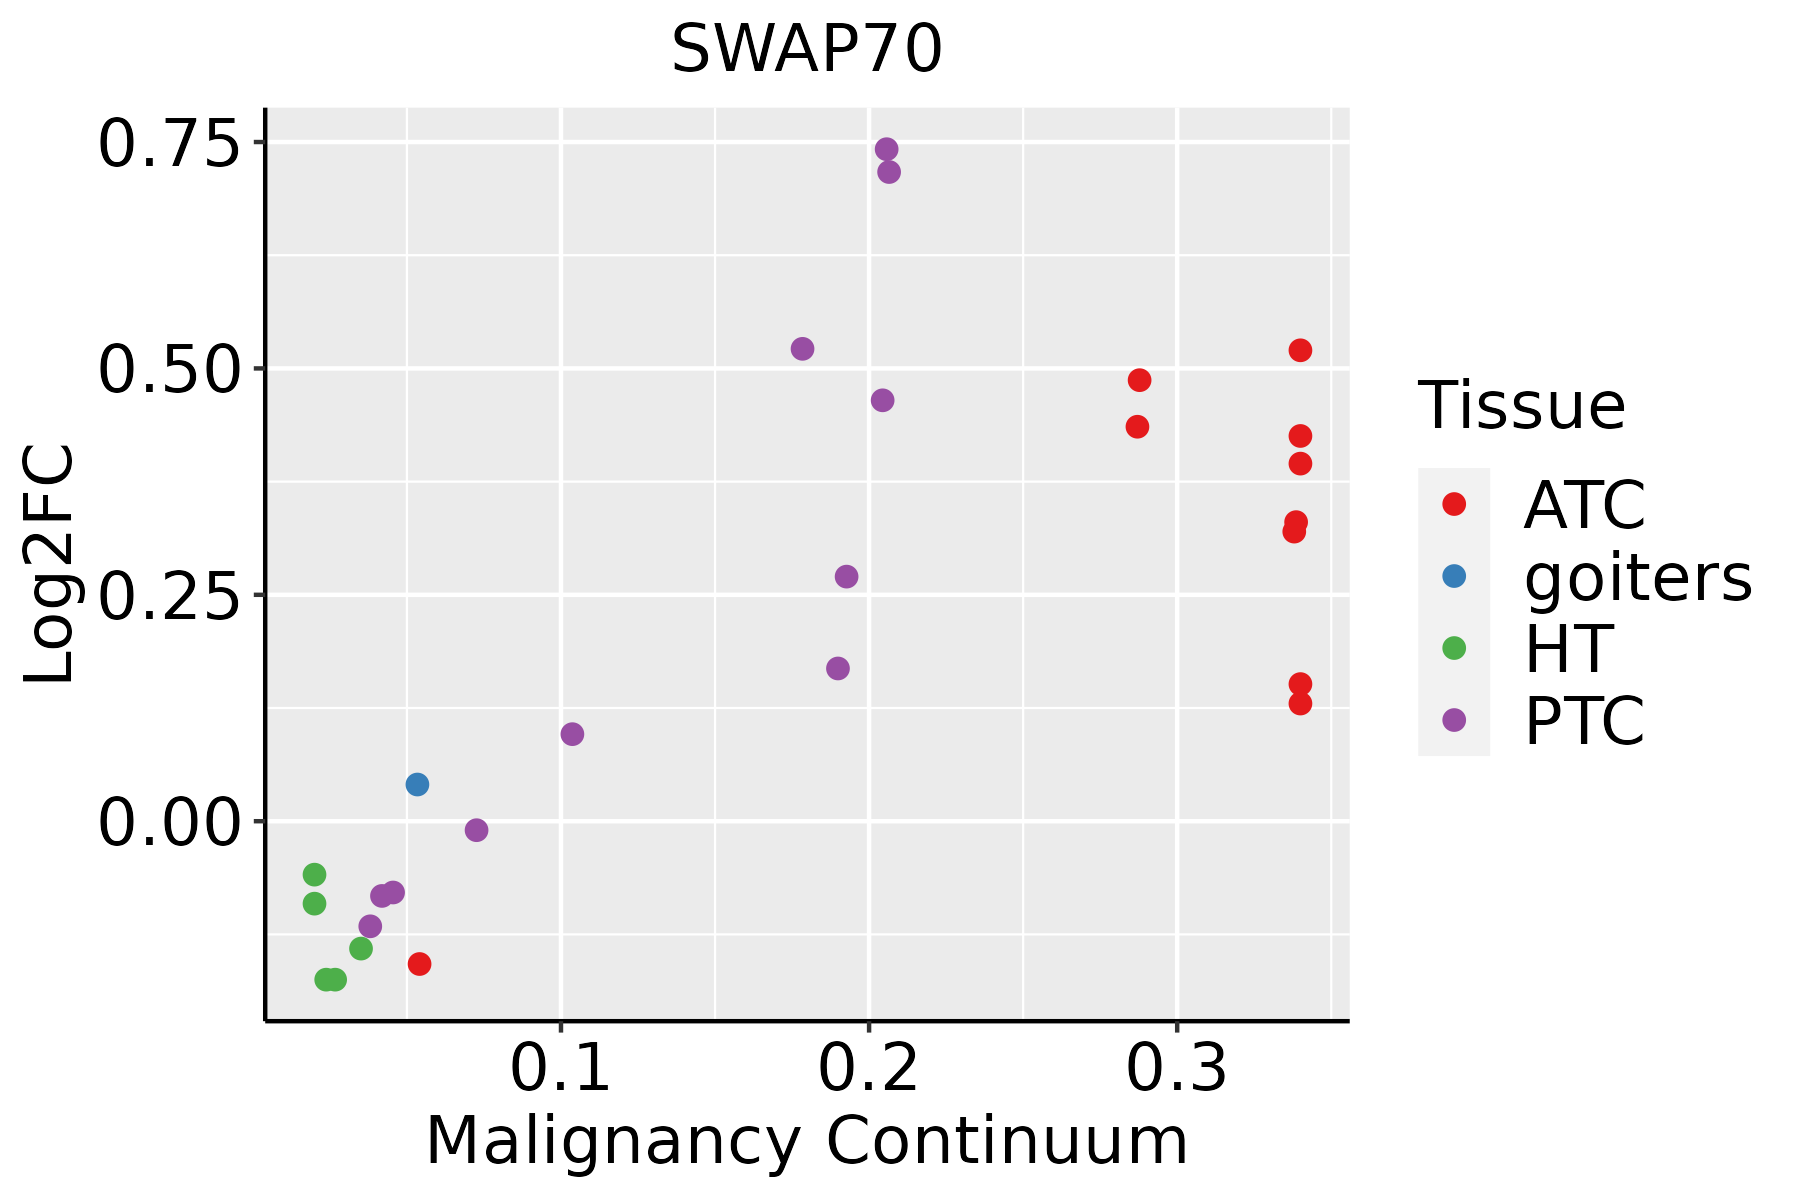
ATC: Anaplastic thyroid cancer
HT: Hashimoto's thyroiditis
PTC: Papillary thyroid cancer
∗log2FC in expression of this searched gene in stem-like cells from each diseased tissue sample relative to stem-like cells in normal samples in each tissue plotted against the malignancy continuum. Samples are colored based on if they are from different disease stage.

Top

Malignant transformation related pathway analysis

check buttonFind out the enriched GO biological processes and KEGG pathways involved in transition from healthy to precancer to cancer
check button Figure of enriched GO biological processes.
TissueDisease StageEnriched GO biological Processes
ColorectumADGO analysis - Figure of enriched GO biological processes: Top 15 enriched GO BP terms are showed in the bar plot of each disease state in each tissue. Each row represents a significant GO biological process which is colored according to the -log10(p.adjust).
ColorectumSERGO analysis - Figure of enriched GO biological processes: Top 15 enriched GO BP terms are showed in the bar plot of each disease state in each tissue. Each row represents a significant GO biological process which is colored according to the -log10(p.adjust).
ColorectumMSSGO analysis - Figure of enriched GO biological processes: Top 15 enriched GO BP terms are showed in the bar plot of each disease state in each tissue. Each row represents a significant GO biological process which is colored according to the -log10(p.adjust).
ColorectumMSI-HGO analysis - Figure of enriched GO biological processes: Top 15 enriched GO BP terms are showed in the bar plot of each disease state in each tissue. Each row represents a significant GO biological process which is colored according to the -log10(p.adjust).
ColorectumFAPGO analysis - Figure of enriched GO biological processes: Top 15 enriched GO BP terms are showed in the bar plot of each disease state in each tissue. Each row represents a significant GO biological process which is colored according to the -log10(p.adjust).
∗Top 15 enriched GO BP terms are showed in the bar plot of each disease state in each tissue. Each row represents a significant GO biological process which is colored according to the -log10(p.adjust).
Page: 1 2 3 4 5 6 7 8 9 

check button Enriched GO biological processes.
GO IDTissueDisease StageDescriptionGene RatioBg Ratiopvaluep.adjustCount
GO:0022411111EsophagusESCCcellular component disassembly305/8552443/187231.94e-234.57e-21305
GO:0010563111EsophagusESCCnegative regulation of phosphorus metabolic process274/8552442/187232.32e-129.41e-11274
GO:0045936111EsophagusESCCnegative regulation of phosphate metabolic process273/8552441/187233.18e-121.25e-10273
GO:003298416EsophagusESCCprotein-containing complex disassembly151/8552224/187233.45e-111.15e-09151
GO:1902905111EsophagusESCCpositive regulation of supramolecular fiber organization142/8552209/187235.51e-111.76e-09142
GO:1902903111EsophagusESCCregulation of supramolecular fiber organization237/8552383/187239.06e-112.75e-09237
GO:0010639110EsophagusESCCnegative regulation of organelle organization215/8552348/187238.20e-102.01e-08215
GO:001631110EsophagusESCCdephosphorylation251/8552417/187231.26e-092.99e-08251
GO:005149520EsophagusESCCpositive regulation of cytoskeleton organization147/8552226/187232.93e-096.38e-08147
GO:000647018EsophagusESCCprotein dephosphorylation177/8552281/187233.13e-096.72e-08177
GO:000701527EsophagusESCCactin filament organization259/8552442/187232.37e-084.50e-07259
GO:003253520EsophagusESCCregulation of cellular component size227/8552383/187234.77e-088.60e-07227
GO:0035304111EsophagusESCCregulation of protein dephosphorylation66/855290/187238.82e-081.48e-0666
GO:0035303111EsophagusESCCregulation of dephosphorylation88/8552128/187231.04e-071.71e-0688
GO:0032970111EsophagusESCCregulation of actin filament-based process231/8552397/187232.91e-074.20e-06231
GO:0032956111EsophagusESCCregulation of actin cytoskeleton organization210/8552358/187234.40e-076.00e-06210
GO:011005327EsophagusESCCregulation of actin filament organization166/8552278/187231.54e-061.85e-05166
GO:005101727EsophagusESCCactin filament bundle assembly100/8552157/187233.87e-064.17e-05100
GO:006157227EsophagusESCCactin filament bundle organization101/8552161/187239.22e-068.82e-05101
GO:000815420EsophagusESCCactin polymerization or depolymerization130/8552218/187232.19e-051.88e-04130
Page: 1 2 3 4 5 6 7 8 9 10 11 12 13 14 15 16 17 18 19 20 

check button Enriched KEGG pathways.
Pathway IDTissueDisease StageDescriptionGene RatioBg Ratiopvaluep.adjustqvalueCount
Page: 1 

Top

Cell-cell communication analysis

check buttonIdentification of potential cell-cell interactions between two cell types and their ligand-receptor pairs for different disease states
LigandReceptorLRpairPathwayTissueDisease Stage
Page: 1 

Top

Single-cell gene regulatory network inference analysis

check buttonFind out the significant the regulons (TFs) and the target genes of each regulon across cell types for different disease states
TFCell TypeTissueDisease StageTarget GeneRSSRegulon Activity
∗The dot plots of a searched regulon are shown for all cell subpopulations in each disease state of each tissue based on the regulon specific score inferred using pySCENIC and by calculating the average expression.
Page: 1 

Top

Somatic mutation of malignant transformation related genes

check buttonAnnotation of somatic variants for genes involved in malignant transformation
Hugo SymbolVariant ClassVariant ClassificationdbSNP RSHGVScHGVSpHGVSp ShortSWISSPROTBIOTYPESIFTPolyPhenTumor Sample BarcodeTissueHistologySexAgeStageTherapy TypesDrugsOutcome
SWAP70SNVMissense_Mutationc.1300N>Cp.Glu434Glnp.E434QQ9UH65protein_codingtolerated(0.68)benign(0.079)TCGA-A2-A0EQ-01Breastbreast invasive carcinomaFemale<65I/IIChemotherapyadriamycinSD
SWAP70SNVMissense_Mutationc.1174G>Ap.Glu392Lysp.E392KQ9UH65protein_codingtolerated(0.32)probably_damaging(0.994)TCGA-AC-A23H-01Breastbreast invasive carcinomaFemale>=65I/IIUnknownUnknownPD
SWAP70SNVMissense_Mutationc.407N>Tp.Ser136Leup.S136LQ9UH65protein_codingtolerated(0.11)benign(0.001)TCGA-B6-A0RV-01Breastbreast invasive carcinomaFemale<65III/IVUnknownUnknownSD
SWAP70insertionIn_Frame_Insnovelc.670_671insCCTTACTTCTTTp.Arg224delinsProLeuLeuLeuTrpp.R224delinsPLLLWQ9UH65protein_codingTCGA-S3-AA17-01Breastbreast invasive carcinomaFemale<65I/IIHormone TherapyanastrozoleSD
SWAP70insertionIn_Frame_Insnovelc.671_672insCATGATTACCCCGTGCTGCCCCCTGATGCTp.Arg224_Lys225insMetIleThrProCysCysProLeuMetLeup.R224_K225insMITPCCPLMLQ9UH65protein_codingTCGA-S3-AA17-01Breastbreast invasive carcinomaFemale<65I/IIHormone TherapyanastrozoleSD
SWAP70SNVMissense_Mutationc.763N>Tp.Leu255Phep.L255FQ9UH65protein_codingtolerated(0.71)benign(0)TCGA-EK-A3GM-01Cervixcervical & endocervical cancerFemale>=65I/IIUnknownUnknownSD
SWAP70SNVMissense_Mutationrs756309764c.670N>Tp.Arg224Trpp.R224WQ9UH65protein_codingdeleterious(0)probably_damaging(0.995)TCGA-A6-6653-01Colorectumcolon adenocarcinomaMale>=65I/IIUnknownUnknownSD
SWAP70SNVMissense_Mutationnovelc.879G>Tp.Lys293Asnp.K293NQ9UH65protein_codingdeleterious(0.01)probably_damaging(0.971)TCGA-AA-A00N-01Colorectumcolon adenocarcinomaMale>=65I/IIUnknownUnknownPD
SWAP70SNVMissense_Mutationc.1310G>Ap.Arg437Lysp.R437KQ9UH65protein_codingtolerated(0.64)benign(0)TCGA-G4-6628-01Colorectumcolon adenocarcinomaMale>=65I/IIUnknownUnknownSD
SWAP70SNVMissense_Mutationnovelc.715A>Cp.Ile239Leup.I239LQ9UH65protein_codingtolerated(1)benign(0.007)TCGA-A5-A0G1-01Endometriumuterine corpus endometrioid carcinomaFemale>=65I/IIUnknownUnknownSD
Page: 1 2 3 4 5 

Top

Related drugs of malignant transformation related genes

check buttonIdentification of chemicals and drugs interact with genes involved in malignant transfromation
(DGIdb 4.0)
Entrez IDSymbolCategoryInteraction TypesDrug Claim NameDrug NamePMIDs
Page: 1