
|
|||||
|
 | |
| |
| |
| |
| |
| |
|
Gene: SVBP |
Gene summary for SVBP |
| Gene information | Species | Human | Gene symbol | SVBP | Gene ID | 374969 |
| Gene name | small vasohibin binding protein | |
| Gene Alias | CCDC23 | |
| Cytomap | 1p34.2 | |
| Gene Type | protein-coding | GO ID | GO:0001667 | UniProtAcc | Q8N300 |
Top |
Malignant transformation analysis |
| Identification of the aberrant gene expression in precancerous and cancerous lesions by comparing the gene expression of stem-like cells in diseased tissues with normal stem cells |
| Entrez ID | Symbol | Replicates | Species | Organ | Tissue | Adj P-value | Log2FC | Malignancy |
| 374969 | SVBP | LZE4T | Human | Esophagus | ESCC | 1.04e-03 | 1.78e-01 | 0.0811 |
| 374969 | SVBP | LZE5T | Human | Esophagus | ESCC | 9.61e-03 | 3.22e-01 | 0.0514 |
| 374969 | SVBP | LZE7T | Human | Esophagus | ESCC | 1.42e-07 | 4.42e-01 | 0.0667 |
| 374969 | SVBP | LZE8T | Human | Esophagus | ESCC | 2.75e-05 | 1.61e-01 | 0.067 |
| 374969 | SVBP | LZE20T | Human | Esophagus | ESCC | 2.06e-10 | 3.53e-01 | 0.0662 |
| 374969 | SVBP | LZE22T | Human | Esophagus | ESCC | 5.85e-08 | 5.15e-01 | 0.068 |
| 374969 | SVBP | LZE24T | Human | Esophagus | ESCC | 1.11e-16 | 4.94e-01 | 0.0596 |
| 374969 | SVBP | LZE22D3 | Human | Esophagus | HGIN | 2.50e-02 | 3.47e-01 | 0.0653 |
| 374969 | SVBP | LZE21T | Human | Esophagus | ESCC | 6.85e-05 | 1.61e-01 | 0.0655 |
| 374969 | SVBP | LZE6T | Human | Esophagus | ESCC | 1.91e-08 | 2.61e-01 | 0.0845 |
| 374969 | SVBP | P1T-E | Human | Esophagus | ESCC | 4.23e-07 | 2.72e-01 | 0.0875 |
| 374969 | SVBP | P2T-E | Human | Esophagus | ESCC | 4.96e-47 | 7.86e-01 | 0.1177 |
| 374969 | SVBP | P4T-E | Human | Esophagus | ESCC | 8.79e-31 | 5.51e-01 | 0.1323 |
| 374969 | SVBP | P5T-E | Human | Esophagus | ESCC | 2.69e-14 | 2.66e-01 | 0.1327 |
| 374969 | SVBP | P8T-E | Human | Esophagus | ESCC | 2.69e-30 | 4.89e-01 | 0.0889 |
| 374969 | SVBP | P9T-E | Human | Esophagus | ESCC | 9.52e-15 | 3.75e-01 | 0.1131 |
| 374969 | SVBP | P10T-E | Human | Esophagus | ESCC | 4.63e-50 | 8.85e-01 | 0.116 |
| 374969 | SVBP | P11T-E | Human | Esophagus | ESCC | 4.16e-10 | 5.48e-01 | 0.1426 |
| 374969 | SVBP | P12T-E | Human | Esophagus | ESCC | 1.32e-35 | 6.61e-01 | 0.1122 |
| 374969 | SVBP | P15T-E | Human | Esophagus | ESCC | 1.40e-22 | 4.46e-01 | 0.1149 |
| Page: 1 2 3 4 5 6 |
| Tissue | Expression Dynamics | Abbreviation |
| Esophagus |  | ESCC: Esophageal squamous cell carcinoma |
| HGIN: High-grade intraepithelial neoplasias | ||
| LGIN: Low-grade intraepithelial neoplasias | ||
| Liver |  | HCC: Hepatocellular carcinoma |
| NAFLD: Non-alcoholic fatty liver disease | ||
| Oral Cavity |  | EOLP: Erosive Oral lichen planus |
| LP: leukoplakia | ||
| NEOLP: Non-erosive oral lichen planus | ||
| OSCC: Oral squamous cell carcinoma | ||
| Thyroid | 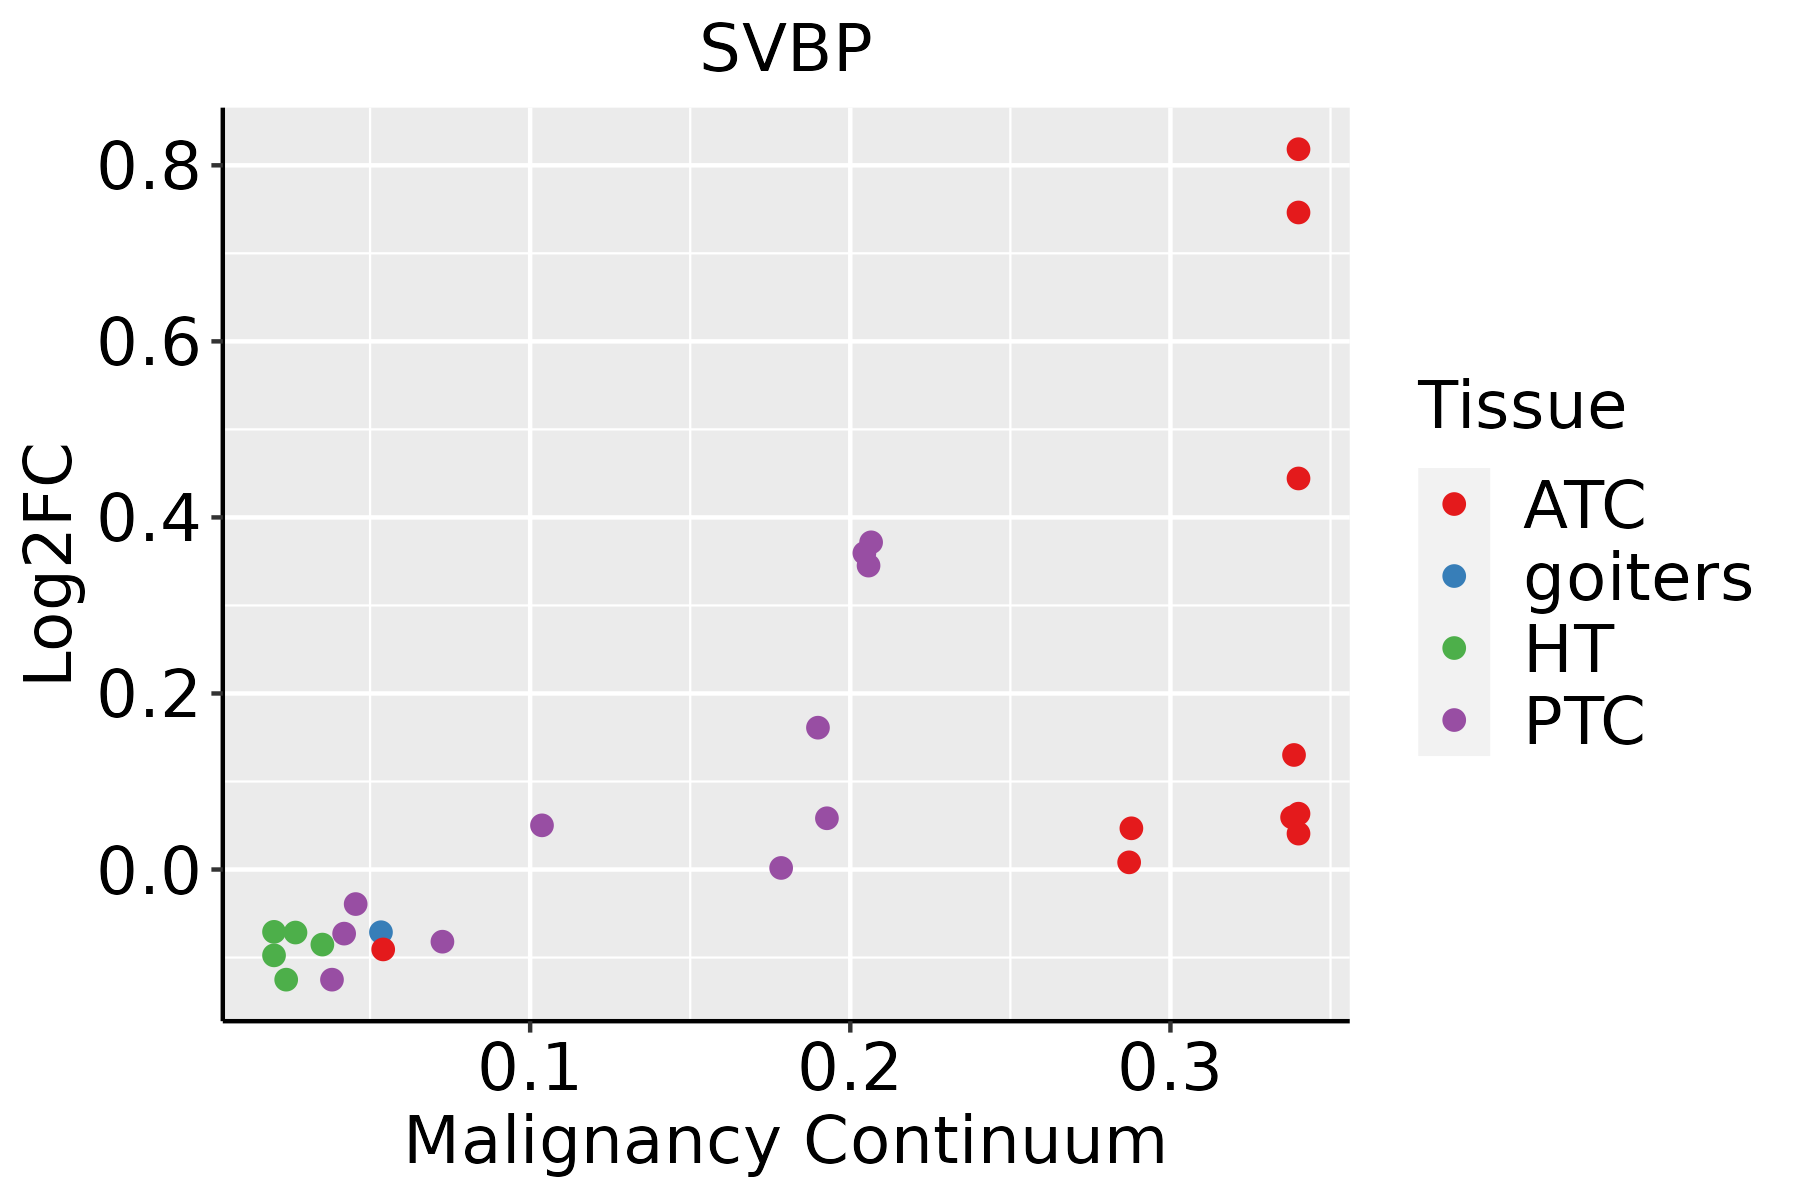 | ATC: Anaplastic thyroid cancer |
| HT: Hashimoto's thyroiditis | ||
| PTC: Papillary thyroid cancer |
| ∗log2FC in expression of this searched gene in stem-like cells from each diseased tissue sample relative to stem-like cells in normal samples in each tissue plotted against the malignancy continuum. Samples are colored based on if they are from different disease stage. |
Top |
Malignant transformation related pathway analysis |
| Find out the enriched GO biological processes and KEGG pathways involved in transition from healthy to precancer to cancer |
| Tissue | Disease Stage | Enriched GO biological Processes |
| Colorectum | AD |  |
| Colorectum | SER |  |
| Colorectum | MSS |  |
| Colorectum | MSI-H |  |
| Colorectum | FAP |  |
| ∗Top 15 enriched GO BP terms are showed in the bar plot of each disease state in each tissue. Each row represents a significant GO biological process which is colored according to the -log10(p.adjust). |
| Page: 1 2 3 4 5 6 7 8 9 |
| GO ID | Tissue | Disease Stage | Description | Gene Ratio | Bg Ratio | pvalue | p.adjust | Count |
| GO:190332027 | Esophagus | HGIN | regulation of protein modification by small protein conjugation or removal | 78/2587 | 242/18723 | 1.40e-13 | 2.26e-11 | 78 |
| GO:003139627 | Esophagus | HGIN | regulation of protein ubiquitination | 64/2587 | 210/18723 | 3.02e-10 | 2.71e-08 | 64 |
| GO:190332127 | Esophagus | HGIN | negative regulation of protein modification by small protein conjugation or removal | 33/2587 | 95/18723 | 2.07e-07 | 9.95e-06 | 33 |
| GO:003139727 | Esophagus | HGIN | negative regulation of protein ubiquitination | 30/2587 | 83/18723 | 2.72e-07 | 1.28e-05 | 30 |
| GO:005254726 | Esophagus | HGIN | regulation of peptidase activity | 102/2587 | 461/18723 | 6.29e-07 | 2.72e-05 | 102 |
| GO:1903320111 | Esophagus | ESCC | regulation of protein modification by small protein conjugation or removal | 181/8552 | 242/18723 | 1.80e-20 | 2.60e-18 | 181 |
| GO:0031396111 | Esophagus | ESCC | regulation of protein ubiquitination | 154/8552 | 210/18723 | 2.70e-16 | 2.04e-14 | 154 |
| GO:0052547111 | Esophagus | ESCC | regulation of peptidase activity | 275/8552 | 461/18723 | 7.54e-10 | 1.88e-08 | 275 |
| GO:0031397111 | Esophagus | ESCC | negative regulation of protein ubiquitination | 63/8552 | 83/18723 | 1.87e-08 | 3.65e-07 | 63 |
| GO:1903321111 | Esophagus | ESCC | negative regulation of protein modification by small protein conjugation or removal | 69/8552 | 95/18723 | 8.54e-08 | 1.44e-06 | 69 |
| GO:006156415 | Esophagus | ESCC | axon development | 251/8552 | 467/18723 | 2.41e-04 | 1.49e-03 | 251 |
| GO:000166720 | Esophagus | ESCC | ameboidal-type cell migration | 250/8552 | 475/18723 | 1.22e-03 | 5.97e-03 | 250 |
| GO:000930617 | Esophagus | ESCC | protein secretion | 190/8552 | 359/18723 | 3.22e-03 | 1.34e-02 | 190 |
| GO:003559217 | Esophagus | ESCC | establishment of protein localization to extracellular region | 190/8552 | 360/18723 | 3.77e-03 | 1.53e-02 | 190 |
| GO:007169210 | Esophagus | ESCC | protein localization to extracellular region | 193/8552 | 368/18723 | 5.01e-03 | 1.92e-02 | 193 |
| GO:001063120 | Esophagus | ESCC | epithelial cell migration | 187/8552 | 357/18723 | 6.05e-03 | 2.23e-02 | 187 |
| GO:009013220 | Esophagus | ESCC | epithelium migration | 188/8552 | 360/18723 | 6.96e-03 | 2.54e-02 | 188 |
| GO:009013020 | Esophagus | ESCC | tissue migration | 190/8552 | 365/18723 | 7.91e-03 | 2.82e-02 | 190 |
| GO:005254712 | Liver | Cirrhotic | regulation of peptidase activity | 185/4634 | 461/18723 | 1.32e-13 | 1.09e-11 | 185 |
| GO:190332012 | Liver | Cirrhotic | regulation of protein modification by small protein conjugation or removal | 105/4634 | 242/18723 | 1.43e-10 | 7.43e-09 | 105 |
| Page: 1 2 3 4 5 |
| Pathway ID | Tissue | Disease Stage | Description | Gene Ratio | Bg Ratio | pvalue | p.adjust | qvalue | Count |
| Page: 1 |
Top |
Cell-cell communication analysis |
| Identification of potential cell-cell interactions between two cell types and their ligand-receptor pairs for different disease states |
| Ligand | Receptor | LRpair | Pathway | Tissue | Disease Stage |
| Page: 1 |
Top |
Single-cell gene regulatory network inference analysis |
| Find out the significant the regulons (TFs) and the target genes of each regulon across cell types for different disease states |
| TF | Cell Type | Tissue | Disease Stage | Target Gene | RSS | Regulon Activity |
| ∗The dot plots of a searched regulon are shown for all cell subpopulations in each disease state of each tissue based on the regulon specific score inferred using pySCENIC and by calculating the average expression. |
| Page: 1 |
Top |
Somatic mutation of malignant transformation related genes |
| Annotation of somatic variants for genes involved in malignant transformation |
| Hugo Symbol | Variant Class | Variant Classification | dbSNP RS | HGVSc | HGVSp | HGVSp Short | SWISSPROT | BIOTYPE | SIFT | PolyPhen | Tumor Sample Barcode | Tissue | Histology | Sex | Age | Stage | Therapy Types | Drugs | Outcome |
| SVBP | SNV | Missense_Mutation | novel | c.159N>C | p.Gln53His | p.Q53H | Q8N300 | protein_coding | tolerated(0.12) | benign(0.431) | TCGA-AC-A2QI-01 | Breast | breast invasive carcinoma | Female | >=65 | III/IV | Chemotherapy | cytoxan | CR |
| SVBP | SNV | Missense_Mutation | c.53N>C | p.Arg18Thr | p.R18T | Q8N300 | protein_coding | deleterious(0.01) | benign(0.306) | TCGA-BH-A0H5-01 | Breast | breast invasive carcinoma | Female | <65 | I/II | Chemotherapy | cytoxan | CR | |
| SVBP | SNV | Missense_Mutation | c.104N>G | p.Gln35Arg | p.Q35R | Q8N300 | protein_coding | deleterious(0.01) | probably_damaging(0.954) | TCGA-D8-A1X6-01 | Breast | breast invasive carcinoma | Female | >=65 | III/IV | Hormone Therapy | tamoxiphen | SD | |
| SVBP | deletion | Frame_Shift_Del | rs563737990 | c.72_73delNN | p.Lys25IlefsTer30 | p.K25Ifs*30 | Q8N300 | protein_coding | TCGA-AR-A5QQ-01 | Breast | breast invasive carcinoma | Female | >=65 | III/IV | Chemotherapy | carboplatin | PD | ||
| SVBP | SNV | Missense_Mutation | c.29C>A | p.Thr10Asn | p.T10N | Q8N300 | protein_coding | tolerated(0.11) | benign(0) | TCGA-AA-A00N-01 | Colorectum | colon adenocarcinoma | Male | >=65 | I/II | Unknown | Unknown | PD | |
| SVBP | SNV | Missense_Mutation | novel | c.5A>G | p.Asp2Gly | p.D2G | Q8N300 | protein_coding | tolerated_low_confidence(0.12) | benign(0.104) | TCGA-F5-6814-01 | Colorectum | rectum adenocarcinoma | Male | <65 | I/II | Unknown | Unknown | SD |
| SVBP | SNV | Missense_Mutation | novel | c.88N>A | p.Glu30Lys | p.E30K | Q8N300 | protein_coding | tolerated(0.07) | probably_damaging(0.981) | TCGA-92-8065-01 | Lung | lung squamous cell carcinoma | Female | >=65 | I/II | Unknown | Unknown | SD |
| Page: 1 |
Top |
Related drugs of malignant transformation related genes |
| Identification of chemicals and drugs interact with genes involved in malignant transfromation |
| (DGIdb 4.0) |
| Entrez ID | Symbol | Category | Interaction Types | Drug Claim Name | Drug Name | PMIDs |
| Page: 1 |

Copyright 2023-Present -The University of Texas Health Science Center at Houston |