
|
|||||
|
 | |
| |
| |
| |
| |
| |
|
Gene: SUZ12 |
Gene summary for SUZ12 |
| Gene information | Species | Human | Gene symbol | SUZ12 | Gene ID | 23512 |
| Gene name | SUZ12 polycomb repressive complex 2 subunit | |
| Gene Alias | CHET9 | |
| Cytomap | 17q11.2 | |
| Gene Type | protein-coding | GO ID | GO:0001816 | UniProtAcc | J3QQW9 |
Top |
Malignant transformation analysis |
| Identification of the aberrant gene expression in precancerous and cancerous lesions by comparing the gene expression of stem-like cells in diseased tissues with normal stem cells |
| Entrez ID | Symbol | Replicates | Species | Organ | Tissue | Adj P-value | Log2FC | Malignancy |
| 23512 | SUZ12 | LZE2T | Human | Esophagus | ESCC | 3.29e-06 | 5.66e-01 | 0.082 |
| 23512 | SUZ12 | LZE4T | Human | Esophagus | ESCC | 3.67e-08 | 2.94e-01 | 0.0811 |
| 23512 | SUZ12 | LZE5T | Human | Esophagus | ESCC | 6.52e-06 | 1.26e+00 | 0.0514 |
| 23512 | SUZ12 | LZE7T | Human | Esophagus | ESCC | 7.88e-07 | 3.91e-01 | 0.0667 |
| 23512 | SUZ12 | LZE8T | Human | Esophagus | ESCC | 9.45e-03 | 2.64e-02 | 0.067 |
| 23512 | SUZ12 | LZE22T | Human | Esophagus | ESCC | 3.71e-03 | 2.60e-01 | 0.068 |
| 23512 | SUZ12 | LZE24T | Human | Esophagus | ESCC | 2.66e-14 | 2.80e-01 | 0.0596 |
| 23512 | SUZ12 | LZE21T | Human | Esophagus | ESCC | 9.58e-05 | 1.70e-01 | 0.0655 |
| 23512 | SUZ12 | P1T-E | Human | Esophagus | ESCC | 2.88e-02 | 1.84e-01 | 0.0875 |
| 23512 | SUZ12 | P2T-E | Human | Esophagus | ESCC | 9.78e-31 | 5.62e-01 | 0.1177 |
| 23512 | SUZ12 | P4T-E | Human | Esophagus | ESCC | 1.17e-24 | 5.99e-01 | 0.1323 |
| 23512 | SUZ12 | P5T-E | Human | Esophagus | ESCC | 5.64e-20 | 4.62e-01 | 0.1327 |
| 23512 | SUZ12 | P8T-E | Human | Esophagus | ESCC | 4.83e-26 | 4.78e-01 | 0.0889 |
| 23512 | SUZ12 | P9T-E | Human | Esophagus | ESCC | 2.65e-09 | 2.84e-01 | 0.1131 |
| 23512 | SUZ12 | P10T-E | Human | Esophagus | ESCC | 9.72e-15 | 3.02e-01 | 0.116 |
| 23512 | SUZ12 | P11T-E | Human | Esophagus | ESCC | 2.50e-07 | 3.36e-01 | 0.1426 |
| 23512 | SUZ12 | P12T-E | Human | Esophagus | ESCC | 3.31e-22 | 3.80e-01 | 0.1122 |
| 23512 | SUZ12 | P15T-E | Human | Esophagus | ESCC | 1.20e-22 | 5.16e-01 | 0.1149 |
| 23512 | SUZ12 | P16T-E | Human | Esophagus | ESCC | 1.97e-17 | 3.70e-01 | 0.1153 |
| 23512 | SUZ12 | P17T-E | Human | Esophagus | ESCC | 3.84e-05 | 1.09e-01 | 0.1278 |
| Page: 1 2 3 4 5 6 |
| Tissue | Expression Dynamics | Abbreviation |
| Esophagus |  | ESCC: Esophageal squamous cell carcinoma |
| HGIN: High-grade intraepithelial neoplasias | ||
| LGIN: Low-grade intraepithelial neoplasias | ||
| Liver |  | HCC: Hepatocellular carcinoma |
| NAFLD: Non-alcoholic fatty liver disease | ||
| Oral Cavity | 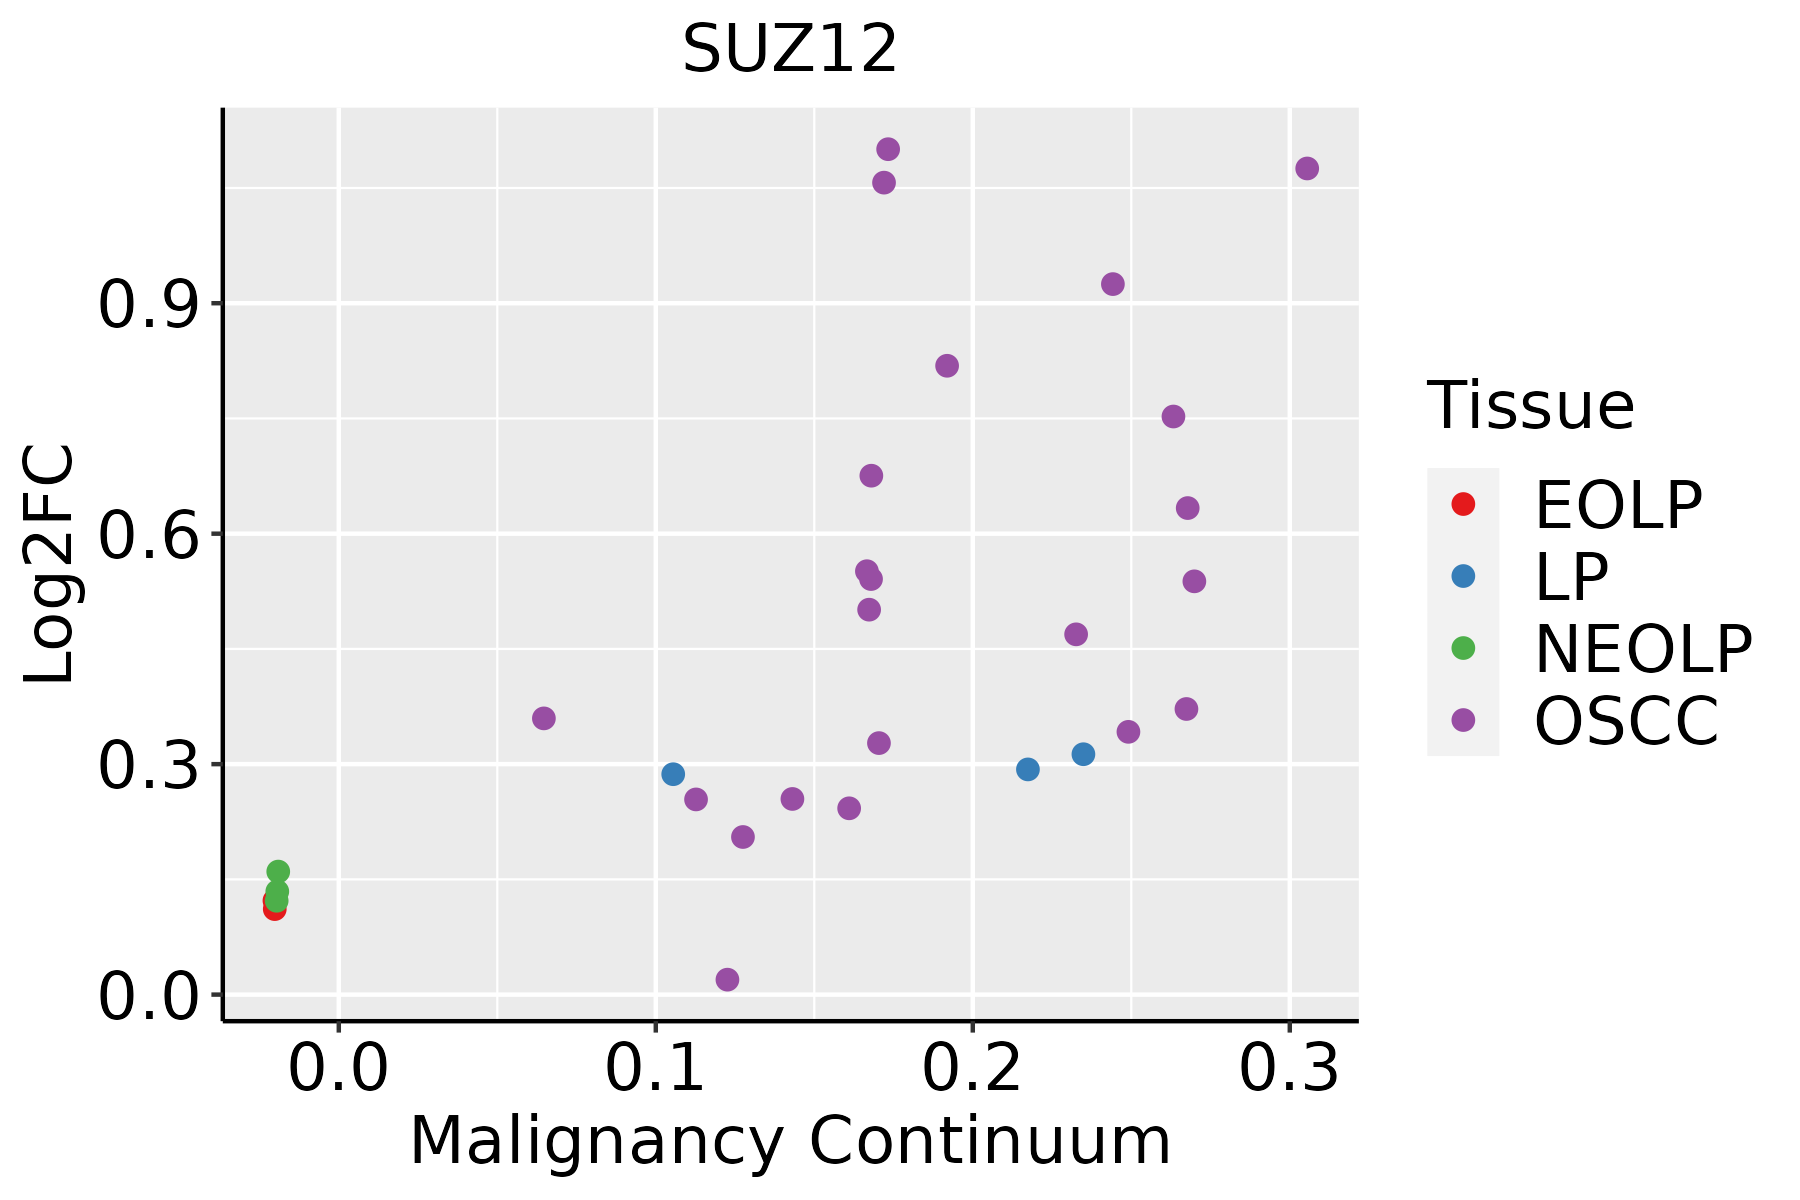 | EOLP: Erosive Oral lichen planus |
| LP: leukoplakia | ||
| NEOLP: Non-erosive oral lichen planus | ||
| OSCC: Oral squamous cell carcinoma | ||
| Skin |  | AK: Actinic keratosis |
| cSCC: Cutaneous squamous cell carcinoma | ||
| SCCIS:squamous cell carcinoma in situ | ||
| Thyroid |  | ATC: Anaplastic thyroid cancer |
| HT: Hashimoto's thyroiditis | ||
| PTC: Papillary thyroid cancer |
| ∗log2FC in expression of this searched gene in stem-like cells from each diseased tissue sample relative to stem-like cells in normal samples in each tissue plotted against the malignancy continuum. Samples are colored based on if they are from different disease stage. |
Top |
Malignant transformation related pathway analysis |
| Find out the enriched GO biological processes and KEGG pathways involved in transition from healthy to precancer to cancer |
| Tissue | Disease Stage | Enriched GO biological Processes |
| Colorectum | AD |  |
| Colorectum | SER |  |
| Colorectum | MSS |  |
| Colorectum | MSI-H |  |
| Colorectum | FAP |  |
| ∗Top 15 enriched GO BP terms are showed in the bar plot of each disease state in each tissue. Each row represents a significant GO biological process which is colored according to the -log10(p.adjust). |
| Page: 1 2 3 4 5 6 7 8 9 |
| GO ID | Tissue | Disease Stage | Description | Gene Ratio | Bg Ratio | pvalue | p.adjust | Count |
| GO:001657015 | Esophagus | ESCC | histone modification | 323/8552 | 463/18723 | 2.61e-26 | 7.88e-24 | 323 |
| GO:001820514 | Esophagus | ESCC | peptidyl-lysine modification | 259/8552 | 376/18723 | 3.90e-20 | 5.26e-18 | 259 |
| GO:0010563111 | Esophagus | ESCC | negative regulation of phosphorus metabolic process | 274/8552 | 442/18723 | 2.32e-12 | 9.41e-11 | 274 |
| GO:0045936111 | Esophagus | ESCC | negative regulation of phosphate metabolic process | 273/8552 | 441/18723 | 3.18e-12 | 1.25e-10 | 273 |
| GO:0042326111 | Esophagus | ESCC | negative regulation of phosphorylation | 237/8552 | 385/18723 | 1.86e-10 | 5.33e-09 | 237 |
| GO:00434143 | Esophagus | ESCC | macromolecule methylation | 199/8552 | 316/18723 | 3.44e-10 | 9.57e-09 | 199 |
| GO:0001933111 | Esophagus | ESCC | negative regulation of protein phosphorylation | 213/8552 | 342/18723 | 3.54e-10 | 9.76e-09 | 213 |
| GO:00322592 | Esophagus | ESCC | methylation | 222/8552 | 364/18723 | 2.26e-09 | 5.09e-08 | 222 |
| GO:000647914 | Esophagus | ESCC | protein methylation | 115/8552 | 181/18723 | 9.07e-07 | 1.16e-05 | 115 |
| GO:000821314 | Esophagus | ESCC | protein alkylation | 115/8552 | 181/18723 | 9.07e-07 | 1.16e-05 | 115 |
| GO:00165718 | Esophagus | ESCC | histone methylation | 89/8552 | 141/18723 | 2.17e-05 | 1.87e-04 | 89 |
| GO:00507322 | Esophagus | ESCC | negative regulation of peptidyl-tyrosine phosphorylation | 42/8552 | 59/18723 | 6.35e-05 | 4.84e-04 | 42 |
| GO:005067318 | Esophagus | ESCC | epithelial cell proliferation | 238/8552 | 437/18723 | 1.19e-04 | 8.20e-04 | 238 |
| GO:003496814 | Esophagus | ESCC | histone lysine methylation | 72/8552 | 115/18723 | 1.85e-04 | 1.18e-03 | 72 |
| GO:001802214 | Esophagus | ESCC | peptidyl-lysine methylation | 79/8552 | 131/18723 | 5.17e-04 | 2.86e-03 | 79 |
| GO:005067817 | Esophagus | ESCC | regulation of epithelial cell proliferation | 206/8552 | 381/18723 | 5.51e-04 | 3.02e-03 | 206 |
| GO:00182124 | Esophagus | ESCC | peptidyl-tyrosine modification | 202/8552 | 378/18723 | 1.34e-03 | 6.39e-03 | 202 |
| GO:00181084 | Esophagus | ESCC | peptidyl-tyrosine phosphorylation | 200/8552 | 375/18723 | 1.60e-03 | 7.45e-03 | 200 |
| GO:00507303 | Esophagus | ESCC | regulation of peptidyl-tyrosine phosphorylation | 144/8552 | 264/18723 | 2.22e-03 | 9.78e-03 | 144 |
| GO:00325261 | Esophagus | ESCC | response to retinoic acid | 63/8552 | 107/18723 | 4.05e-03 | 1.62e-02 | 63 |
| Page: 1 2 3 4 5 6 7 |
| Pathway ID | Tissue | Disease Stage | Description | Gene Ratio | Bg Ratio | pvalue | p.adjust | qvalue | Count |
| Page: 1 |
Top |
Cell-cell communication analysis |
| Identification of potential cell-cell interactions between two cell types and their ligand-receptor pairs for different disease states |
| Ligand | Receptor | LRpair | Pathway | Tissue | Disease Stage |
| Page: 1 |
Top |
Single-cell gene regulatory network inference analysis |
| Find out the significant the regulons (TFs) and the target genes of each regulon across cell types for different disease states |
| TF | Cell Type | Tissue | Disease Stage | Target Gene | RSS | Regulon Activity |
| SUZ12 | TAC | Colorectum | FAP | POLE2,ADGRV1,KNTC1, etc. | 3.11e-01 |  |
| SUZ12 | MYOFIB | Colorectum | AD | KIAA2013,RAB11FIP2,PSMG4, etc. | 1.58e-01 |  |
| SUZ12 | VFIB | Colorectum | MSI-H | KIAA2013,RAB11FIP2,PSMG4, etc. | 2.41e-01 |  |
| SUZ12 | VFIB | Colorectum | MSS | KIAA2013,RAB11FIP2,PSMG4, etc. | 2.50e-02 |  |
| SUZ12 | ADIPO | Lung | Healthy | CCL4,BANP,SPATC1, etc. | 1.20e-02 |  |
| SUZ12 | MYOFIB | Lung | Healthy | CCL4,BANP,SPATC1, etc. | 0.00e+00 | |
| ∗The dot plots of a searched regulon are shown for all cell subpopulations in each disease state of each tissue based on the regulon specific score inferred using pySCENIC and by calculating the average expression. |
| Page: 1 |
Top |
Somatic mutation of malignant transformation related genes |
| Annotation of somatic variants for genes involved in malignant transformation |
| Hugo Symbol | Variant Class | Variant Classification | dbSNP RS | HGVSc | HGVSp | HGVSp Short | SWISSPROT | BIOTYPE | SIFT | PolyPhen | Tumor Sample Barcode | Tissue | Histology | Sex | Age | Stage | Therapy Types | Drugs | Outcome |
| SUZ12 | SNV | Missense_Mutation | c.1147N>A | p.Glu383Lys | p.E383K | Q15022 | protein_coding | tolerated(0.18) | benign(0.027) | TCGA-A2-A0YH-01 | Breast | breast invasive carcinoma | Female | <65 | III/IV | Chemotherapy | adriamycin | SD | |
| SUZ12 | SNV | Missense_Mutation | c.285N>C | p.Gln95His | p.Q95H | Q15022 | protein_coding | deleterious(0) | possibly_damaging(0.671) | TCGA-A2-A0YJ-01 | Breast | breast invasive carcinoma | Female | <65 | III/IV | Chemotherapy | cytoxan | PD | |
| SUZ12 | SNV | Missense_Mutation | novel | c.432N>C | p.Met144Ile | p.M144I | Q15022 | protein_coding | deleterious(0.02) | benign(0.023) | TCGA-AC-A5XS-01 | Breast | breast invasive carcinoma | Female | >=65 | I/II | Hormone Therapy | femara | SD |
| SUZ12 | SNV | Missense_Mutation | novel | c.907N>C | p.Asp303His | p.D303H | Q15022 | protein_coding | deleterious(0) | probably_damaging(0.995) | TCGA-AC-A5XU-01 | Breast | breast invasive carcinoma | Female | >=65 | I/II | Hormone Therapy | letrozole | SD |
| SUZ12 | SNV | Missense_Mutation | c.955N>C | p.Met319Leu | p.M319L | Q15022 | protein_coding | tolerated(0.71) | benign(0.007) | TCGA-AN-A0AK-01 | Breast | breast invasive carcinoma | Female | >=65 | I/II | Unknown | Unknown | SD | |
| SUZ12 | SNV | Missense_Mutation | c.1585C>G | p.Leu529Val | p.L529V | Q15022 | protein_coding | tolerated(0.08) | probably_damaging(0.967) | TCGA-D8-A1JG-01 | Breast | breast invasive carcinoma | Female | <65 | I/II | Chemotherapy | doxorubicin | SD | |
| SUZ12 | SNV | Missense_Mutation | novel | c.776G>A | p.Arg259Lys | p.R259K | Q15022 | protein_coding | tolerated(0.68) | benign(0.003) | TCGA-E2-A2P6-01 | Breast | breast invasive carcinoma | Female | >=65 | I/II | Hormone Therapy | anastrozole | SD |
| SUZ12 | SNV | Missense_Mutation | novel | c.110N>T | p.Ser37Leu | p.S37L | Q15022 | protein_coding | deleterious_low_confidence(0.03) | benign(0.01) | TCGA-C5-A1BQ-01 | Cervix | cervical & endocervical cancer | Female | >=65 | III/IV | Chemotherapy | cisplatin | CR |
| SUZ12 | SNV | Missense_Mutation | c.1412N>G | p.His471Arg | p.H471R | Q15022 | protein_coding | deleterious(0) | probably_damaging(0.966) | TCGA-AD-6889-01 | Colorectum | colon adenocarcinoma | Male | >=65 | I/II | Chemotherapy | xeloda | PD | |
| SUZ12 | SNV | Missense_Mutation | novel | c.367N>C | p.Ser123Pro | p.S123P | Q15022 | protein_coding | deleterious(0.03) | possibly_damaging(0.77) | TCGA-AZ-6601-01 | Colorectum | colon adenocarcinoma | Male | >=65 | I/II | Unknown | Unknown | PD |
| Page: 1 2 3 4 5 6 |
Top |
Related drugs of malignant transformation related genes |
| Identification of chemicals and drugs interact with genes involved in malignant transfromation |
| (DGIdb 4.0) |
| Entrez ID | Symbol | Category | Interaction Types | Drug Claim Name | Drug Name | PMIDs |
| Page: 1 |

Copyright 2023-Present -The University of Texas Health Science Center at Houston |