
|
|||||
|
 | |
| |
| |
| |
| |
| |
|
Gene: SUSD6 |
Gene summary for SUSD6 |
| Gene information | Species | Human | Gene symbol | SUSD6 | Gene ID | 9766 |
| Gene name | sushi domain containing 6 | |
| Gene Alias | DRAGO | |
| Cytomap | 14q24.1 | |
| Gene Type | protein-coding | GO ID | GO:0006950 | UniProtAcc | Q92537 |
Top |
Malignant transformation analysis |
| Identification of the aberrant gene expression in precancerous and cancerous lesions by comparing the gene expression of stem-like cells in diseased tissues with normal stem cells |
| Entrez ID | Symbol | Replicates | Species | Organ | Tissue | Adj P-value | Log2FC | Malignancy |
| 9766 | SUSD6 | LZE4T | Human | Esophagus | ESCC | 1.54e-06 | 4.73e-02 | 0.0811 |
| 9766 | SUSD6 | LZE5T | Human | Esophagus | ESCC | 3.09e-03 | 8.48e-02 | 0.0514 |
| 9766 | SUSD6 | LZE7T | Human | Esophagus | ESCC | 8.43e-09 | 1.44e-01 | 0.0667 |
| 9766 | SUSD6 | LZE8T | Human | Esophagus | ESCC | 3.50e-08 | 9.36e-02 | 0.067 |
| 9766 | SUSD6 | LZE20T | Human | Esophagus | ESCC | 2.82e-04 | 1.57e-01 | 0.0662 |
| 9766 | SUSD6 | LZE22T | Human | Esophagus | ESCC | 2.56e-06 | 1.66e-01 | 0.068 |
| 9766 | SUSD6 | LZE24T | Human | Esophagus | ESCC | 1.22e-11 | 2.15e-01 | 0.0596 |
| 9766 | SUSD6 | P2T-E | Human | Esophagus | ESCC | 1.86e-24 | 3.23e-01 | 0.1177 |
| 9766 | SUSD6 | P4T-E | Human | Esophagus | ESCC | 2.72e-13 | 3.72e-02 | 0.1323 |
| 9766 | SUSD6 | P5T-E | Human | Esophagus | ESCC | 4.10e-15 | 8.79e-02 | 0.1327 |
| 9766 | SUSD6 | P8T-E | Human | Esophagus | ESCC | 1.84e-18 | 3.12e-01 | 0.0889 |
| 9766 | SUSD6 | P9T-E | Human | Esophagus | ESCC | 1.40e-13 | 5.46e-02 | 0.1131 |
| 9766 | SUSD6 | P10T-E | Human | Esophagus | ESCC | 4.86e-18 | 1.02e-01 | 0.116 |
| 9766 | SUSD6 | P11T-E | Human | Esophagus | ESCC | 5.35e-06 | 1.66e-01 | 0.1426 |
| 9766 | SUSD6 | P12T-E | Human | Esophagus | ESCC | 3.81e-25 | 5.21e-01 | 0.1122 |
| 9766 | SUSD6 | P15T-E | Human | Esophagus | ESCC | 3.55e-23 | 3.93e-01 | 0.1149 |
| 9766 | SUSD6 | P16T-E | Human | Esophagus | ESCC | 2.25e-19 | 1.27e-01 | 0.1153 |
| 9766 | SUSD6 | P17T-E | Human | Esophagus | ESCC | 6.55e-06 | 6.12e-02 | 0.1278 |
| 9766 | SUSD6 | P20T-E | Human | Esophagus | ESCC | 9.62e-10 | 8.46e-02 | 0.1124 |
| 9766 | SUSD6 | P21T-E | Human | Esophagus | ESCC | 7.97e-19 | 1.67e-01 | 0.1617 |
| Page: 1 2 3 4 |
| Tissue | Expression Dynamics | Abbreviation |
| Esophagus | 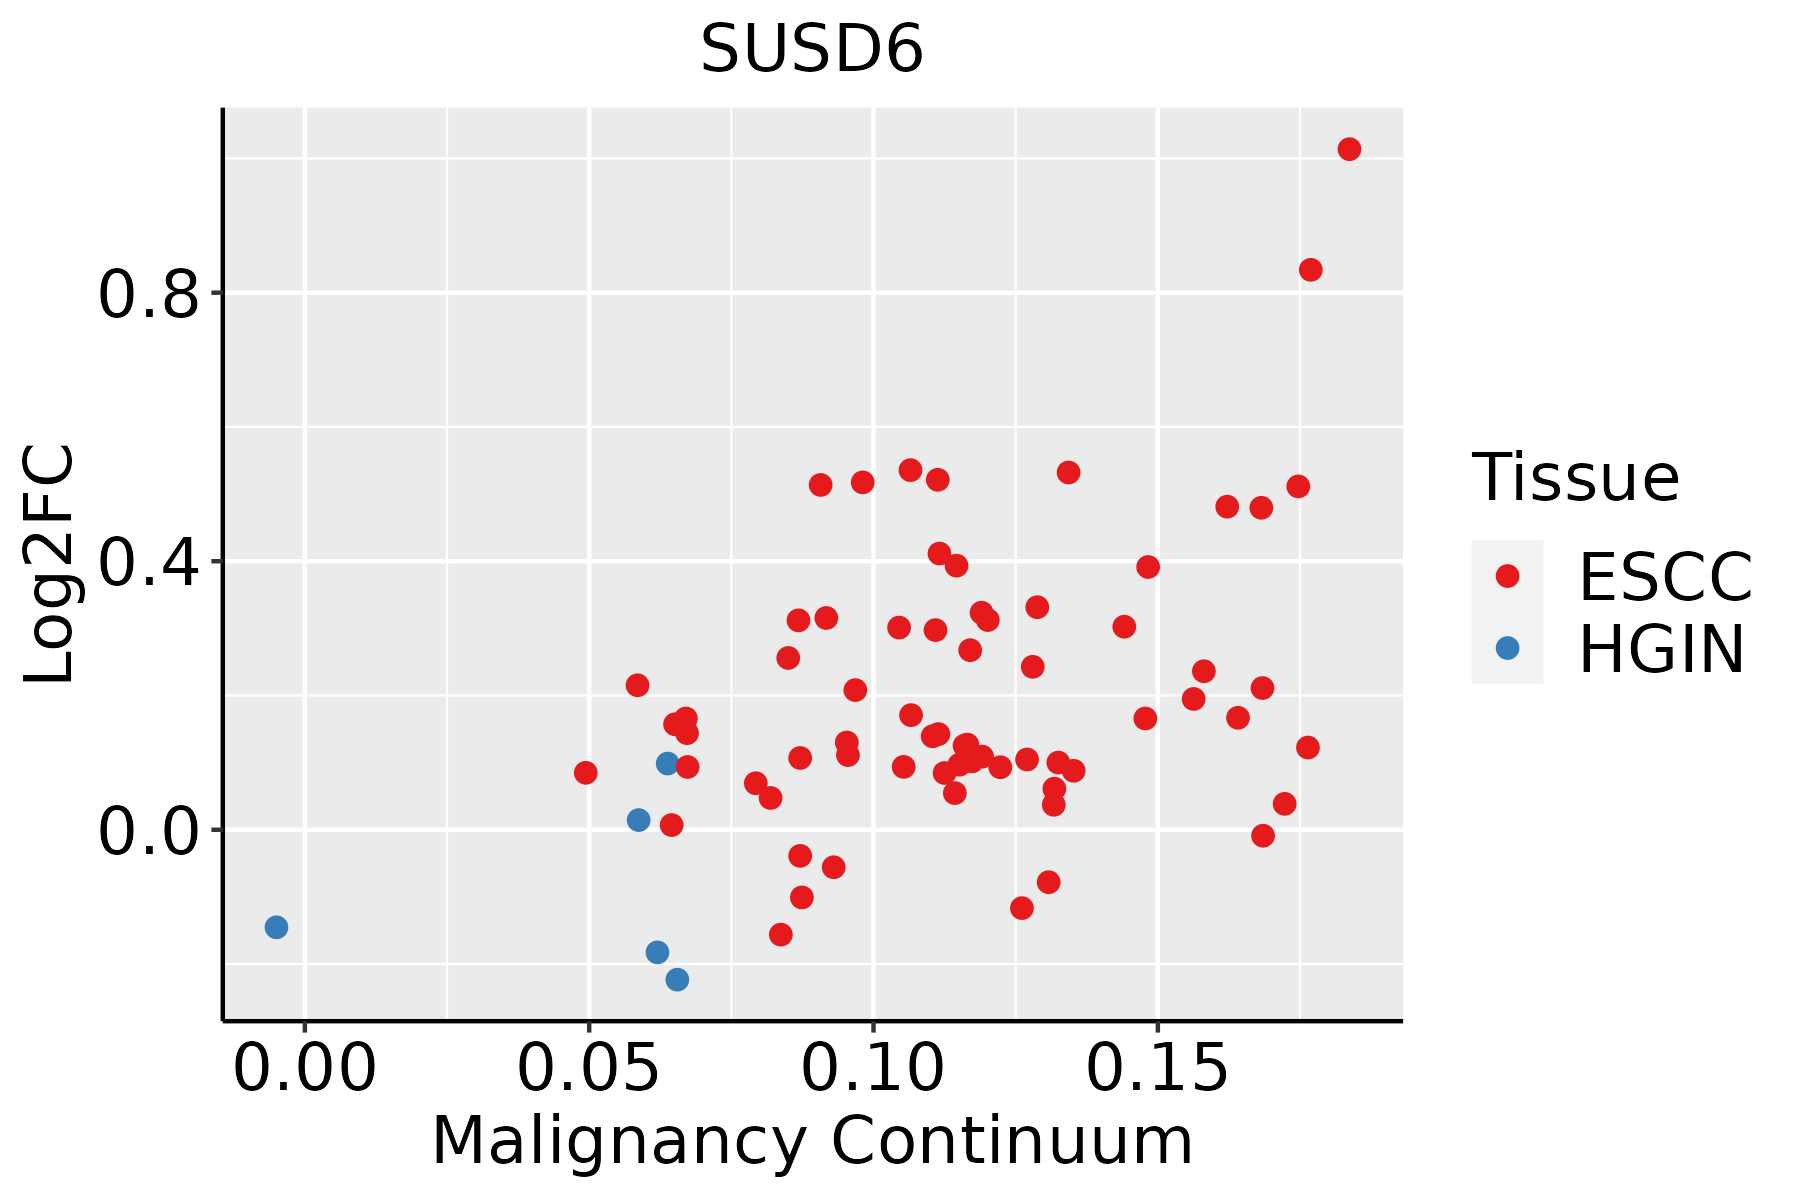 | ESCC: Esophageal squamous cell carcinoma |
| HGIN: High-grade intraepithelial neoplasias | ||
| LGIN: Low-grade intraepithelial neoplasias | ||
| Thyroid | 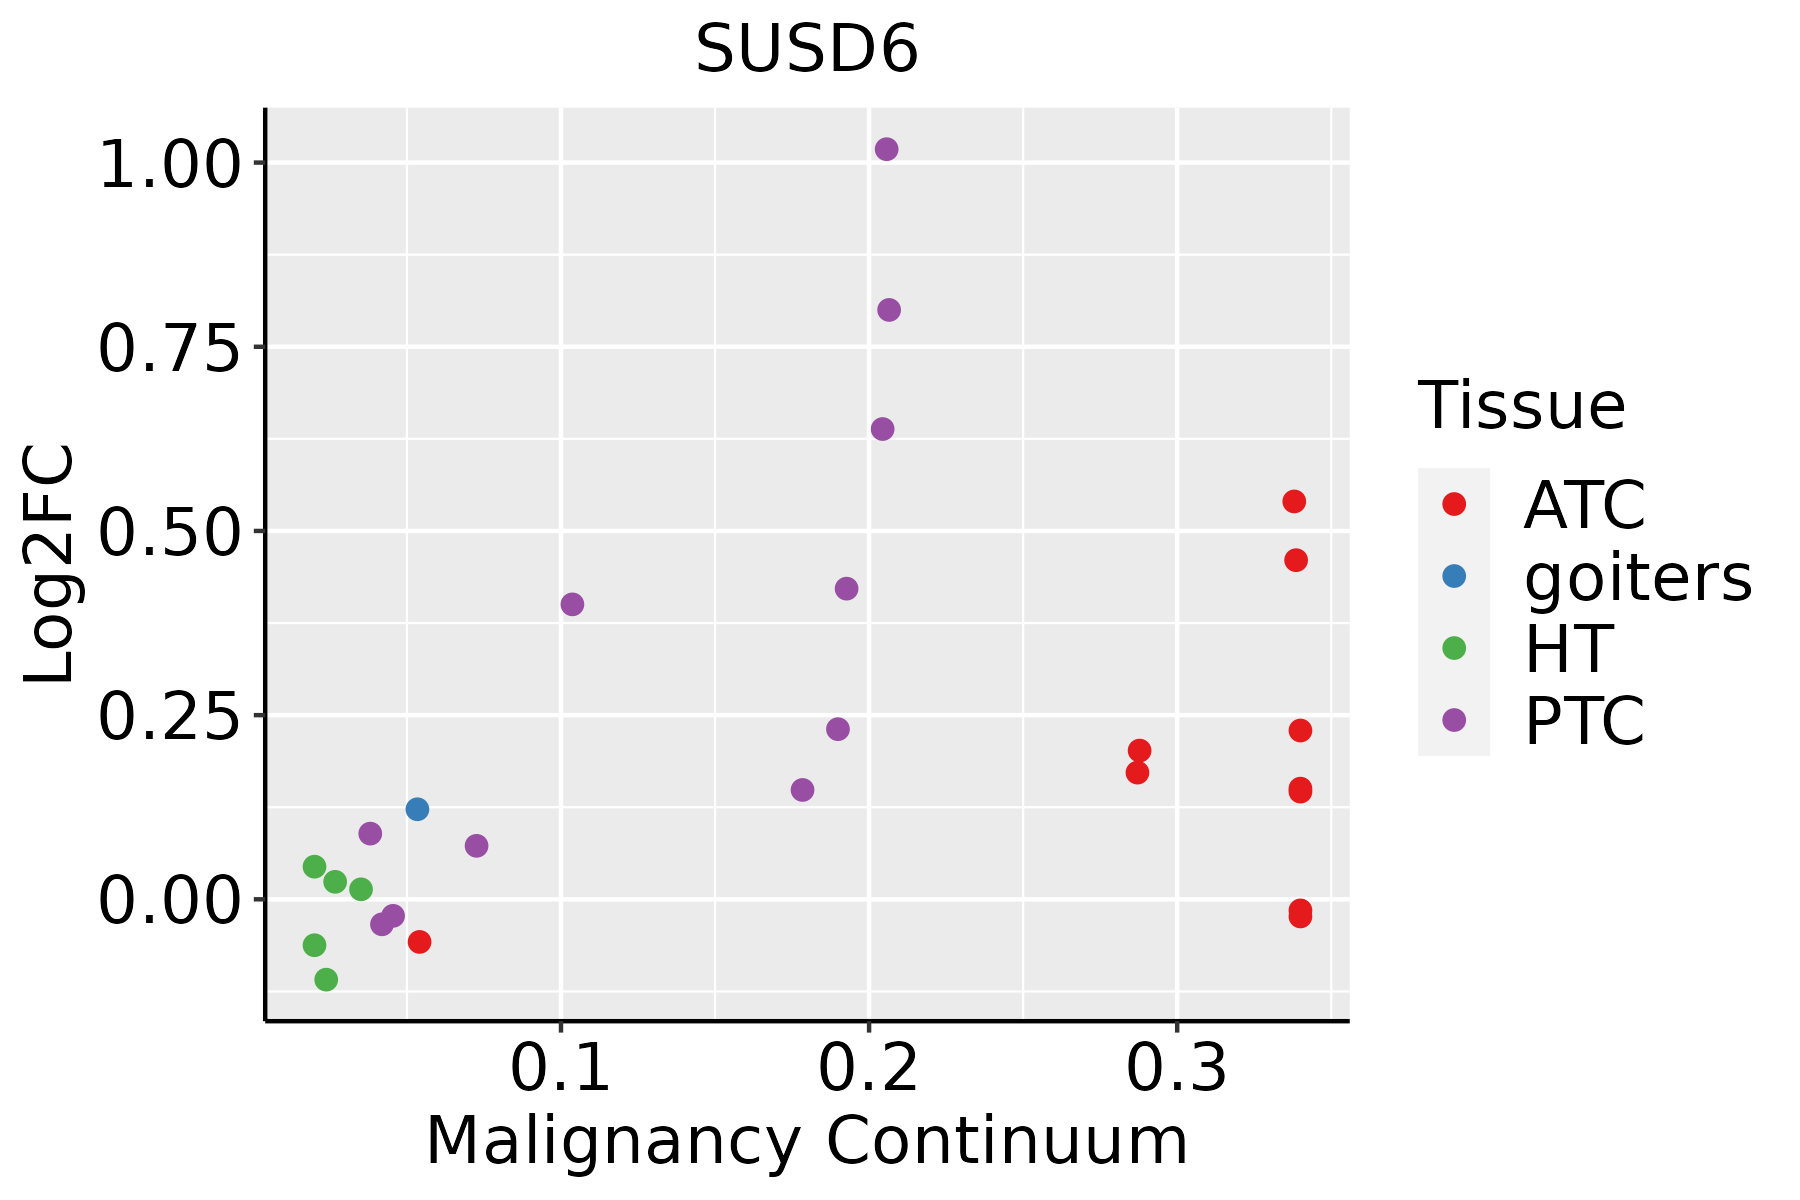 | ATC: Anaplastic thyroid cancer |
| HT: Hashimoto's thyroiditis | ||
| PTC: Papillary thyroid cancer |
| ∗log2FC in expression of this searched gene in stem-like cells from each diseased tissue sample relative to stem-like cells in normal samples in each tissue plotted against the malignancy continuum. Samples are colored based on if they are from different disease stage. |
Top |
Malignant transformation related pathway analysis |
| Find out the enriched GO biological processes and KEGG pathways involved in transition from healthy to precancer to cancer |
| Tissue | Disease Stage | Enriched GO biological Processes |
| Colorectum | AD |  |
| Colorectum | SER |  |
| Colorectum | MSS |  |
| Colorectum | MSI-H |  |
| Colorectum | FAP |  |
| ∗Top 15 enriched GO BP terms are showed in the bar plot of each disease state in each tissue. Each row represents a significant GO biological process which is colored according to the -log10(p.adjust). |
| Page: 1 2 3 4 5 6 7 8 9 |
| GO ID | Tissue | Disease Stage | Description | Gene Ratio | Bg Ratio | pvalue | p.adjust | Count |
| Page: 1 |
| Pathway ID | Tissue | Disease Stage | Description | Gene Ratio | Bg Ratio | pvalue | p.adjust | qvalue | Count |
| Page: 1 |
Top |
Cell-cell communication analysis |
| Identification of potential cell-cell interactions between two cell types and their ligand-receptor pairs for different disease states |
| Ligand | Receptor | LRpair | Pathway | Tissue | Disease Stage |
| Page: 1 |
Top |
Single-cell gene regulatory network inference analysis |
| Find out the significant the regulons (TFs) and the target genes of each regulon across cell types for different disease states |
| TF | Cell Type | Tissue | Disease Stage | Target Gene | RSS | Regulon Activity |
| ∗The dot plots of a searched regulon are shown for all cell subpopulations in each disease state of each tissue based on the regulon specific score inferred using pySCENIC and by calculating the average expression. |
| Page: 1 |
Top |
Somatic mutation of malignant transformation related genes |
| Annotation of somatic variants for genes involved in malignant transformation |
| Hugo Symbol | Variant Class | Variant Classification | dbSNP RS | HGVSc | HGVSp | HGVSp Short | SWISSPROT | BIOTYPE | SIFT | PolyPhen | Tumor Sample Barcode | Tissue | Histology | Sex | Age | Stage | Therapy Types | Drugs | Outcome |
| SUSD6 | SNV | Missense_Mutation | novel | c.167N>C | p.His56Pro | p.H56P | Q92537 | protein_coding | deleterious(0) | probably_damaging(0.999) | TCGA-AA-A02F-01 | Colorectum | colon adenocarcinoma | Female | >=65 | III/IV | Chemotherapy | folinic | PR |
| SUSD6 | SNV | Missense_Mutation | c.35N>T | p.Ser12Leu | p.S12L | Q92537 | protein_coding | deleterious_low_confidence(0.01) | benign(0.039) | TCGA-AD-6548-01 | Colorectum | colon adenocarcinoma | Female | >=65 | I/II | Unknown | Unknown | SD | |
| SUSD6 | deletion | Frame_Shift_Del | c.168delN | p.Arg58GlyfsTer7 | p.R58Gfs*7 | Q92537 | protein_coding | TCGA-CM-6162-01 | Colorectum | colon adenocarcinoma | Female | <65 | III/IV | Chemotherapy | oxaliplatin | SD | |||
| SUSD6 | insertion | Frame_Shift_Ins | novel | c.125_126insC | p.Leu44ProfsTer33 | p.L44Pfs*33 | Q92537 | protein_coding | TCGA-F4-6570-01 | Colorectum | colon adenocarcinoma | Female | >=65 | I/II | Unknown | Unknown | SD | ||
| SUSD6 | SNV | Missense_Mutation | novel | c.505G>A | p.Gly169Arg | p.G169R | Q92537 | protein_coding | deleterious(0) | possibly_damaging(0.724) | TCGA-A5-A1OF-01 | Endometrium | uterine corpus endometrioid carcinoma | Female | <65 | I/II | Unknown | Unknown | SD |
| SUSD6 | SNV | Missense_Mutation | novel | c.147N>T | p.Glu49Asp | p.E49D | Q92537 | protein_coding | deleterious(0.05) | probably_damaging(0.998) | TCGA-AP-A059-01 | Endometrium | uterine corpus endometrioid carcinoma | Female | >=65 | I/II | Unknown | Unknown | SD |
| SUSD6 | SNV | Missense_Mutation | rs773062109 | c.263N>T | p.Thr88Met | p.T88M | Q92537 | protein_coding | deleterious(0) | probably_damaging(1) | TCGA-AP-A0LM-01 | Endometrium | uterine corpus endometrioid carcinoma | Female | <65 | III/IV | Chemotherapy | cisplatin | SD |
| SUSD6 | SNV | Missense_Mutation | c.182N>C | p.Arg61Thr | p.R61T | Q92537 | protein_coding | tolerated(0.17) | benign(0.054) | TCGA-AX-A0IW-01 | Endometrium | uterine corpus endometrioid carcinoma | Female | >=65 | III/IV | Unspecific | Carboplatin & Paclitaxel | SD | |
| SUSD6 | SNV | Missense_Mutation | novel | c.554N>T | p.Ser185Phe | p.S185F | Q92537 | protein_coding | deleterious(0.05) | benign(0.36) | TCGA-D1-A103-01 | Endometrium | uterine corpus endometrioid carcinoma | Female | >=65 | I/II | Unknown | Unknown | SD |
| SUSD6 | SNV | Missense_Mutation | novel | c.250N>C | p.Tyr84His | p.Y84H | Q92537 | protein_coding | deleterious(0) | probably_damaging(0.999) | TCGA-DF-A2KN-01 | Endometrium | uterine corpus endometrioid carcinoma | Female | Unknown | I/II | Unknown | Unknown | SD |
| Page: 1 2 3 |
Top |
Related drugs of malignant transformation related genes |
| Identification of chemicals and drugs interact with genes involved in malignant transfromation |
| (DGIdb 4.0) |
| Entrez ID | Symbol | Category | Interaction Types | Drug Claim Name | Drug Name | PMIDs |
| Page: 1 |

Copyright 2023-Present -The University of Texas Health Science Center at Houston |