
|
|||||
|
 | |
| |
| |
| |
| |
| |
|
Gene: SUSD3 |
Gene summary for SUSD3 |
| Gene information | Species | Human | Gene symbol | SUSD3 | Gene ID | 203328 |
| Gene name | sushi domain containing 3 | |
| Gene Alias | SUSD3 | |
| Cytomap | 9q22.31 | |
| Gene Type | protein-coding | GO ID | GO:0005575 | UniProtAcc | Q96L08 |
Top |
Malignant transformation analysis |
| Identification of the aberrant gene expression in precancerous and cancerous lesions by comparing the gene expression of stem-like cells in diseased tissues with normal stem cells |
| Entrez ID | Symbol | Replicates | Species | Organ | Tissue | Adj P-value | Log2FC | Malignancy |
| 203328 | SUSD3 | GSM4909298 | Human | Breast | IDC | 4.01e-02 | 1.38e-01 | 0.1551 |
| 203328 | SUSD3 | GSM4909302 | Human | Breast | IDC | 7.75e-21 | 5.44e-01 | 0.1545 |
| 203328 | SUSD3 | GSM4909304 | Human | Breast | IDC | 1.03e-68 | 1.01e+00 | 0.1636 |
| 203328 | SUSD3 | GSM4909305 | Human | Breast | IDC | 6.16e-11 | 3.93e-01 | 0.0436 |
| 203328 | SUSD3 | GSM4909306 | Human | Breast | IDC | 4.69e-56 | 1.02e+00 | 0.1564 |
| 203328 | SUSD3 | GSM4909307 | Human | Breast | IDC | 5.97e-06 | 2.87e-01 | 0.1569 |
| 203328 | SUSD3 | GSM4909308 | Human | Breast | IDC | 2.72e-05 | 2.22e-01 | 0.158 |
| 203328 | SUSD3 | GSM4909317 | Human | Breast | IDC | 2.17e-12 | 3.52e-01 | 0.1355 |
| 203328 | SUSD3 | NCCBC11 | Human | Breast | DCIS | 1.16e-05 | 5.37e-01 | 0.1232 |
| 203328 | SUSD3 | NCCBC3 | Human | Breast | DCIS | 2.78e-03 | 2.84e-01 | 0.1198 |
| 203328 | SUSD3 | HCC1_Meng | Human | Liver | HCC | 5.41e-36 | 7.50e-02 | 0.0246 |
| 203328 | SUSD3 | S014 | Human | Liver | HCC | 3.65e-22 | 7.58e-01 | 0.2254 |
| 203328 | SUSD3 | S015 | Human | Liver | HCC | 1.99e-18 | 9.56e-01 | 0.2375 |
| 203328 | SUSD3 | S016 | Human | Liver | HCC | 3.52e-22 | 7.50e-01 | 0.2243 |
| 203328 | SUSD3 | S027 | Human | Liver | HCC | 1.20e-15 | 9.76e-01 | 0.2446 |
| 203328 | SUSD3 | S028 | Human | Liver | HCC | 2.97e-25 | 9.40e-01 | 0.2503 |
| 203328 | SUSD3 | S029 | Human | Liver | HCC | 1.23e-27 | 1.34e+00 | 0.2581 |
| Page: 1 |
| Tissue | Expression Dynamics | Abbreviation |
| Breast | 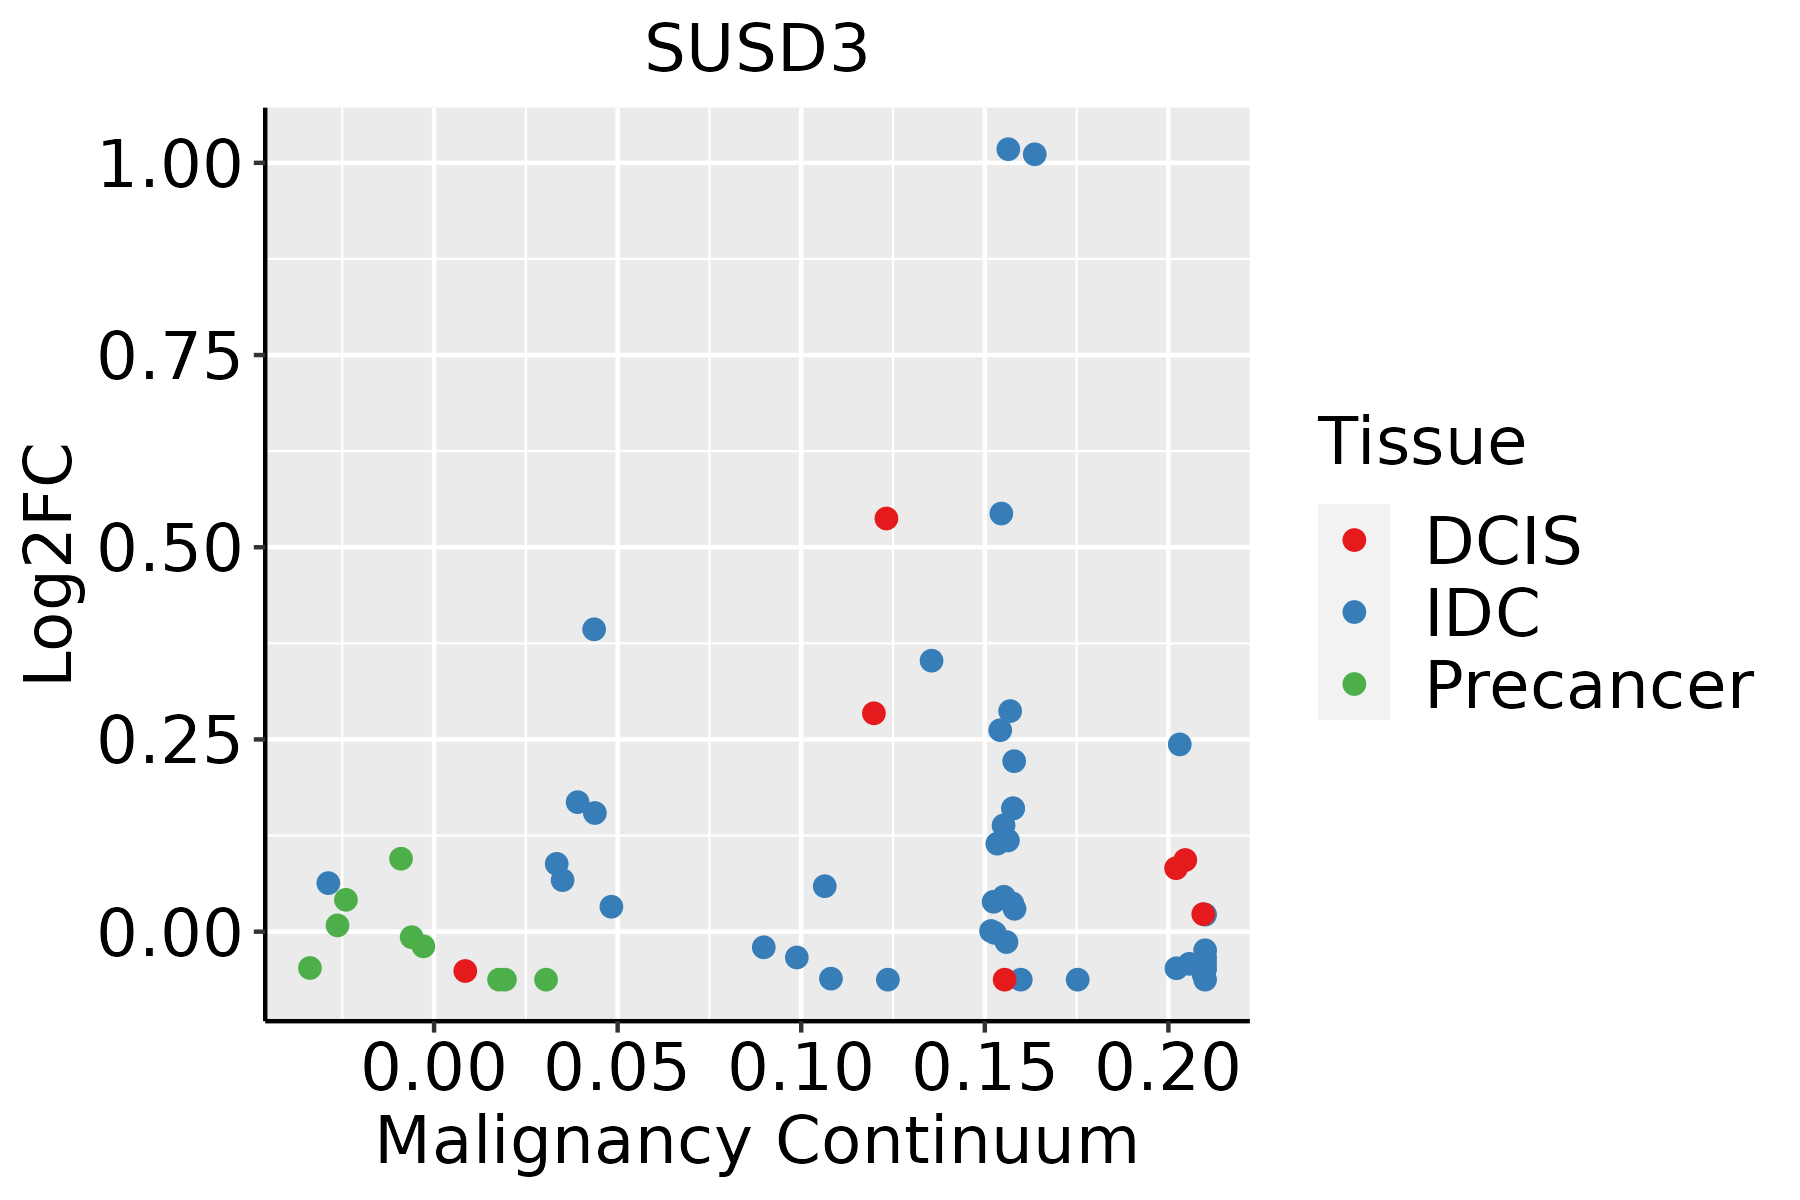 | IDC: Invasive ductal carcinoma |
| DCIS: Ductal carcinoma in situ | ||
| Precancer(BRCA1-mut): Precancerous lesion from BRCA1 mutation carriers | ||
| Liver | 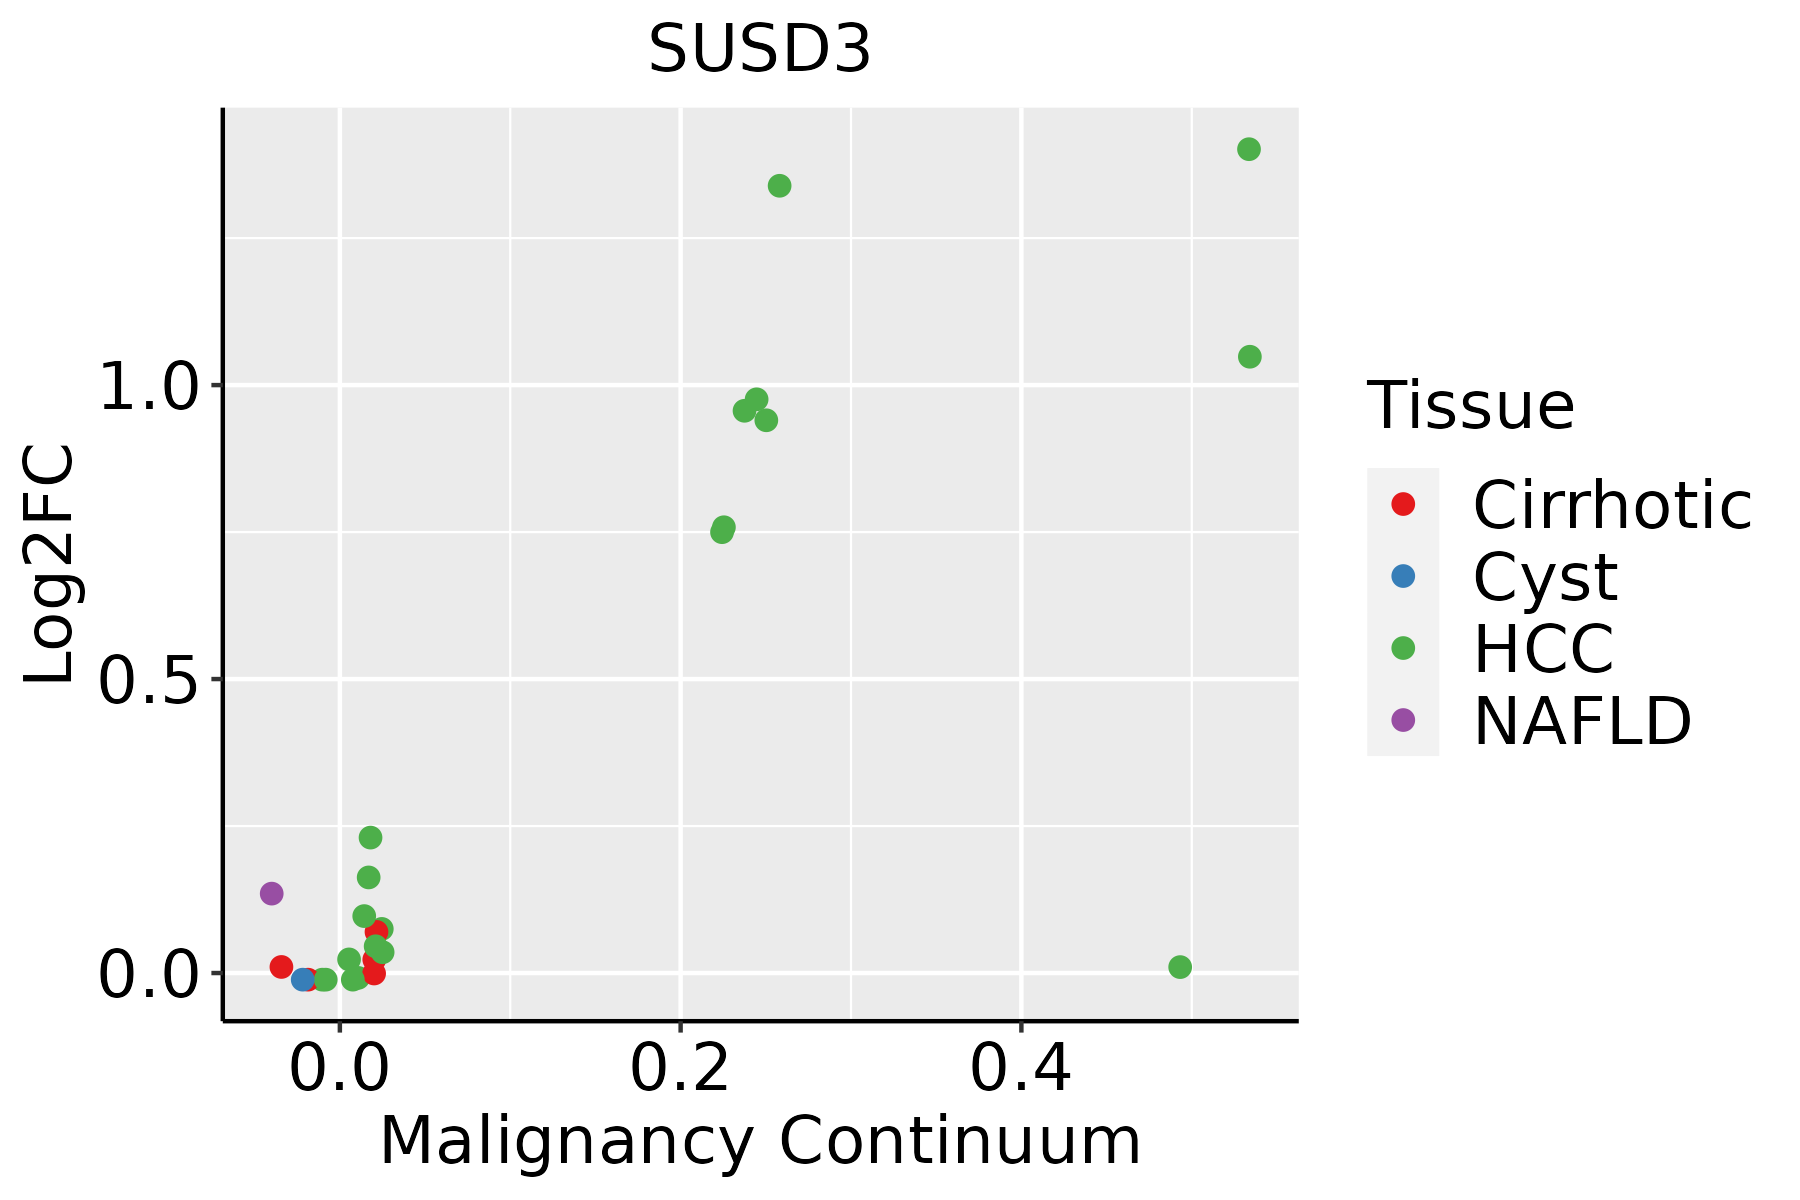 | HCC: Hepatocellular carcinoma |
| NAFLD: Non-alcoholic fatty liver disease |
| ∗log2FC in expression of this searched gene in stem-like cells from each diseased tissue sample relative to stem-like cells in normal samples in each tissue plotted against the malignancy continuum. Samples are colored based on if they are from different disease stage. |
Top |
Malignant transformation related pathway analysis |
| Find out the enriched GO biological processes and KEGG pathways involved in transition from healthy to precancer to cancer |
| Tissue | Disease Stage | Enriched GO biological Processes |
| Colorectum | AD |  |
| Colorectum | SER |  |
| Colorectum | MSS |  |
| Colorectum | MSI-H |  |
| Colorectum | FAP |  |
| ∗Top 15 enriched GO BP terms are showed in the bar plot of each disease state in each tissue. Each row represents a significant GO biological process which is colored according to the -log10(p.adjust). |
| Page: 1 2 3 4 5 6 7 8 9 |
| GO ID | Tissue | Disease Stage | Description | Gene Ratio | Bg Ratio | pvalue | p.adjust | Count |
| Page: 1 |
| Pathway ID | Tissue | Disease Stage | Description | Gene Ratio | Bg Ratio | pvalue | p.adjust | qvalue | Count |
| Page: 1 |
Top |
Cell-cell communication analysis |
| Identification of potential cell-cell interactions between two cell types and their ligand-receptor pairs for different disease states |
| Ligand | Receptor | LRpair | Pathway | Tissue | Disease Stage |
| Page: 1 |
Top |
Single-cell gene regulatory network inference analysis |
| Find out the significant the regulons (TFs) and the target genes of each regulon across cell types for different disease states |
| TF | Cell Type | Tissue | Disease Stage | Target Gene | RSS | Regulon Activity |
| ∗The dot plots of a searched regulon are shown for all cell subpopulations in each disease state of each tissue based on the regulon specific score inferred using pySCENIC and by calculating the average expression. |
| Page: 1 |
Top |
Somatic mutation of malignant transformation related genes |
| Annotation of somatic variants for genes involved in malignant transformation |
| Hugo Symbol | Variant Class | Variant Classification | dbSNP RS | HGVSc | HGVSp | HGVSp Short | SWISSPROT | BIOTYPE | SIFT | PolyPhen | Tumor Sample Barcode | Tissue | Histology | Sex | Age | Stage | Therapy Types | Drugs | Outcome |
| SUSD3 | SNV | Missense_Mutation | c.247G>C | p.Glu83Gln | p.E83Q | Q96L08 | protein_coding | tolerated(0.84) | benign(0.033) | TCGA-IR-A3LK-01 | Cervix | cervical & endocervical cancer | Female | >=65 | I/II | Chemotherapy | cisplatin | PD | |
| SUSD3 | SNV | Missense_Mutation | novel | c.377N>T | p.Cys126Phe | p.C126F | Q96L08 | protein_coding | deleterious(0) | probably_damaging(0.927) | TCGA-5M-AAT4-01 | Colorectum | colon adenocarcinoma | Male | >=65 | III/IV | Unknown | Unknown | PD |
| SUSD3 | SNV | Missense_Mutation | rs181899524 | c.470C>T | p.Thr157Met | p.T157M | Q96L08 | protein_coding | deleterious(0.04) | probably_damaging(0.983) | TCGA-AA-A022-01 | Colorectum | colon adenocarcinoma | Female | >=65 | I/II | Unknown | Unknown | SD |
| SUSD3 | SNV | Missense_Mutation | c.718N>T | p.Gly240Trp | p.G240W | Q96L08 | protein_coding | tolerated_low_confidence(0.28) | benign(0.011) | TCGA-DM-A1DA-01 | Colorectum | colon adenocarcinoma | Female | >=65 | III/IV | Unknown | Unknown | SD | |
| SUSD3 | SNV | Missense_Mutation | c.413G>A | p.Arg138Gln | p.R138Q | Q96L08 | protein_coding | tolerated(0.14) | benign(0.024) | TCGA-WS-AB45-01 | Colorectum | colon adenocarcinoma | Female | <65 | I/II | Unknown | Unknown | SD | |
| SUSD3 | SNV | Missense_Mutation | novel | c.145N>C | p.Asn49His | p.N49H | Q96L08 | protein_coding | deleterious(0) | possibly_damaging(0.814) | TCGA-AG-3878-01 | Colorectum | rectum adenocarcinoma | Male | <65 | I/II | Unknown | Unknown | SD |
| SUSD3 | SNV | Missense_Mutation | rs542380364 | c.97N>A | p.Ala33Thr | p.A33T | Q96L08 | protein_coding | tolerated(0.55) | benign(0.023) | TCGA-A5-A0G2-01 | Endometrium | uterine corpus endometrioid carcinoma | Female | <65 | III/IV | Unknown | Unknown | SD |
| SUSD3 | SNV | Missense_Mutation | novel | c.263N>T | p.Ser88Phe | p.S88F | Q96L08 | protein_coding | deleterious(0.01) | benign(0.397) | TCGA-A5-A0G2-01 | Endometrium | uterine corpus endometrioid carcinoma | Female | <65 | III/IV | Unknown | Unknown | SD |
| SUSD3 | SNV | Missense_Mutation | novel | c.678N>A | p.Met226Ile | p.M226I | Q96L08 | protein_coding | deleterious(0.04) | benign(0.006) | TCGA-A5-A0G2-01 | Endometrium | uterine corpus endometrioid carcinoma | Female | <65 | III/IV | Unknown | Unknown | SD |
| SUSD3 | SNV | Missense_Mutation | rs748162246 | c.611N>G | p.Lys204Arg | p.K204R | Q96L08 | protein_coding | deleterious(0.01) | possibly_damaging(0.808) | TCGA-AP-A1DK-01 | Endometrium | uterine corpus endometrioid carcinoma | Female | <65 | I/II | Unknown | Unknown | SD |
| Page: 1 2 3 |
Top |
Related drugs of malignant transformation related genes |
| Identification of chemicals and drugs interact with genes involved in malignant transfromation |
| (DGIdb 4.0) |
| Entrez ID | Symbol | Category | Interaction Types | Drug Claim Name | Drug Name | PMIDs |
| Page: 1 |

Copyright 2023-Present -The University of Texas Health Science Center at Houston |