
|
|||||
|
 | |
| |
| |
| |
| |
| |
|
Gene: SUSD2 |
Gene summary for SUSD2 |
| Gene information | Species | Human | Gene symbol | SUSD2 | Gene ID | 56241 |
| Gene name | sushi domain containing 2 | |
| Gene Alias | BK65A6.2 | |
| Cytomap | 22q11.23 | |
| Gene Type | protein-coding | GO ID | GO:0007049 | UniProtAcc | A0A140VJW3 |
Top |
Malignant transformation analysis |
| Identification of the aberrant gene expression in precancerous and cancerous lesions by comparing the gene expression of stem-like cells in diseased tissues with normal stem cells |
| Entrez ID | Symbol | Replicates | Species | Organ | Tissue | Adj P-value | Log2FC | Malignancy |
| 56241 | SUSD2 | TD9 | Human | Lung | IAC | 3.48e-05 | -6.88e-01 | 0.088 |
| 56241 | SUSD2 | RNA-P10T2-P10T2-3 | Human | Lung | AAH | 2.51e-02 | -1.58e-01 | -0.1408 |
| 56241 | SUSD2 | RNA-P25T1-P25T1-1 | Human | Lung | AIS | 9.04e-14 | -9.78e-02 | -0.2116 |
| 56241 | SUSD2 | RNA-P25T1-P25T1-2 | Human | Lung | AIS | 3.35e-04 | -4.14e-01 | -0.1941 |
| 56241 | SUSD2 | RNA-P25T1-P25T1-3 | Human | Lung | AIS | 6.32e-06 | -1.55e-01 | -0.2107 |
| 56241 | SUSD2 | RNA-P25T1-P25T1-4 | Human | Lung | AIS | 4.11e-08 | -2.76e-01 | -0.2119 |
| 56241 | SUSD2 | RNA-P3T-P3T-1 | Human | Lung | IAC | 1.11e-04 | -4.92e-01 | 0.1829 |
| 56241 | SUSD2 | RNA-P3T-P3T-2 | Human | Lung | IAC | 7.65e-05 | -6.52e-01 | 0.1835 |
| 56241 | SUSD2 | RNA-P3T-P3T-4 | Human | Lung | IAC | 8.87e-07 | -5.23e-01 | 0.1859 |
| 56241 | SUSD2 | RNA-P6T1-P6T1-1 | Human | Lung | MIAC | 6.01e-04 | -3.87e-01 | -0.0238 |
| 56241 | SUSD2 | RNA-P6T1-P6T1-2 | Human | Lung | MIAC | 2.25e-03 | -3.88e-01 | -0.0186 |
| 56241 | SUSD2 | RNA-P6T2-P6T2-1 | Human | Lung | IAC | 2.34e-13 | -4.18e-01 | -0.0166 |
| 56241 | SUSD2 | RNA-P6T2-P6T2-2 | Human | Lung | IAC | 2.87e-21 | -3.88e-01 | -0.0132 |
| 56241 | SUSD2 | RNA-P6T2-P6T2-3 | Human | Lung | IAC | 3.16e-25 | -3.63e-01 | -0.013 |
| 56241 | SUSD2 | RNA-P6T2-P6T2-4 | Human | Lung | IAC | 2.42e-15 | -5.44e-01 | -0.0121 |
| 56241 | SUSD2 | RNA-P7T1-P7T1-1 | Human | Lung | AIS | 7.61e-10 | 1.04e-04 | -0.0961 |
| 56241 | SUSD2 | RNA-P7T1-P7T1-2 | Human | Lung | AIS | 6.12e-06 | -1.86e-01 | -0.0876 |
| 56241 | SUSD2 | RNA-P7T1-P7T1-3 | Human | Lung | AIS | 6.79e-04 | -2.60e-01 | -0.0822 |
| 56241 | SUSD2 | RNA-P7T1-P7T1-4 | Human | Lung | AIS | 4.74e-06 | -5.21e-02 | -0.0809 |
| Page: 1 |
| Tissue | Expression Dynamics | Abbreviation |
| Lung | 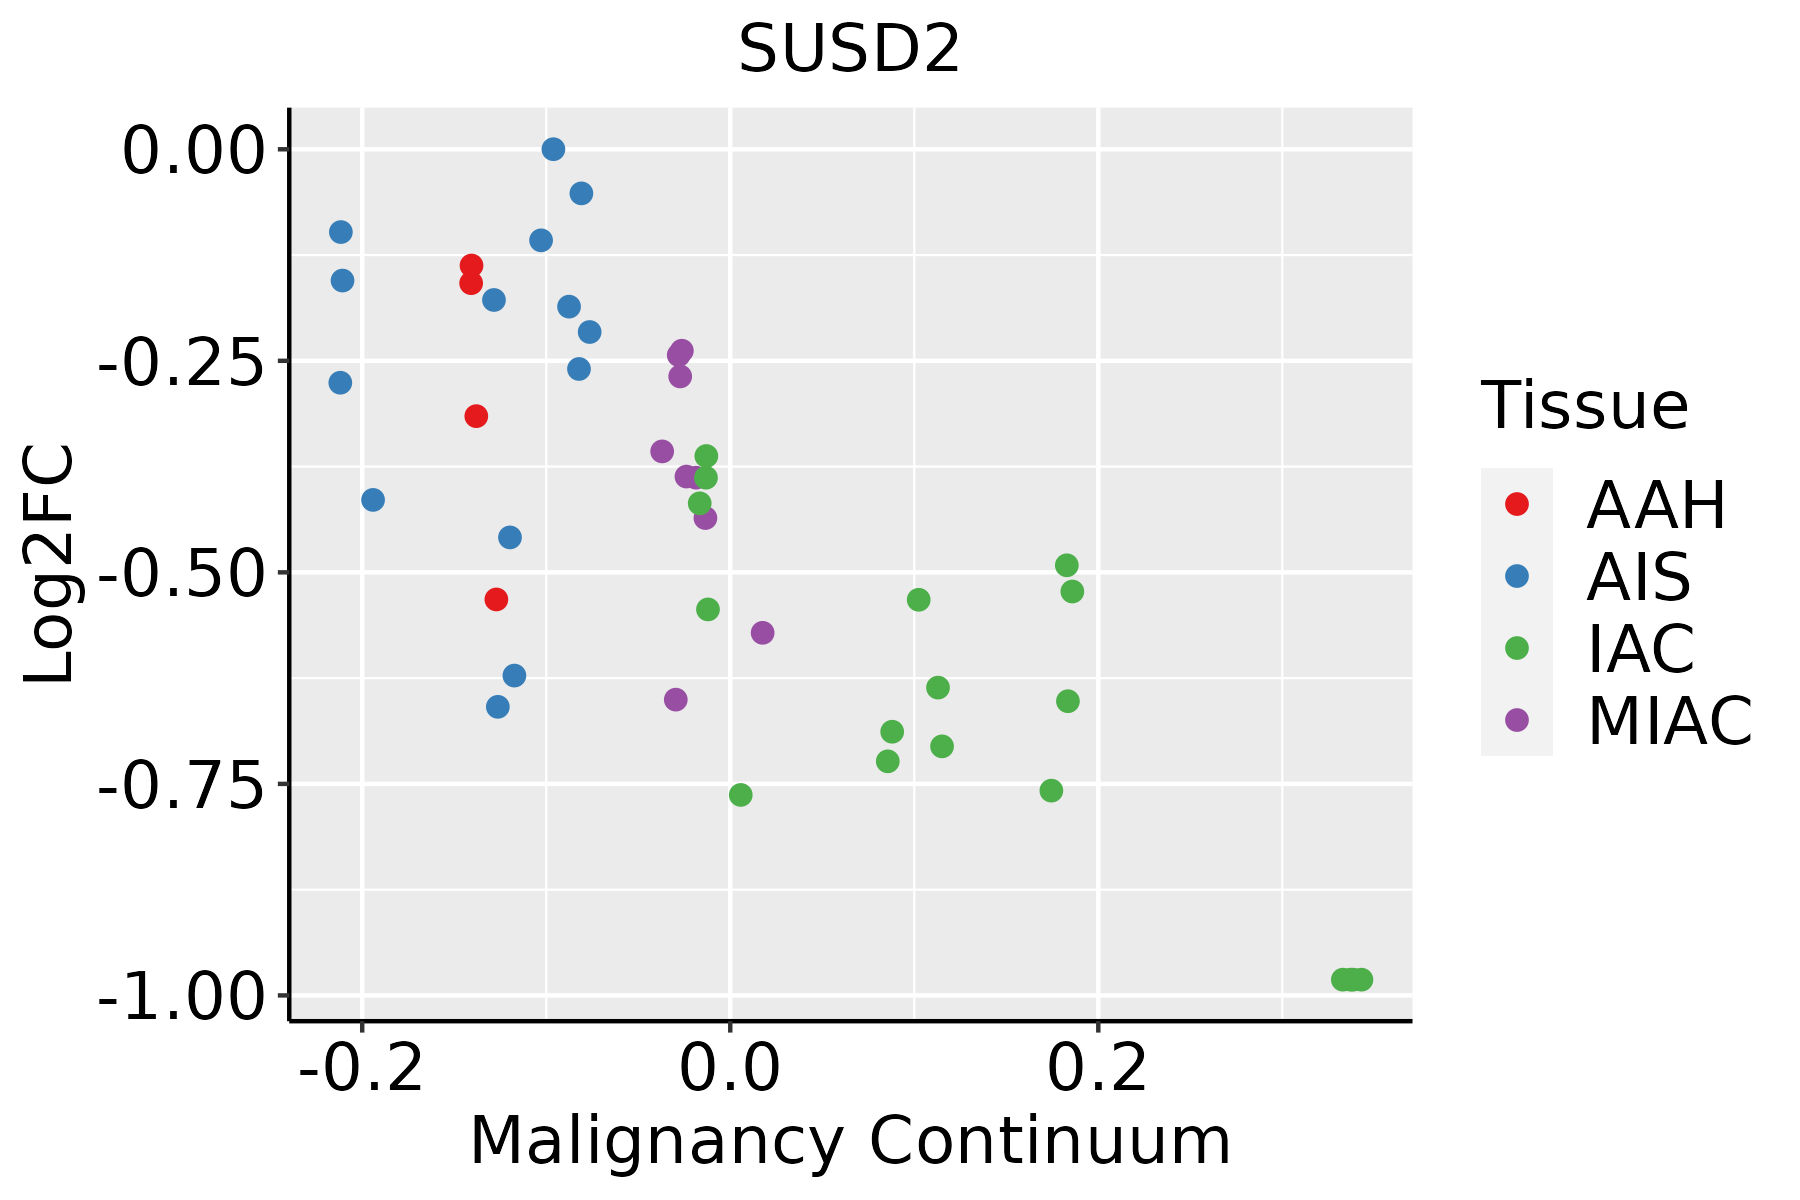 | AAH: Atypical adenomatous hyperplasia |
| AIS: Adenocarcinoma in situ | ||
| IAC: Invasive lung adenocarcinoma | ||
| MIA: Minimally invasive adenocarcinoma |
| ∗log2FC in expression of this searched gene in stem-like cells from each diseased tissue sample relative to stem-like cells in normal samples in each tissue plotted against the malignancy continuum. Samples are colored based on if they are from different disease stage. |
Top |
Malignant transformation related pathway analysis |
| Find out the enriched GO biological processes and KEGG pathways involved in transition from healthy to precancer to cancer |
| Tissue | Disease Stage | Enriched GO biological Processes |
| Colorectum | AD |  |
| Colorectum | SER |  |
| Colorectum | MSS |  |
| Colorectum | MSI-H |  |
| Colorectum | FAP |  |
| ∗Top 15 enriched GO BP terms are showed in the bar plot of each disease state in each tissue. Each row represents a significant GO biological process which is colored according to the -log10(p.adjust). |
| Page: 1 2 3 4 5 6 7 8 9 |
| GO ID | Tissue | Disease Stage | Description | Gene Ratio | Bg Ratio | pvalue | p.adjust | Count |
| GO:00448433 | Lung | IAC | cell cycle G1/S phase transition | 49/2061 | 241/18723 | 1.54e-05 | 4.49e-04 | 49 |
| GO:19019872 | Lung | IAC | regulation of cell cycle phase transition | 69/2061 | 390/18723 | 4.55e-05 | 1.06e-03 | 69 |
| GO:00457861 | Lung | IAC | negative regulation of cell cycle | 67/2061 | 385/18723 | 9.74e-05 | 1.93e-03 | 67 |
| GO:19019881 | Lung | IAC | negative regulation of cell cycle phase transition | 47/2061 | 249/18723 | 1.53e-04 | 2.80e-03 | 47 |
| GO:00109481 | Lung | IAC | negative regulation of cell cycle process | 53/2061 | 294/18723 | 2.05e-04 | 3.58e-03 | 53 |
| GO:1902807 | Lung | IAC | negative regulation of cell cycle G1/S phase transition | 21/2061 | 93/18723 | 9.98e-04 | 1.19e-02 | 21 |
| GO:19028061 | Lung | IAC | regulation of cell cycle G1/S phase transition | 32/2061 | 168/18723 | 1.38e-03 | 1.53e-02 | 32 |
| GO:004484311 | Lung | AIS | cell cycle G1/S phase transition | 40/1849 | 241/18723 | 7.43e-04 | 1.07e-02 | 40 |
| GO:0051302 | Lung | MIAC | regulation of cell division | 20/967 | 177/18723 | 8.41e-04 | 1.83e-02 | 20 |
| GO:190198711 | Lung | MIAC | regulation of cell cycle phase transition | 33/967 | 390/18723 | 3.79e-03 | 4.68e-02 | 33 |
| Page: 1 |
| Pathway ID | Tissue | Disease Stage | Description | Gene Ratio | Bg Ratio | pvalue | p.adjust | qvalue | Count |
| Page: 1 |
Top |
Cell-cell communication analysis |
| Identification of potential cell-cell interactions between two cell types and their ligand-receptor pairs for different disease states |
| Ligand | Receptor | LRpair | Pathway | Tissue | Disease Stage |
| Page: 1 |
Top |
Single-cell gene regulatory network inference analysis |
| Find out the significant the regulons (TFs) and the target genes of each regulon across cell types for different disease states |
| TF | Cell Type | Tissue | Disease Stage | Target Gene | RSS | Regulon Activity |
| ∗The dot plots of a searched regulon are shown for all cell subpopulations in each disease state of each tissue based on the regulon specific score inferred using pySCENIC and by calculating the average expression. |
| Page: 1 |
Top |
Somatic mutation of malignant transformation related genes |
| Annotation of somatic variants for genes involved in malignant transformation |
| Hugo Symbol | Variant Class | Variant Classification | dbSNP RS | HGVSc | HGVSp | HGVSp Short | SWISSPROT | BIOTYPE | SIFT | PolyPhen | Tumor Sample Barcode | Tissue | Histology | Sex | Age | Stage | Therapy Types | Drugs | Outcome |
| SUSD2 | SNV | Missense_Mutation | novel | c.1097N>A | p.Cys366Tyr | p.C366Y | Q9UGT4 | protein_coding | deleterious(0) | probably_damaging(0.999) | TCGA-A2-A0D2-01 | Breast | breast invasive carcinoma | Female | <65 | I/II | Chemotherapy | adriamycin | SD |
| SUSD2 | SNV | Missense_Mutation | c.2032N>C | p.Glu678Gln | p.E678Q | Q9UGT4 | protein_coding | tolerated(0.36) | possibly_damaging(0.598) | TCGA-A2-A0YK-01 | Breast | breast invasive carcinoma | Female | <65 | I/II | Chemotherapy | cytoxan | SD | |
| SUSD2 | SNV | Missense_Mutation | c.1867N>C | p.Glu623Gln | p.E623Q | Q9UGT4 | protein_coding | tolerated(0.68) | benign(0.003) | TCGA-AC-A23H-01 | Breast | breast invasive carcinoma | Female | >=65 | I/II | Unknown | Unknown | PD | |
| SUSD2 | SNV | Missense_Mutation | rs201113554 | c.1666G>A | p.Gly556Arg | p.G556R | Q9UGT4 | protein_coding | tolerated(0.45) | benign(0.023) | TCGA-BH-A0BP-01 | Breast | breast invasive carcinoma | Female | >=65 | I/II | Unknown | Unknown | SD |
| SUSD2 | SNV | Missense_Mutation | c.1356N>G | p.Asp452Glu | p.D452E | Q9UGT4 | protein_coding | deleterious(0) | probably_damaging(0.999) | TCGA-BH-A18G-01 | Breast | breast invasive carcinoma | Female | >=65 | I/II | Unknown | Unknown | SD | |
| SUSD2 | SNV | Missense_Mutation | novel | c.1978A>C | p.Thr660Pro | p.T660P | Q9UGT4 | protein_coding | deleterious(0.02) | benign(0.36) | TCGA-D8-A1XK-01 | Breast | breast invasive carcinoma | Female | <65 | I/II | Chemotherapy | doxorubicine+cyclophosphamide | SD |
| SUSD2 | SNV | Missense_Mutation | c.2432N>T | p.Arg811Met | p.R811M | Q9UGT4 | protein_coding | deleterious(0) | benign(0.017) | TCGA-EW-A1IZ-01 | Breast | breast invasive carcinoma | Female | <65 | III/IV | Chemotherapy | taxotere | SD | |
| SUSD2 | insertion | Frame_Shift_Ins | novel | c.1562_1563insTCTACGATGTCCT | p.Asn522LeufsTer69 | p.N522Lfs*69 | Q9UGT4 | protein_coding | TCGA-AN-A0FX-01 | Breast | breast invasive carcinoma | Female | <65 | I/II | Unknown | Unknown | SD | ||
| SUSD2 | insertion | In_Frame_Ins | novel | c.1564_1565insGCTTCT | p.Asn522delinsSerPheTyr | p.N522delinsSFY | Q9UGT4 | protein_coding | TCGA-AN-A0FX-01 | Breast | breast invasive carcinoma | Female | <65 | I/II | Unknown | Unknown | SD | ||
| SUSD2 | SNV | Missense_Mutation | rs781470125 | c.2117N>A | p.Arg706Gln | p.R706Q | Q9UGT4 | protein_coding | tolerated(0.09) | benign(0.166) | TCGA-2W-A8YY-01 | Cervix | cervical & endocervical cancer | Female | <65 | I/II | Chemotherapy | cisplatin | CR |
| Page: 1 2 3 4 5 6 7 |
Top |
Related drugs of malignant transformation related genes |
| Identification of chemicals and drugs interact with genes involved in malignant transfromation |
| (DGIdb 4.0) |
| Entrez ID | Symbol | Category | Interaction Types | Drug Claim Name | Drug Name | PMIDs |
| Page: 1 |

Copyright 2023-Present -The University of Texas Health Science Center at Houston |