
|
|||||
|
 | |
| |
| |
| |
| |
| |
|
Gene: SUPV3L1 |
Gene summary for SUPV3L1 |
| Gene information | Species | Human | Gene symbol | SUPV3L1 | Gene ID | 6832 |
| Gene name | Suv3 like RNA helicase | |
| Gene Alias | SUV3 | |
| Cytomap | 10q22.1 | |
| Gene Type | protein-coding | GO ID | GO:0000957 | UniProtAcc | B7Z611 |
Top |
Malignant transformation analysis |
| Identification of the aberrant gene expression in precancerous and cancerous lesions by comparing the gene expression of stem-like cells in diseased tissues with normal stem cells |
| Entrez ID | Symbol | Replicates | Species | Organ | Tissue | Adj P-value | Log2FC | Malignancy |
| 6832 | SUPV3L1 | LZE2T | Human | Esophagus | ESCC | 1.27e-02 | 2.57e-01 | 0.082 |
| 6832 | SUPV3L1 | LZE4T | Human | Esophagus | ESCC | 2.30e-09 | 2.30e-01 | 0.0811 |
| 6832 | SUPV3L1 | LZE7T | Human | Esophagus | ESCC | 1.45e-03 | 1.25e-01 | 0.0667 |
| 6832 | SUPV3L1 | LZE8T | Human | Esophagus | ESCC | 1.85e-03 | 6.11e-02 | 0.067 |
| 6832 | SUPV3L1 | LZE20T | Human | Esophagus | ESCC | 3.49e-04 | 6.95e-02 | 0.0662 |
| 6832 | SUPV3L1 | LZE24T | Human | Esophagus | ESCC | 4.96e-16 | 2.55e-01 | 0.0596 |
| 6832 | SUPV3L1 | LZE6T | Human | Esophagus | ESCC | 4.23e-03 | 1.29e-01 | 0.0845 |
| 6832 | SUPV3L1 | P1T-E | Human | Esophagus | ESCC | 5.29e-03 | 2.25e-01 | 0.0875 |
| 6832 | SUPV3L1 | P2T-E | Human | Esophagus | ESCC | 8.48e-25 | 4.53e-01 | 0.1177 |
| 6832 | SUPV3L1 | P4T-E | Human | Esophagus | ESCC | 1.52e-24 | 4.33e-01 | 0.1323 |
| 6832 | SUPV3L1 | P5T-E | Human | Esophagus | ESCC | 1.85e-17 | 2.28e-01 | 0.1327 |
| 6832 | SUPV3L1 | P8T-E | Human | Esophagus | ESCC | 1.00e-11 | 1.67e-01 | 0.0889 |
| 6832 | SUPV3L1 | P9T-E | Human | Esophagus | ESCC | 4.76e-07 | 6.31e-02 | 0.1131 |
| 6832 | SUPV3L1 | P10T-E | Human | Esophagus | ESCC | 2.80e-15 | 1.09e-01 | 0.116 |
| 6832 | SUPV3L1 | P11T-E | Human | Esophagus | ESCC | 2.00e-10 | 3.72e-01 | 0.1426 |
| 6832 | SUPV3L1 | P12T-E | Human | Esophagus | ESCC | 2.64e-27 | 3.90e-01 | 0.1122 |
| 6832 | SUPV3L1 | P15T-E | Human | Esophagus | ESCC | 2.04e-17 | 2.99e-01 | 0.1149 |
| 6832 | SUPV3L1 | P16T-E | Human | Esophagus | ESCC | 9.81e-20 | 3.27e-01 | 0.1153 |
| 6832 | SUPV3L1 | P17T-E | Human | Esophagus | ESCC | 2.52e-03 | 1.00e-01 | 0.1278 |
| 6832 | SUPV3L1 | P20T-E | Human | Esophagus | ESCC | 5.38e-21 | 3.72e-01 | 0.1124 |
| Page: 1 2 3 4 |
| Tissue | Expression Dynamics | Abbreviation |
| Esophagus | 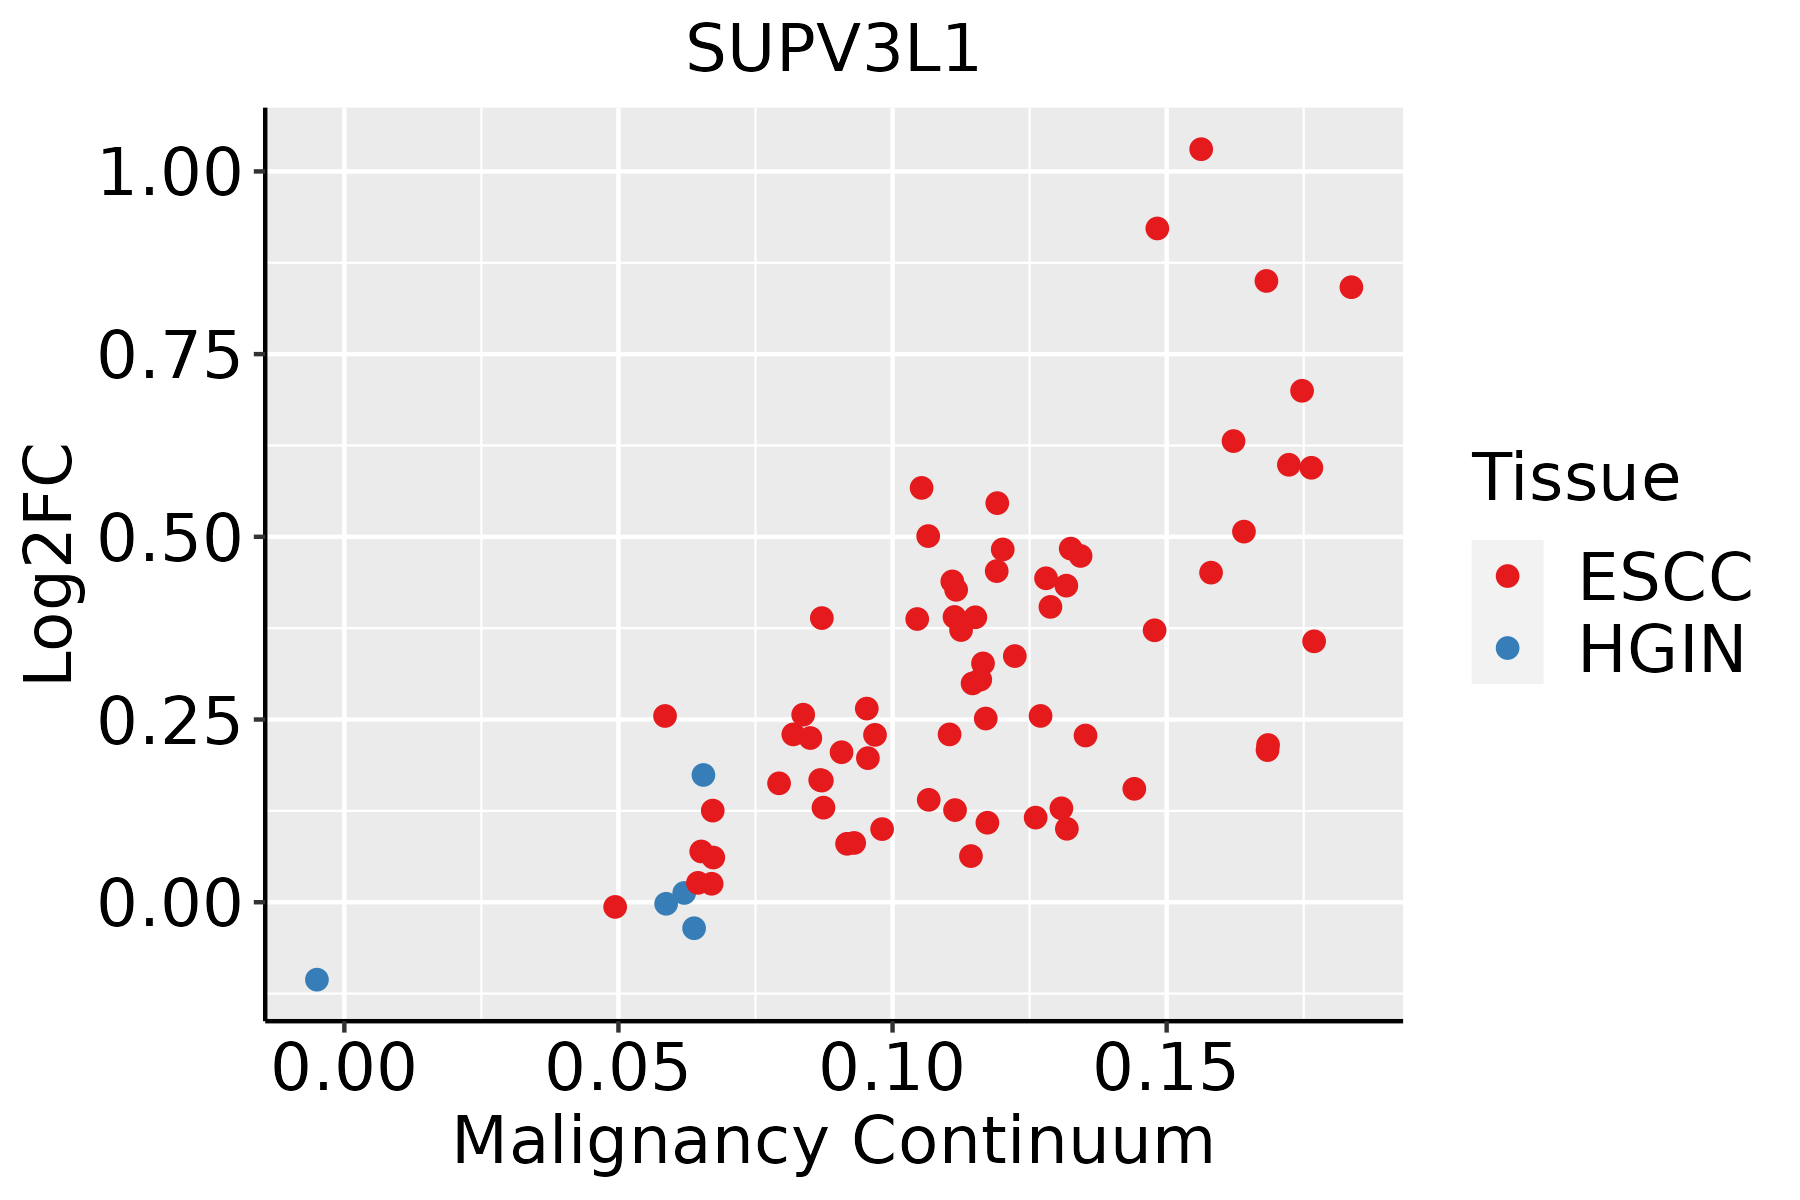 | ESCC: Esophageal squamous cell carcinoma |
| HGIN: High-grade intraepithelial neoplasias | ||
| LGIN: Low-grade intraepithelial neoplasias | ||
| Liver | 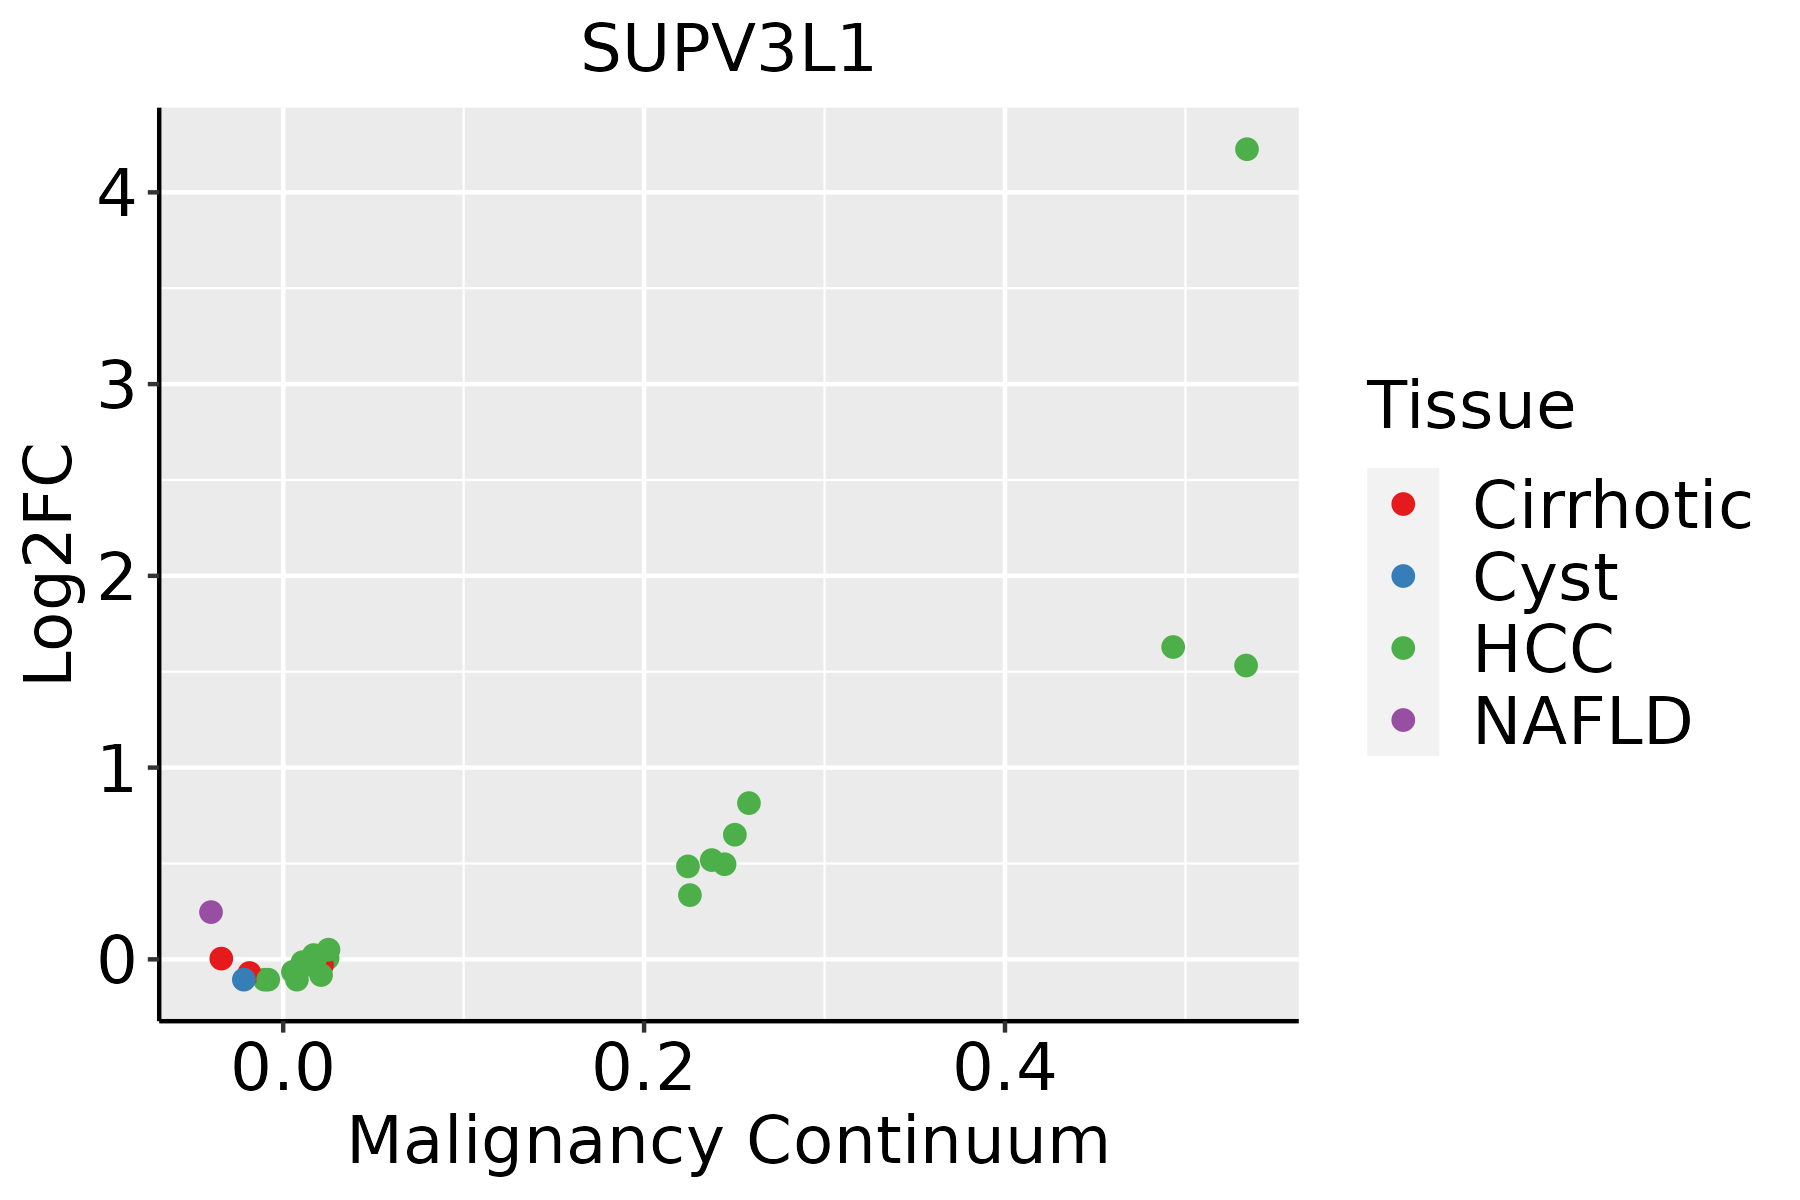 | HCC: Hepatocellular carcinoma |
| NAFLD: Non-alcoholic fatty liver disease | ||
| Oral Cavity |  | EOLP: Erosive Oral lichen planus |
| LP: leukoplakia | ||
| NEOLP: Non-erosive oral lichen planus | ||
| OSCC: Oral squamous cell carcinoma |
| ∗log2FC in expression of this searched gene in stem-like cells from each diseased tissue sample relative to stem-like cells in normal samples in each tissue plotted against the malignancy continuum. Samples are colored based on if they are from different disease stage. |
Top |
Malignant transformation related pathway analysis |
| Find out the enriched GO biological processes and KEGG pathways involved in transition from healthy to precancer to cancer |
| Tissue | Disease Stage | Enriched GO biological Processes |
| Colorectum | AD |  |
| Colorectum | SER |  |
| Colorectum | MSS |  |
| Colorectum | MSI-H |  |
| Colorectum | FAP |  |
| ∗Top 15 enriched GO BP terms are showed in the bar plot of each disease state in each tissue. Each row represents a significant GO biological process which is colored according to the -log10(p.adjust). |
| Page: 1 2 3 4 5 6 7 8 9 |
| GO ID | Tissue | Disease Stage | Description | Gene Ratio | Bg Ratio | pvalue | p.adjust | Count |
| GO:0009896111 | Esophagus | ESCC | positive regulation of catabolic process | 332/8552 | 492/18723 | 4.36e-23 | 9.22e-21 | 332 |
| GO:0031331111 | Esophagus | ESCC | positive regulation of cellular catabolic process | 292/8552 | 427/18723 | 8.67e-22 | 1.53e-19 | 292 |
| GO:0006401110 | Esophagus | ESCC | RNA catabolic process | 204/8552 | 278/18723 | 3.39e-21 | 5.66e-19 | 204 |
| GO:014005313 | Esophagus | ESCC | mitochondrial gene expression | 93/8552 | 108/18723 | 1.96e-18 | 2.03e-16 | 93 |
| GO:0034655110 | Esophagus | ESCC | nucleobase-containing compound catabolic process | 272/8552 | 407/18723 | 2.92e-18 | 2.90e-16 | 272 |
| GO:0006402110 | Esophagus | ESCC | mRNA catabolic process | 170/8552 | 232/18723 | 8.70e-18 | 8.00e-16 | 170 |
| GO:004670018 | Esophagus | ESCC | heterocycle catabolic process | 286/8552 | 445/18723 | 1.12e-15 | 7.47e-14 | 286 |
| GO:004427019 | Esophagus | ESCC | cellular nitrogen compound catabolic process | 288/8552 | 451/18723 | 3.03e-15 | 1.79e-13 | 288 |
| GO:001943918 | Esophagus | ESCC | aromatic compound catabolic process | 295/8552 | 467/18723 | 1.09e-14 | 5.98e-13 | 295 |
| GO:190136118 | Esophagus | ESCC | organic cyclic compound catabolic process | 307/8552 | 495/18723 | 9.99e-14 | 4.80e-12 | 307 |
| GO:0016049110 | Esophagus | ESCC | cell growth | 289/8552 | 482/18723 | 1.29e-10 | 3.77e-09 | 289 |
| GO:000155819 | Esophagus | ESCC | regulation of cell growth | 248/8552 | 414/18723 | 2.97e-09 | 6.45e-08 | 248 |
| GO:00009592 | Esophagus | ESCC | mitochondrial RNA metabolic process | 39/8552 | 49/18723 | 1.20e-06 | 1.49e-05 | 39 |
| GO:00009631 | Esophagus | ESCC | mitochondrial RNA processing | 19/8552 | 20/18723 | 3.83e-06 | 4.14e-05 | 19 |
| GO:003239214 | Esophagus | ESCC | DNA geometric change | 62/8552 | 90/18723 | 7.02e-06 | 7.04e-05 | 62 |
| GO:003250813 | Esophagus | ESCC | DNA duplex unwinding | 58/8552 | 84/18723 | 1.23e-05 | 1.14e-04 | 58 |
| GO:00311233 | Esophagus | ESCC | RNA 3'-end processing | 76/8552 | 116/18723 | 1.25e-05 | 1.15e-04 | 76 |
| GO:003030710 | Esophagus | ESCC | positive regulation of cell growth | 100/8552 | 166/18723 | 1.07e-04 | 7.55e-04 | 100 |
| GO:00710252 | Esophagus | ESCC | RNA surveillance | 14/8552 | 15/18723 | 1.47e-04 | 9.85e-04 | 14 |
| GO:00705848 | Esophagus | ESCC | mitochondrion morphogenesis | 18/8552 | 21/18723 | 1.81e-04 | 1.16e-03 | 18 |
| Page: 1 2 3 4 |
| Pathway ID | Tissue | Disease Stage | Description | Gene Ratio | Bg Ratio | pvalue | p.adjust | qvalue | Count |
| Page: 1 |
Top |
Cell-cell communication analysis |
| Identification of potential cell-cell interactions between two cell types and their ligand-receptor pairs for different disease states |
| Ligand | Receptor | LRpair | Pathway | Tissue | Disease Stage |
| Page: 1 |
Top |
Single-cell gene regulatory network inference analysis |
| Find out the significant the regulons (TFs) and the target genes of each regulon across cell types for different disease states |
| TF | Cell Type | Tissue | Disease Stage | Target Gene | RSS | Regulon Activity |
| ∗The dot plots of a searched regulon are shown for all cell subpopulations in each disease state of each tissue based on the regulon specific score inferred using pySCENIC and by calculating the average expression. |
| Page: 1 |
Top |
Somatic mutation of malignant transformation related genes |
| Annotation of somatic variants for genes involved in malignant transformation |
| Hugo Symbol | Variant Class | Variant Classification | dbSNP RS | HGVSc | HGVSp | HGVSp Short | SWISSPROT | BIOTYPE | SIFT | PolyPhen | Tumor Sample Barcode | Tissue | Histology | Sex | Age | Stage | Therapy Types | Drugs | Outcome |
| SUPV3L1 | SNV | Missense_Mutation | rs776187314 | c.724N>A | p.Glu242Lys | p.E242K | Q8IYB8 | protein_coding | tolerated(0.72) | benign(0.006) | TCGA-AN-A046-01 | Breast | breast invasive carcinoma | Female | >=65 | I/II | Unknown | Unknown | SD |
| SUPV3L1 | SNV | Missense_Mutation | novel | c.952N>A | p.His318Asn | p.H318N | Q8IYB8 | protein_coding | deleterious(0) | probably_damaging(0.998) | TCGA-AN-A046-01 | Breast | breast invasive carcinoma | Female | >=65 | I/II | Unknown | Unknown | SD |
| SUPV3L1 | SNV | Missense_Mutation | c.1427N>T | p.Ser476Leu | p.S476L | Q8IYB8 | protein_coding | deleterious(0) | benign(0.04) | TCGA-EW-A1OV-01 | Breast | breast invasive carcinoma | Female | <65 | I/II | Chemotherapy | epirubicin | SD | |
| SUPV3L1 | insertion | Nonsense_Mutation | novel | c.333_334insCAATAACAGGCCCAGCTAATTTTTGTATTTTTAGTAGAGACGGG | p.Asp112GlnfsTer2 | p.D112Qfs*2 | Q8IYB8 | protein_coding | TCGA-A8-A08H-01 | Breast | breast invasive carcinoma | Female | >=65 | I/II | Unknown | Unknown | SD | ||
| SUPV3L1 | insertion | Frame_Shift_Ins | novel | c.1175_1176insT | p.Ala393SerfsTer20 | p.A393Sfs*20 | Q8IYB8 | protein_coding | TCGA-AO-A0J9-01 | Breast | breast invasive carcinoma | Female | <65 | III/IV | Chemotherapy | cyclophosphamide | PD | ||
| SUPV3L1 | insertion | In_Frame_Ins | novel | c.1178_1179insACCAAGAGTCCTCCATTCTGGGGAACCCATTAGTCCTAGACAAAC | p.Ala393_Val394insProArgValLeuHisSerGlyGluProIleSerProArgGlnThr | p.A393_V394insPRVLHSGEPISPRQT | Q8IYB8 | protein_coding | TCGA-AO-A0J9-01 | Breast | breast invasive carcinoma | Female | <65 | III/IV | Chemotherapy | cyclophosphamide | PD | ||
| SUPV3L1 | insertion | Frame_Shift_Ins | novel | c.931_931+1insCTCCAAA | p.Gly311AlafsTer7 | p.G311Afs*7 | Q8IYB8 | protein_coding | TCGA-AR-A0TU-01 | Breast | breast invasive carcinoma | Female | <65 | I/II | Unspecific | Doxorubicin | SD | ||
| SUPV3L1 | SNV | Missense_Mutation | c.1873C>T | p.Leu625Phe | p.L625F | Q8IYB8 | protein_coding | deleterious(0) | probably_damaging(0.999) | TCGA-DS-A1OC-01 | Cervix | cervical & endocervical cancer | Female | <65 | I/II | Chemotherapy | gemcitabine | SD | |
| SUPV3L1 | SNV | Missense_Mutation | c.85N>T | p.Arg29Cys | p.R29C | Q8IYB8 | protein_coding | deleterious_low_confidence(0.01) | possibly_damaging(0.549) | TCGA-EK-A2RJ-01 | Cervix | cervical & endocervical cancer | Female | <65 | I/II | Unknown | Unknown | SD | |
| SUPV3L1 | SNV | Missense_Mutation | c.2254N>C | p.Glu752Gln | p.E752Q | Q8IYB8 | protein_coding | tolerated(1) | benign(0) | TCGA-EX-A1H6-01 | Cervix | cervical & endocervical cancer | Female | <65 | I/II | Unknown | Unknown | SD |
| Page: 1 2 3 4 5 6 |
Top |
Related drugs of malignant transformation related genes |
| Identification of chemicals and drugs interact with genes involved in malignant transfromation |
| (DGIdb 4.0) |
| Entrez ID | Symbol | Category | Interaction Types | Drug Claim Name | Drug Name | PMIDs |
| Page: 1 |

Copyright 2023-Present -The University of Texas Health Science Center at Houston |