
|
|||||
|
 | |
| |
| |
| |
| |
| |
|
Gene: SUPT7L |
Gene summary for SUPT7L |
| Gene information | Species | Human | Gene symbol | SUPT7L | Gene ID | 9913 |
| Gene name | SPT7 like, STAGA complex subunit gamma | |
| Gene Alias | SPT7L | |
| Cytomap | 2p23.3 | |
| Gene Type | protein-coding | GO ID | GO:0006139 | UniProtAcc | O94864 |
Top |
Malignant transformation analysis |
| Identification of the aberrant gene expression in precancerous and cancerous lesions by comparing the gene expression of stem-like cells in diseased tissues with normal stem cells |
| Entrez ID | Symbol | Replicates | Species | Organ | Tissue | Adj P-value | Log2FC | Malignancy |
| 9913 | SUPT7L | LZE4T | Human | Esophagus | ESCC | 2.18e-17 | 4.32e-01 | 0.0811 |
| 9913 | SUPT7L | LZE7T | Human | Esophagus | ESCC | 8.73e-11 | 5.03e-01 | 0.0667 |
| 9913 | SUPT7L | LZE8T | Human | Esophagus | ESCC | 1.10e-09 | 2.72e-01 | 0.067 |
| 9913 | SUPT7L | LZE20T | Human | Esophagus | ESCC | 1.72e-03 | 7.86e-02 | 0.0662 |
| 9913 | SUPT7L | LZE21D1 | Human | Esophagus | HGIN | 2.29e-02 | 2.22e-01 | 0.0632 |
| 9913 | SUPT7L | LZE22T | Human | Esophagus | ESCC | 6.43e-03 | 1.48e-01 | 0.068 |
| 9913 | SUPT7L | LZE24T | Human | Esophagus | ESCC | 8.24e-13 | 4.21e-01 | 0.0596 |
| 9913 | SUPT7L | LZE6T | Human | Esophagus | ESCC | 1.43e-03 | 3.63e-01 | 0.0845 |
| 9913 | SUPT7L | P1T-E | Human | Esophagus | ESCC | 1.16e-04 | 1.66e-01 | 0.0875 |
| 9913 | SUPT7L | P2T-E | Human | Esophagus | ESCC | 2.75e-35 | 5.95e-01 | 0.1177 |
| 9913 | SUPT7L | P4T-E | Human | Esophagus | ESCC | 2.88e-26 | 5.10e-01 | 0.1323 |
| 9913 | SUPT7L | P5T-E | Human | Esophagus | ESCC | 1.30e-17 | 3.21e-01 | 0.1327 |
| 9913 | SUPT7L | P8T-E | Human | Esophagus | ESCC | 2.26e-19 | 3.28e-01 | 0.0889 |
| 9913 | SUPT7L | P9T-E | Human | Esophagus | ESCC | 2.94e-21 | 4.10e-01 | 0.1131 |
| 9913 | SUPT7L | P10T-E | Human | Esophagus | ESCC | 1.42e-29 | 4.69e-01 | 0.116 |
| 9913 | SUPT7L | P11T-E | Human | Esophagus | ESCC | 2.14e-14 | 7.03e-01 | 0.1426 |
| 9913 | SUPT7L | P12T-E | Human | Esophagus | ESCC | 9.28e-27 | 5.15e-01 | 0.1122 |
| 9913 | SUPT7L | P15T-E | Human | Esophagus | ESCC | 1.77e-20 | 5.12e-01 | 0.1149 |
| 9913 | SUPT7L | P16T-E | Human | Esophagus | ESCC | 5.14e-19 | 4.10e-01 | 0.1153 |
| 9913 | SUPT7L | P17T-E | Human | Esophagus | ESCC | 3.87e-04 | 1.95e-01 | 0.1278 |
| Page: 1 2 3 4 5 |
| Tissue | Expression Dynamics | Abbreviation |
| Esophagus |  | ESCC: Esophageal squamous cell carcinoma |
| HGIN: High-grade intraepithelial neoplasias | ||
| LGIN: Low-grade intraepithelial neoplasias | ||
| Liver |  | HCC: Hepatocellular carcinoma |
| NAFLD: Non-alcoholic fatty liver disease | ||
| Oral Cavity | 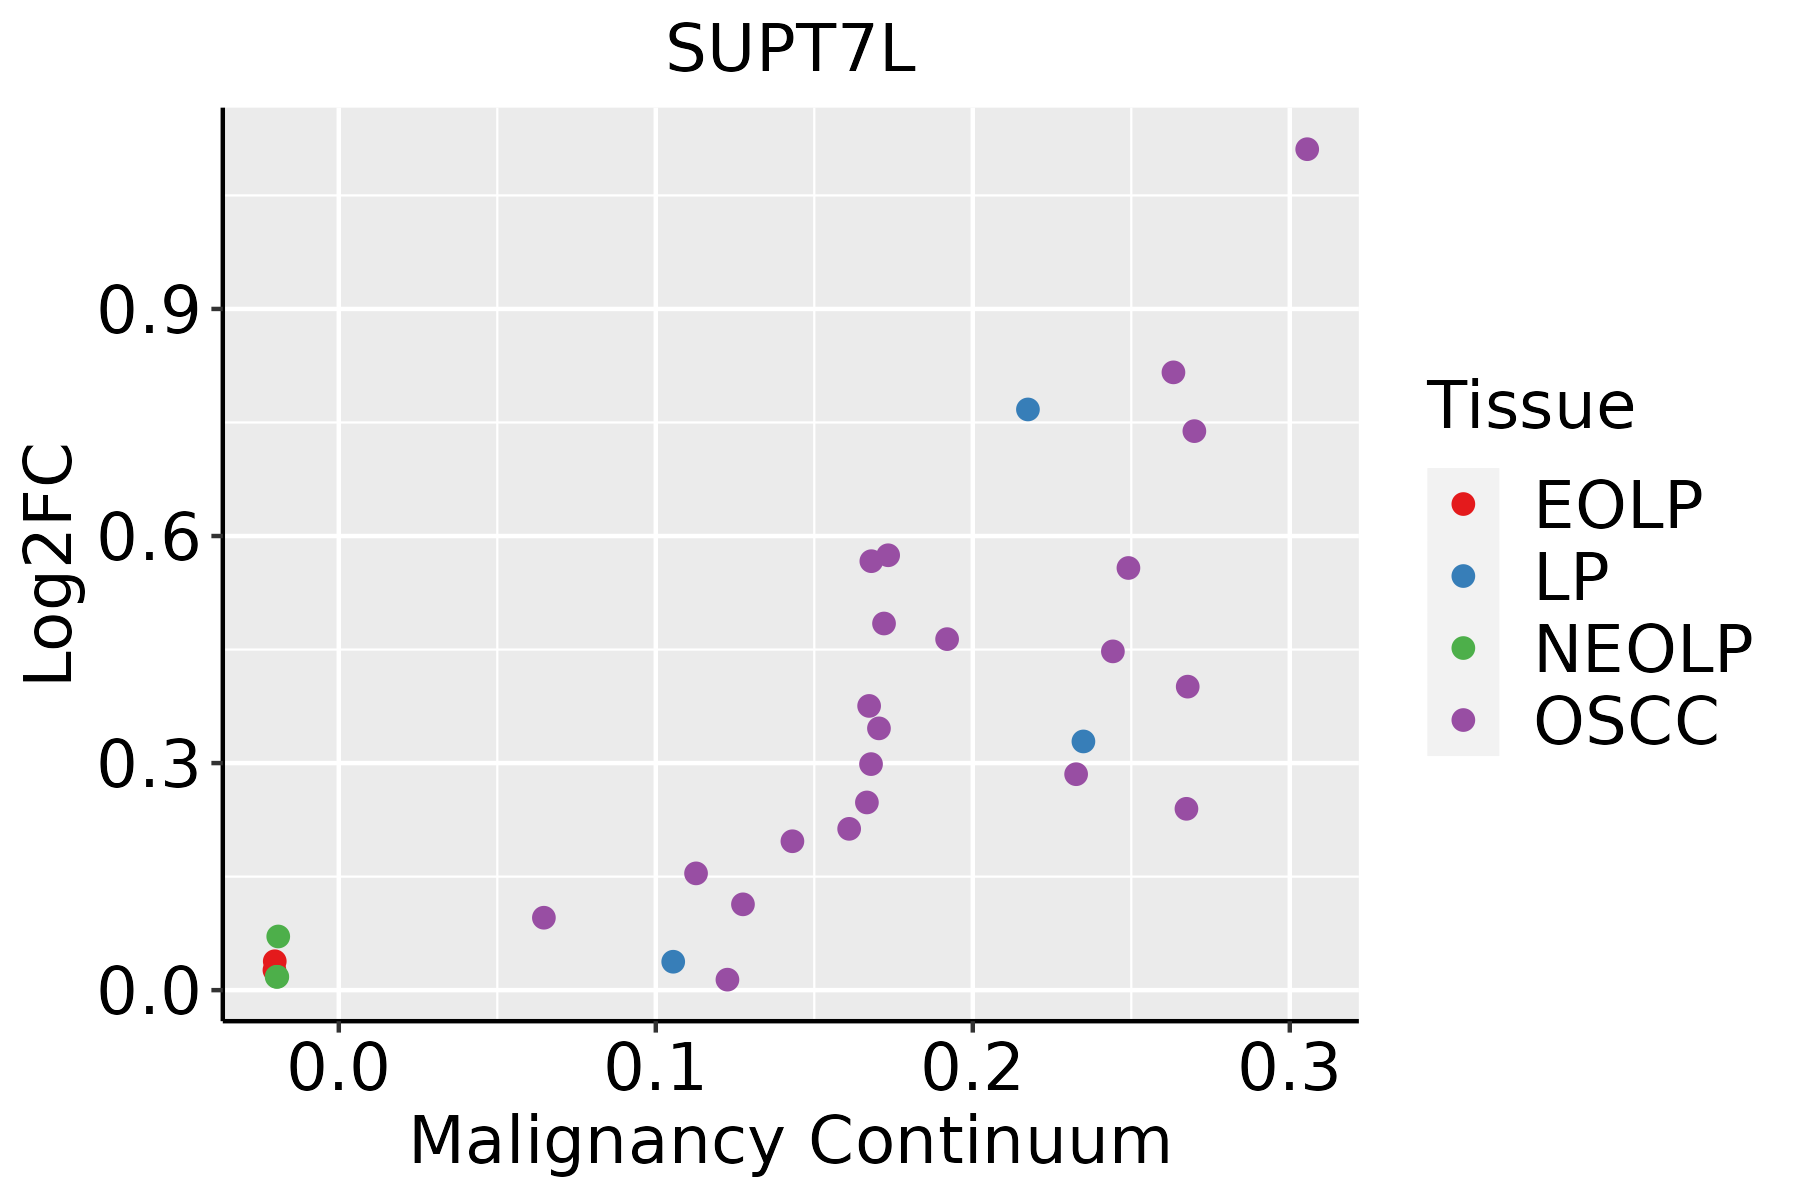 | EOLP: Erosive Oral lichen planus |
| LP: leukoplakia | ||
| NEOLP: Non-erosive oral lichen planus | ||
| OSCC: Oral squamous cell carcinoma |
| ∗log2FC in expression of this searched gene in stem-like cells from each diseased tissue sample relative to stem-like cells in normal samples in each tissue plotted against the malignancy continuum. Samples are colored based on if they are from different disease stage. |
Top |
Malignant transformation related pathway analysis |
| Find out the enriched GO biological processes and KEGG pathways involved in transition from healthy to precancer to cancer |
| Tissue | Disease Stage | Enriched GO biological Processes |
| Colorectum | AD |  |
| Colorectum | SER |  |
| Colorectum | MSS |  |
| Colorectum | MSI-H |  |
| Colorectum | FAP |  |
| ∗Top 15 enriched GO BP terms are showed in the bar plot of each disease state in each tissue. Each row represents a significant GO biological process which is colored according to the -log10(p.adjust). |
| Page: 1 2 3 4 5 6 7 8 9 |
| GO ID | Tissue | Disease Stage | Description | Gene Ratio | Bg Ratio | pvalue | p.adjust | Count |
| GO:003450417 | Esophagus | HGIN | protein localization to nucleus | 84/2587 | 290/18723 | 1.06e-11 | 1.24e-09 | 84 |
| GO:00182057 | Esophagus | HGIN | peptidyl-lysine modification | 88/2587 | 376/18723 | 2.99e-07 | 1.39e-05 | 88 |
| GO:005165126 | Esophagus | HGIN | maintenance of location in cell | 53/2587 | 214/18723 | 1.22e-05 | 3.45e-04 | 53 |
| GO:005123520 | Esophagus | HGIN | maintenance of location | 73/2587 | 327/18723 | 1.73e-05 | 4.71e-04 | 73 |
| GO:004518523 | Esophagus | HGIN | maintenance of protein location | 28/2587 | 94/18723 | 4.52e-05 | 1.09e-03 | 28 |
| GO:00165708 | Esophagus | HGIN | histone modification | 92/2587 | 463/18723 | 1.70e-04 | 3.30e-03 | 92 |
| GO:003250719 | Esophagus | HGIN | maintenance of protein location in cell | 20/2587 | 65/18723 | 3.31e-04 | 5.48e-03 | 20 |
| GO:00514575 | Esophagus | HGIN | maintenance of protein location in nucleus | 10/2587 | 23/18723 | 5.09e-04 | 7.38e-03 | 10 |
| GO:00064735 | Esophagus | HGIN | protein acetylation | 45/2587 | 201/18723 | 6.17e-04 | 8.58e-03 | 45 |
| GO:00183945 | Esophagus | HGIN | peptidyl-lysine acetylation | 39/2587 | 169/18723 | 7.46e-04 | 9.90e-03 | 39 |
| GO:00725959 | Esophagus | HGIN | maintenance of protein localization in organelle | 14/2587 | 42/18723 | 1.05e-03 | 1.31e-02 | 14 |
| GO:00435435 | Esophagus | HGIN | protein acylation | 51/2587 | 243/18723 | 1.33e-03 | 1.57e-02 | 51 |
| GO:00064755 | Esophagus | HGIN | internal protein amino acid acetylation | 36/2587 | 160/18723 | 1.87e-03 | 2.01e-02 | 36 |
| GO:00183935 | Esophagus | HGIN | internal peptidyl-lysine acetylation | 35/2587 | 158/18723 | 2.82e-03 | 2.75e-02 | 35 |
| GO:001657015 | Esophagus | ESCC | histone modification | 323/8552 | 463/18723 | 2.61e-26 | 7.88e-24 | 323 |
| GO:003450418 | Esophagus | ESCC | protein localization to nucleus | 211/8552 | 290/18723 | 4.06e-21 | 6.60e-19 | 211 |
| GO:001820514 | Esophagus | ESCC | peptidyl-lysine modification | 259/8552 | 376/18723 | 3.90e-20 | 5.26e-18 | 259 |
| GO:001839413 | Esophagus | ESCC | peptidyl-lysine acetylation | 123/8552 | 169/18723 | 6.58e-13 | 2.94e-11 | 123 |
| GO:004354313 | Esophagus | ESCC | protein acylation | 165/8552 | 243/18723 | 1.69e-12 | 7.14e-11 | 165 |
| GO:000647313 | Esophagus | ESCC | protein acetylation | 140/8552 | 201/18723 | 4.37e-12 | 1.69e-10 | 140 |
| Page: 1 2 3 4 |
| Pathway ID | Tissue | Disease Stage | Description | Gene Ratio | Bg Ratio | pvalue | p.adjust | qvalue | Count |
| Page: 1 |
Top |
Cell-cell communication analysis |
| Identification of potential cell-cell interactions between two cell types and their ligand-receptor pairs for different disease states |
| Ligand | Receptor | LRpair | Pathway | Tissue | Disease Stage |
| Page: 1 |
Top |
Single-cell gene regulatory network inference analysis |
| Find out the significant the regulons (TFs) and the target genes of each regulon across cell types for different disease states |
| TF | Cell Type | Tissue | Disease Stage | Target Gene | RSS | Regulon Activity |
| ∗The dot plots of a searched regulon are shown for all cell subpopulations in each disease state of each tissue based on the regulon specific score inferred using pySCENIC and by calculating the average expression. |
| Page: 1 |
Top |
Somatic mutation of malignant transformation related genes |
| Annotation of somatic variants for genes involved in malignant transformation |
| Hugo Symbol | Variant Class | Variant Classification | dbSNP RS | HGVSc | HGVSp | HGVSp Short | SWISSPROT | BIOTYPE | SIFT | PolyPhen | Tumor Sample Barcode | Tissue | Histology | Sex | Age | Stage | Therapy Types | Drugs | Outcome |
| SUPT7L | SNV | Missense_Mutation | c.1019N>T | p.Ala340Val | p.A340V | O94864 | protein_coding | tolerated(0.27) | benign(0.053) | TCGA-A8-A09Z-01 | Breast | breast invasive carcinoma | Female | >=65 | I/II | Unknown | Unknown | SD | |
| SUPT7L | SNV | Missense_Mutation | c.1041A>C | p.Gln347His | p.Q347H | O94864 | protein_coding | deleterious(0.01) | probably_damaging(0.99) | TCGA-D8-A1JB-01 | Breast | breast invasive carcinoma | Female | <65 | I/II | Chemotherapy | adriamycin | SD | |
| SUPT7L | deletion | Frame_Shift_Del | c.274_275delNN | p.Glu92ArgfsTer5 | p.E92Rfs*5 | O94864 | protein_coding | TCGA-E2-A1LS-01 | Breast | breast invasive carcinoma | Female | <65 | I/II | Unspecific | Cyclophosphamide | SD | |||
| SUPT7L | SNV | Missense_Mutation | c.1147G>T | p.Asp383Tyr | p.D383Y | O94864 | protein_coding | deleterious_low_confidence(0.03) | benign(0.188) | TCGA-EK-A2RE-01 | Cervix | cervical & endocervical cancer | Female | <65 | I/II | Unknown | Unknown | SD | |
| SUPT7L | SNV | Missense_Mutation | c.640N>A | p.Asp214Asn | p.D214N | O94864 | protein_coding | tolerated(0.1) | possibly_damaging(0.491) | TCGA-IR-A3LH-01 | Cervix | cervical & endocervical cancer | Female | <65 | I/II | Chemotherapy | cisplatin | CR | |
| SUPT7L | SNV | Missense_Mutation | novel | c.1157G>A | p.Ser386Asn | p.S386N | O94864 | protein_coding | tolerated_low_confidence(0.06) | benign(0.107) | TCGA-AA-3984-01 | Colorectum | colon adenocarcinoma | Female | <65 | I/II | Unknown | Unknown | SD |
| SUPT7L | SNV | Missense_Mutation | c.79C>T | p.Arg27Trp | p.R27W | O94864 | protein_coding | deleterious(0) | possibly_damaging(0.898) | TCGA-CM-6171-01 | Colorectum | colon adenocarcinoma | Female | >=65 | I/II | Unknown | Unknown | SD | |
| SUPT7L | SNV | Missense_Mutation | novel | c.1195N>G | p.Ser399Ala | p.S399A | O94864 | protein_coding | tolerated_low_confidence(0.17) | benign(0.003) | TCGA-G4-6588-01 | Colorectum | colon adenocarcinoma | Female | <65 | I/II | Unknown | Unknown | SD |
| SUPT7L | deletion | Frame_Shift_Del | novel | c.150delC | p.Thr51LeufsTer19 | p.T51Lfs*19 | O94864 | protein_coding | TCGA-AA-3950-01 | Colorectum | colon adenocarcinoma | Female | >=65 | I/II | Unknown | Unknown | SD | ||
| SUPT7L | SNV | Missense_Mutation | novel | c.264N>T | p.Gln88His | p.Q88H | O94864 | protein_coding | deleterious(0.05) | probably_damaging(0.969) | TCGA-A5-A0G1-01 | Endometrium | uterine corpus endometrioid carcinoma | Female | >=65 | I/II | Unknown | Unknown | SD |
| Page: 1 2 3 |
Top |
Related drugs of malignant transformation related genes |
| Identification of chemicals and drugs interact with genes involved in malignant transfromation |
| (DGIdb 4.0) |
| Entrez ID | Symbol | Category | Interaction Types | Drug Claim Name | Drug Name | PMIDs |
| Page: 1 |

Copyright 2023-Present -The University of Texas Health Science Center at Houston |