
|
|||||
|
 | |
| |
| |
| |
| |
| |
|
Gene: SUPT6H |
Gene summary for SUPT6H |
| Gene information | Species | Human | Gene symbol | SUPT6H | Gene ID | 6830 |
| Gene name | SPT6 homolog, histone chaperone and transcription elongation factor | |
| Gene Alias | SPT6 | |
| Cytomap | 17q11.2 | |
| Gene Type | protein-coding | GO ID | GO:0000018 | UniProtAcc | Q7KZ85 |
Top |
Malignant transformation analysis |
| Identification of the aberrant gene expression in precancerous and cancerous lesions by comparing the gene expression of stem-like cells in diseased tissues with normal stem cells |
| Entrez ID | Symbol | Replicates | Species | Organ | Tissue | Adj P-value | Log2FC | Malignancy |
| 6830 | SUPT6H | LZE2T | Human | Esophagus | ESCC | 8.79e-03 | 4.97e-01 | 0.082 |
| 6830 | SUPT6H | LZE4T | Human | Esophagus | ESCC | 1.33e-14 | 5.34e-01 | 0.0811 |
| 6830 | SUPT6H | LZE7T | Human | Esophagus | ESCC | 1.37e-08 | 4.81e-01 | 0.0667 |
| 6830 | SUPT6H | LZE8T | Human | Esophagus | ESCC | 4.07e-08 | 3.14e-01 | 0.067 |
| 6830 | SUPT6H | LZE20T | Human | Esophagus | ESCC | 1.88e-10 | 1.91e-01 | 0.0662 |
| 6830 | SUPT6H | LZE22T | Human | Esophagus | ESCC | 3.39e-08 | 3.30e-01 | 0.068 |
| 6830 | SUPT6H | LZE24T | Human | Esophagus | ESCC | 2.17e-17 | 6.07e-01 | 0.0596 |
| 6830 | SUPT6H | LZE21T | Human | Esophagus | ESCC | 4.13e-03 | 5.81e-01 | 0.0655 |
| 6830 | SUPT6H | P1T-E | Human | Esophagus | ESCC | 3.03e-20 | 8.67e-01 | 0.0875 |
| 6830 | SUPT6H | P2T-E | Human | Esophagus | ESCC | 1.24e-21 | 6.03e-01 | 0.1177 |
| 6830 | SUPT6H | P4T-E | Human | Esophagus | ESCC | 2.44e-20 | 4.59e-01 | 0.1323 |
| 6830 | SUPT6H | P5T-E | Human | Esophagus | ESCC | 6.27e-08 | 2.35e-01 | 0.1327 |
| 6830 | SUPT6H | P8T-E | Human | Esophagus | ESCC | 1.64e-28 | 6.19e-01 | 0.0889 |
| 6830 | SUPT6H | P9T-E | Human | Esophagus | ESCC | 9.99e-16 | 3.41e-01 | 0.1131 |
| 6830 | SUPT6H | P10T-E | Human | Esophagus | ESCC | 5.42e-27 | 6.58e-01 | 0.116 |
| 6830 | SUPT6H | P11T-E | Human | Esophagus | ESCC | 1.35e-14 | 6.47e-01 | 0.1426 |
| 6830 | SUPT6H | P12T-E | Human | Esophagus | ESCC | 2.08e-23 | 4.97e-01 | 0.1122 |
| 6830 | SUPT6H | P15T-E | Human | Esophagus | ESCC | 2.08e-28 | 6.94e-01 | 0.1149 |
| 6830 | SUPT6H | P16T-E | Human | Esophagus | ESCC | 3.84e-19 | 3.65e-01 | 0.1153 |
| 6830 | SUPT6H | P17T-E | Human | Esophagus | ESCC | 4.73e-09 | 3.99e-01 | 0.1278 |
| Page: 1 2 3 4 5 6 |
| Tissue | Expression Dynamics | Abbreviation |
| Esophagus |  | ESCC: Esophageal squamous cell carcinoma |
| HGIN: High-grade intraepithelial neoplasias | ||
| LGIN: Low-grade intraepithelial neoplasias | ||
| Liver | 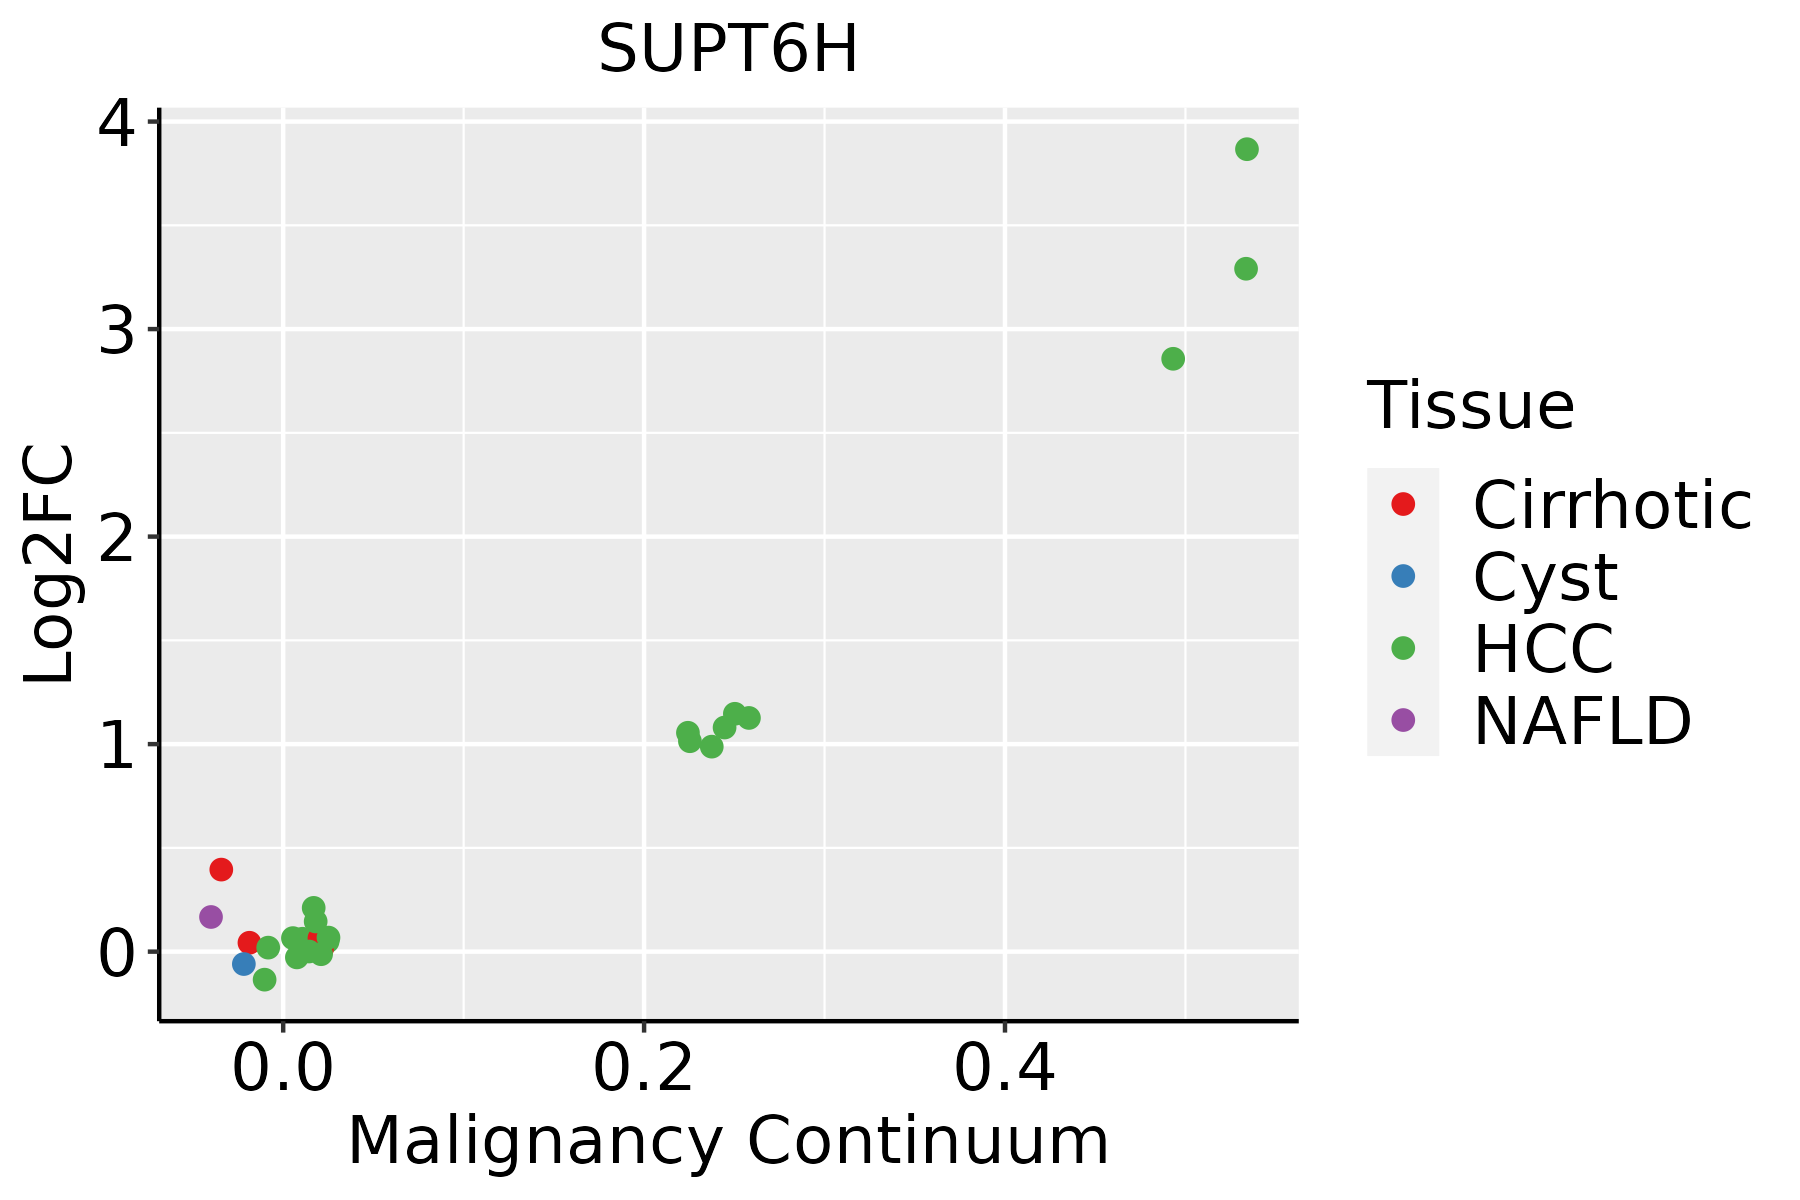 | HCC: Hepatocellular carcinoma |
| NAFLD: Non-alcoholic fatty liver disease | ||
| Oral Cavity | 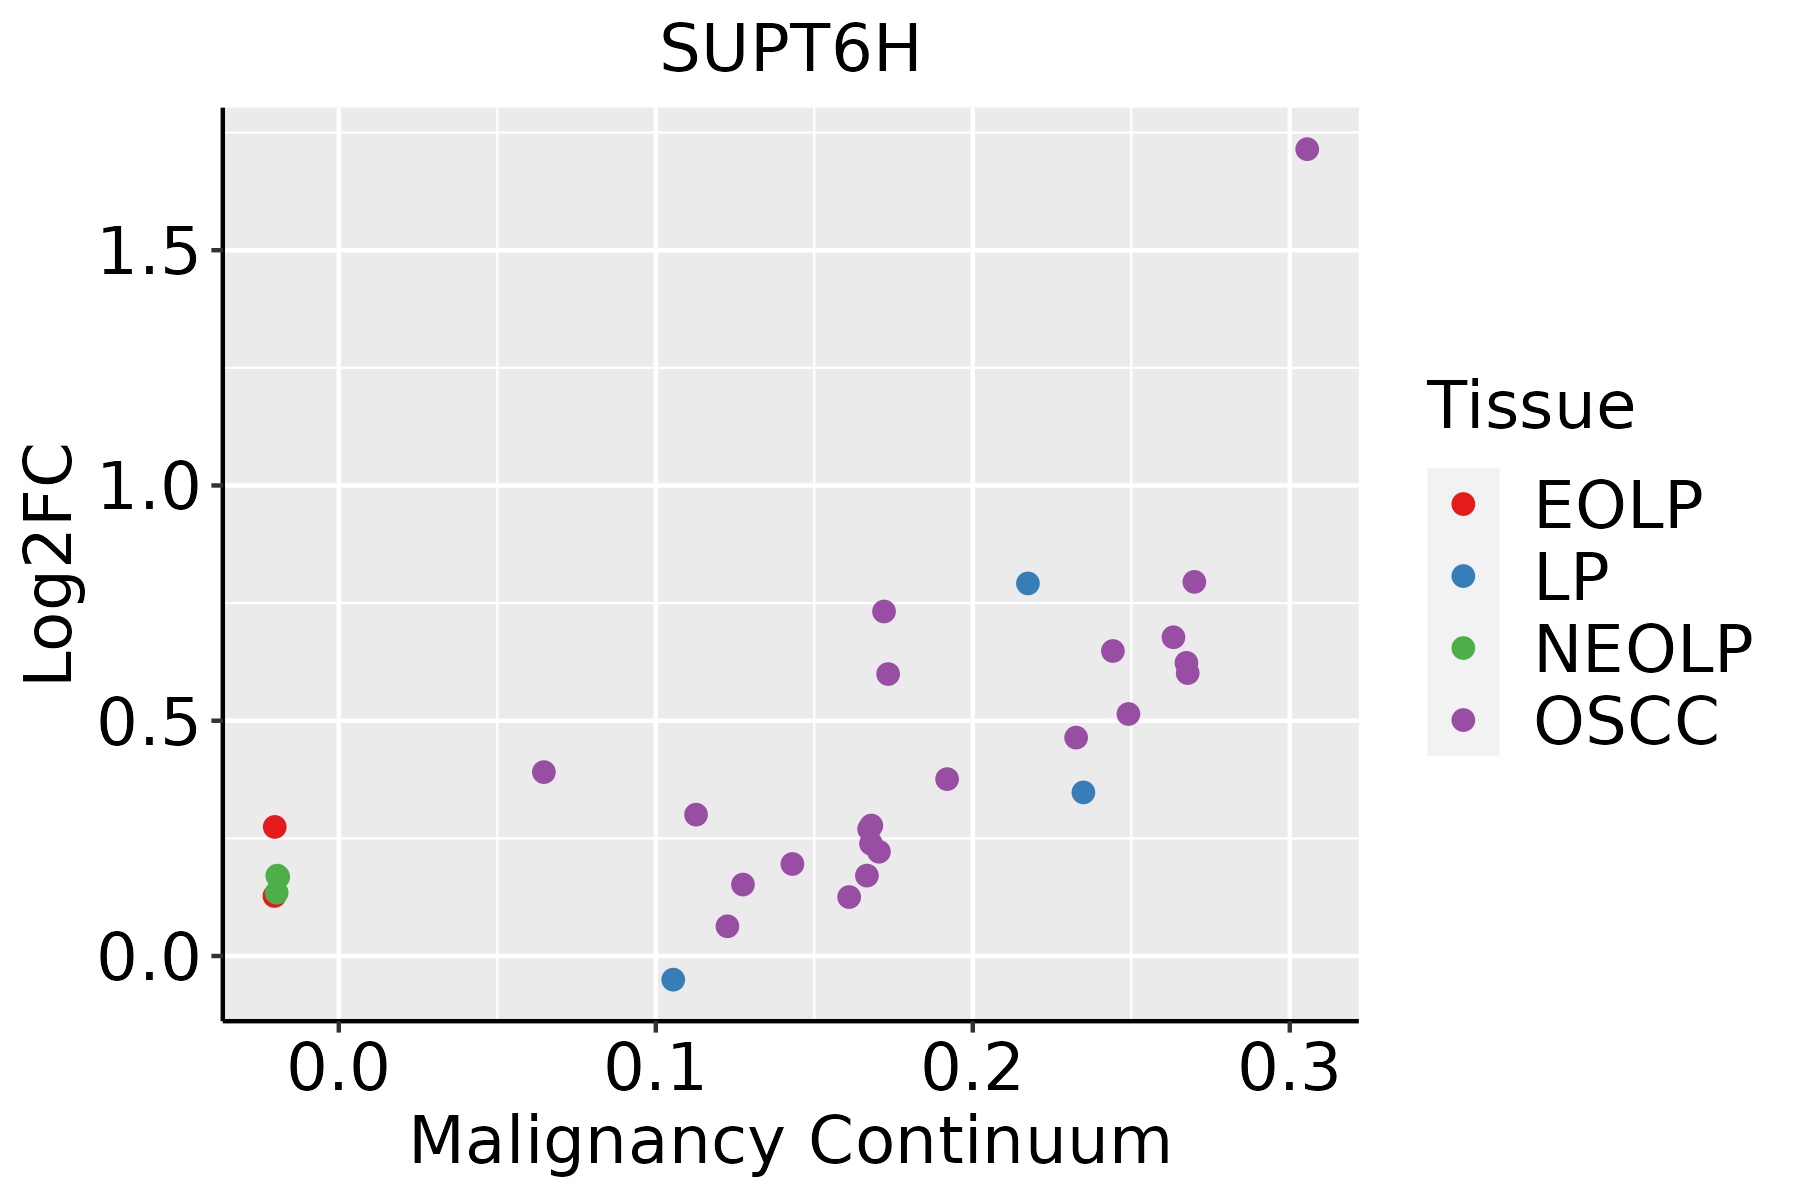 | EOLP: Erosive Oral lichen planus |
| LP: leukoplakia | ||
| NEOLP: Non-erosive oral lichen planus | ||
| OSCC: Oral squamous cell carcinoma | ||
| Thyroid |  | ATC: Anaplastic thyroid cancer |
| HT: Hashimoto's thyroiditis | ||
| PTC: Papillary thyroid cancer |
| ∗log2FC in expression of this searched gene in stem-like cells from each diseased tissue sample relative to stem-like cells in normal samples in each tissue plotted against the malignancy continuum. Samples are colored based on if they are from different disease stage. |
Top |
Malignant transformation related pathway analysis |
| Find out the enriched GO biological processes and KEGG pathways involved in transition from healthy to precancer to cancer |
| Tissue | Disease Stage | Enriched GO biological Processes |
| Colorectum | AD |  |
| Colorectum | SER |  |
| Colorectum | MSS |  |
| Colorectum | MSI-H |  |
| Colorectum | FAP |  |
| ∗Top 15 enriched GO BP terms are showed in the bar plot of each disease state in each tissue. Each row represents a significant GO biological process which is colored according to the -log10(p.adjust). |
| Page: 1 2 3 4 5 6 7 8 9 |
| GO ID | Tissue | Disease Stage | Description | Gene Ratio | Bg Ratio | pvalue | p.adjust | Count |
| GO:0008380111 | Esophagus | ESCC | RNA splicing | 336/8552 | 434/18723 | 1.74e-42 | 3.67e-39 | 336 |
| GO:0006913110 | Esophagus | ESCC | nucleocytoplasmic transport | 230/8552 | 301/18723 | 6.04e-28 | 2.02e-25 | 230 |
| GO:0051169110 | Esophagus | ESCC | nuclear transport | 230/8552 | 301/18723 | 6.04e-28 | 2.02e-25 | 230 |
| GO:0006403110 | Esophagus | ESCC | RNA localization | 166/8552 | 201/18723 | 1.95e-27 | 6.18e-25 | 166 |
| GO:001657015 | Esophagus | ESCC | histone modification | 323/8552 | 463/18723 | 2.61e-26 | 7.88e-24 | 323 |
| GO:003238618 | Esophagus | ESCC | regulation of intracellular transport | 243/8552 | 337/18723 | 3.20e-23 | 7.25e-21 | 243 |
| GO:1903311110 | Esophagus | ESCC | regulation of mRNA metabolic process | 210/8552 | 288/18723 | 3.25e-21 | 5.56e-19 | 210 |
| GO:005123617 | Esophagus | ESCC | establishment of RNA localization | 134/8552 | 166/18723 | 1.23e-20 | 1.81e-18 | 134 |
| GO:0051168110 | Esophagus | ESCC | nuclear export | 126/8552 | 154/18723 | 1.88e-20 | 2.65e-18 | 126 |
| GO:005102815 | Esophagus | ESCC | mRNA transport | 110/8552 | 130/18723 | 2.76e-20 | 3.80e-18 | 110 |
| GO:001820514 | Esophagus | ESCC | peptidyl-lysine modification | 259/8552 | 376/18723 | 3.90e-20 | 5.26e-18 | 259 |
| GO:005065717 | Esophagus | ESCC | nucleic acid transport | 131/8552 | 163/18723 | 6.94e-20 | 8.46e-18 | 131 |
| GO:005065817 | Esophagus | ESCC | RNA transport | 131/8552 | 163/18723 | 6.94e-20 | 8.46e-18 | 131 |
| GO:001593117 | Esophagus | ESCC | nucleobase-containing compound transport | 162/8552 | 222/18723 | 9.87e-17 | 7.93e-15 | 162 |
| GO:0050684110 | Esophagus | ESCC | regulation of mRNA processing | 109/8552 | 137/18723 | 3.51e-16 | 2.59e-14 | 109 |
| GO:000170119 | Esophagus | ESCC | in utero embryonic development | 243/8552 | 367/18723 | 1.00e-15 | 6.86e-14 | 243 |
| GO:0046822110 | Esophagus | ESCC | regulation of nucleocytoplasmic transport | 88/8552 | 106/18723 | 1.88e-15 | 1.19e-13 | 88 |
| GO:000635414 | Esophagus | ESCC | DNA-templated transcription, elongation | 76/8552 | 91/18723 | 8.35e-14 | 4.11e-12 | 76 |
| GO:005105215 | Esophagus | ESCC | regulation of DNA metabolic process | 232/8552 | 359/18723 | 2.40e-13 | 1.13e-11 | 232 |
| GO:007116612 | Esophagus | ESCC | ribonucleoprotein complex localization | 66/8552 | 77/18723 | 2.94e-13 | 1.38e-11 | 66 |
| Page: 1 2 3 4 5 6 7 8 9 10 11 12 13 14 15 16 17 18 19 |
| Pathway ID | Tissue | Disease Stage | Description | Gene Ratio | Bg Ratio | pvalue | p.adjust | qvalue | Count |
| Page: 1 |
Top |
Cell-cell communication analysis |
| Identification of potential cell-cell interactions between two cell types and their ligand-receptor pairs for different disease states |
| Ligand | Receptor | LRpair | Pathway | Tissue | Disease Stage |
| Page: 1 |
Top |
Single-cell gene regulatory network inference analysis |
| Find out the significant the regulons (TFs) and the target genes of each regulon across cell types for different disease states |
| TF | Cell Type | Tissue | Disease Stage | Target Gene | RSS | Regulon Activity |
| ∗The dot plots of a searched regulon are shown for all cell subpopulations in each disease state of each tissue based on the regulon specific score inferred using pySCENIC and by calculating the average expression. |
| Page: 1 |
Top |
Somatic mutation of malignant transformation related genes |
| Annotation of somatic variants for genes involved in malignant transformation |
| Hugo Symbol | Variant Class | Variant Classification | dbSNP RS | HGVSc | HGVSp | HGVSp Short | SWISSPROT | BIOTYPE | SIFT | PolyPhen | Tumor Sample Barcode | Tissue | Histology | Sex | Age | Stage | Therapy Types | Drugs | Outcome |
| SUPT6H | SNV | Missense_Mutation | c.388N>T | p.Asp130Tyr | p.D130Y | Q7KZ85 | protein_coding | deleterious(0) | possibly_damaging(0.791) | TCGA-A2-A25A-01 | Breast | breast invasive carcinoma | Female | <65 | I/II | Unspecific | Cytoxan | SD | |
| SUPT6H | SNV | Missense_Mutation | c.5009N>G | p.Ala1670Gly | p.A1670G | Q7KZ85 | protein_coding | tolerated(0.37) | benign(0.066) | TCGA-A7-A0DA-01 | Breast | breast invasive carcinoma | Female | <65 | I/II | Chemotherapy | adriamycin | SD | |
| SUPT6H | SNV | Missense_Mutation | rs755836482 | c.4562N>C | p.Gly1521Ala | p.G1521A | Q7KZ85 | protein_coding | tolerated(0.12) | possibly_damaging(0.505) | TCGA-A8-A08B-01 | Breast | breast invasive carcinoma | Female | <65 | I/II | Chemotherapy | 5-fluorouracil | CR |
| SUPT6H | SNV | Missense_Mutation | c.3218N>T | p.Ala1073Val | p.A1073V | Q7KZ85 | protein_coding | deleterious(0) | probably_damaging(0.998) | TCGA-A8-A09Z-01 | Breast | breast invasive carcinoma | Female | >=65 | I/II | Unknown | Unknown | SD | |
| SUPT6H | SNV | Missense_Mutation | c.3817N>C | p.Glu1273Gln | p.E1273Q | Q7KZ85 | protein_coding | deleterious(0.01) | probably_damaging(0.989) | TCGA-AC-A23H-01 | Breast | breast invasive carcinoma | Female | >=65 | I/II | Unknown | Unknown | PD | |
| SUPT6H | SNV | Missense_Mutation | c.295G>A | p.Asp99Asn | p.D99N | Q7KZ85 | protein_coding | deleterious(0.01) | probably_damaging(0.956) | TCGA-AO-A03T-01 | Breast | breast invasive carcinoma | Female | <65 | I/II | Chemotherapy | cyclophosphamide | SD | |
| SUPT6H | SNV | Missense_Mutation | c.298N>A | p.Asp100Asn | p.D100N | Q7KZ85 | protein_coding | deleterious(0.02) | probably_damaging(0.956) | TCGA-C8-A131-01 | Breast | breast invasive carcinoma | Female | >=65 | III/IV | Chemotherapy | 5-fluorouracil | CR | |
| SUPT6H | SNV | Missense_Mutation | c.3779G>C | p.Gly1260Ala | p.G1260A | Q7KZ85 | protein_coding | deleterious(0.02) | possibly_damaging(0.705) | TCGA-C8-A27B-01 | Breast | breast invasive carcinoma | Female | <65 | I/II | Chemotherapy | 5-fluorouracil | CR | |
| SUPT6H | SNV | Missense_Mutation | c.22N>A | p.Glu8Lys | p.E8K | Q7KZ85 | protein_coding | deleterious_low_confidence(0.03) | possibly_damaging(0.905) | TCGA-D8-A1J9-01 | Breast | breast invasive carcinoma | Female | <65 | I/II | Unknown | Unknown | SD | |
| SUPT6H | SNV | Missense_Mutation | c.388G>T | p.Asp130Tyr | p.D130Y | Q7KZ85 | protein_coding | deleterious(0) | possibly_damaging(0.791) | TCGA-D8-A1X7-01 | Breast | breast invasive carcinoma | Female | <65 | I/II | ChemotherapyHormone Therapy | doxorubicine+cyclophosphamide+tamoxifen | SD |
| Page: 1 2 3 4 5 6 7 8 9 10 11 12 13 14 15 16 |
Top |
Related drugs of malignant transformation related genes |
| Identification of chemicals and drugs interact with genes involved in malignant transfromation |
| (DGIdb 4.0) |
| Entrez ID | Symbol | Category | Interaction Types | Drug Claim Name | Drug Name | PMIDs |
| Page: 1 |

Copyright 2023-Present -The University of Texas Health Science Center at Houston |