
|
|||||
|
 | |
| |
| |
| |
| |
| |
|
Gene: SUPT4H1 |
Gene summary for SUPT4H1 |
| Gene information | Species | Human | Gene symbol | SUPT4H1 | Gene ID | 6827 |
| Gene name | SPT4 homolog, DSIF elongation factor subunit | |
| Gene Alias | SPT4 | |
| Cytomap | 17q22 | |
| Gene Type | protein-coding | GO ID | GO:0000122 | UniProtAcc | P63272 |
Top |
Malignant transformation analysis |
| Identification of the aberrant gene expression in precancerous and cancerous lesions by comparing the gene expression of stem-like cells in diseased tissues with normal stem cells |
| Entrez ID | Symbol | Replicates | Species | Organ | Tissue | Adj P-value | Log2FC | Malignancy |
| 6827 | SUPT4H1 | GSM4909285 | Human | Breast | IDC | 7.34e-06 | 2.90e-01 | 0.21 |
| 6827 | SUPT4H1 | GSM4909291 | Human | Breast | IDC | 1.48e-07 | 5.09e-01 | 0.1753 |
| 6827 | SUPT4H1 | GSM4909294 | Human | Breast | IDC | 1.32e-14 | 4.53e-01 | 0.2022 |
| 6827 | SUPT4H1 | GSM4909296 | Human | Breast | IDC | 2.71e-06 | -1.67e-01 | 0.1524 |
| 6827 | SUPT4H1 | GSM4909297 | Human | Breast | IDC | 6.40e-10 | 2.38e-02 | 0.1517 |
| 6827 | SUPT4H1 | GSM4909298 | Human | Breast | IDC | 7.96e-12 | 3.99e-01 | 0.1551 |
| 6827 | SUPT4H1 | GSM4909311 | Human | Breast | IDC | 1.50e-18 | -1.49e-01 | 0.1534 |
| 6827 | SUPT4H1 | GSM4909312 | Human | Breast | IDC | 5.49e-09 | 3.15e-02 | 0.1552 |
| 6827 | SUPT4H1 | GSM4909317 | Human | Breast | IDC | 3.59e-02 | 2.69e-01 | 0.1355 |
| 6827 | SUPT4H1 | GSM4909319 | Human | Breast | IDC | 6.43e-34 | -2.87e-02 | 0.1563 |
| 6827 | SUPT4H1 | GSM4909320 | Human | Breast | IDC | 8.80e-09 | 3.94e-01 | 0.1575 |
| 6827 | SUPT4H1 | GSM4909321 | Human | Breast | IDC | 5.79e-21 | 3.51e-01 | 0.1559 |
| 6827 | SUPT4H1 | brca1 | Human | Breast | Precancer | 8.84e-05 | 2.53e-01 | -0.0338 |
| 6827 | SUPT4H1 | brca2 | Human | Breast | Precancer | 3.85e-02 | 1.86e-01 | -0.024 |
| 6827 | SUPT4H1 | brca3 | Human | Breast | Precancer | 8.72e-06 | 2.63e-01 | -0.0263 |
| 6827 | SUPT4H1 | NCCBC14 | Human | Breast | DCIS | 1.01e-02 | 2.11e-02 | 0.2021 |
| 6827 | SUPT4H1 | NCCBC2 | Human | Breast | DCIS | 3.47e-06 | 3.69e-01 | 0.1554 |
| 6827 | SUPT4H1 | NCCBC5 | Human | Breast | DCIS | 2.89e-05 | -3.96e-02 | 0.2046 |
| 6827 | SUPT4H1 | P1 | Human | Breast | IDC | 1.28e-10 | 3.69e-03 | 0.1527 |
| 6827 | SUPT4H1 | DCIS2 | Human | Breast | DCIS | 1.31e-48 | 5.74e-02 | 0.0085 |
| Page: 1 2 3 4 5 6 7 8 9 10 |
| Tissue | Expression Dynamics | Abbreviation |
| Breast | 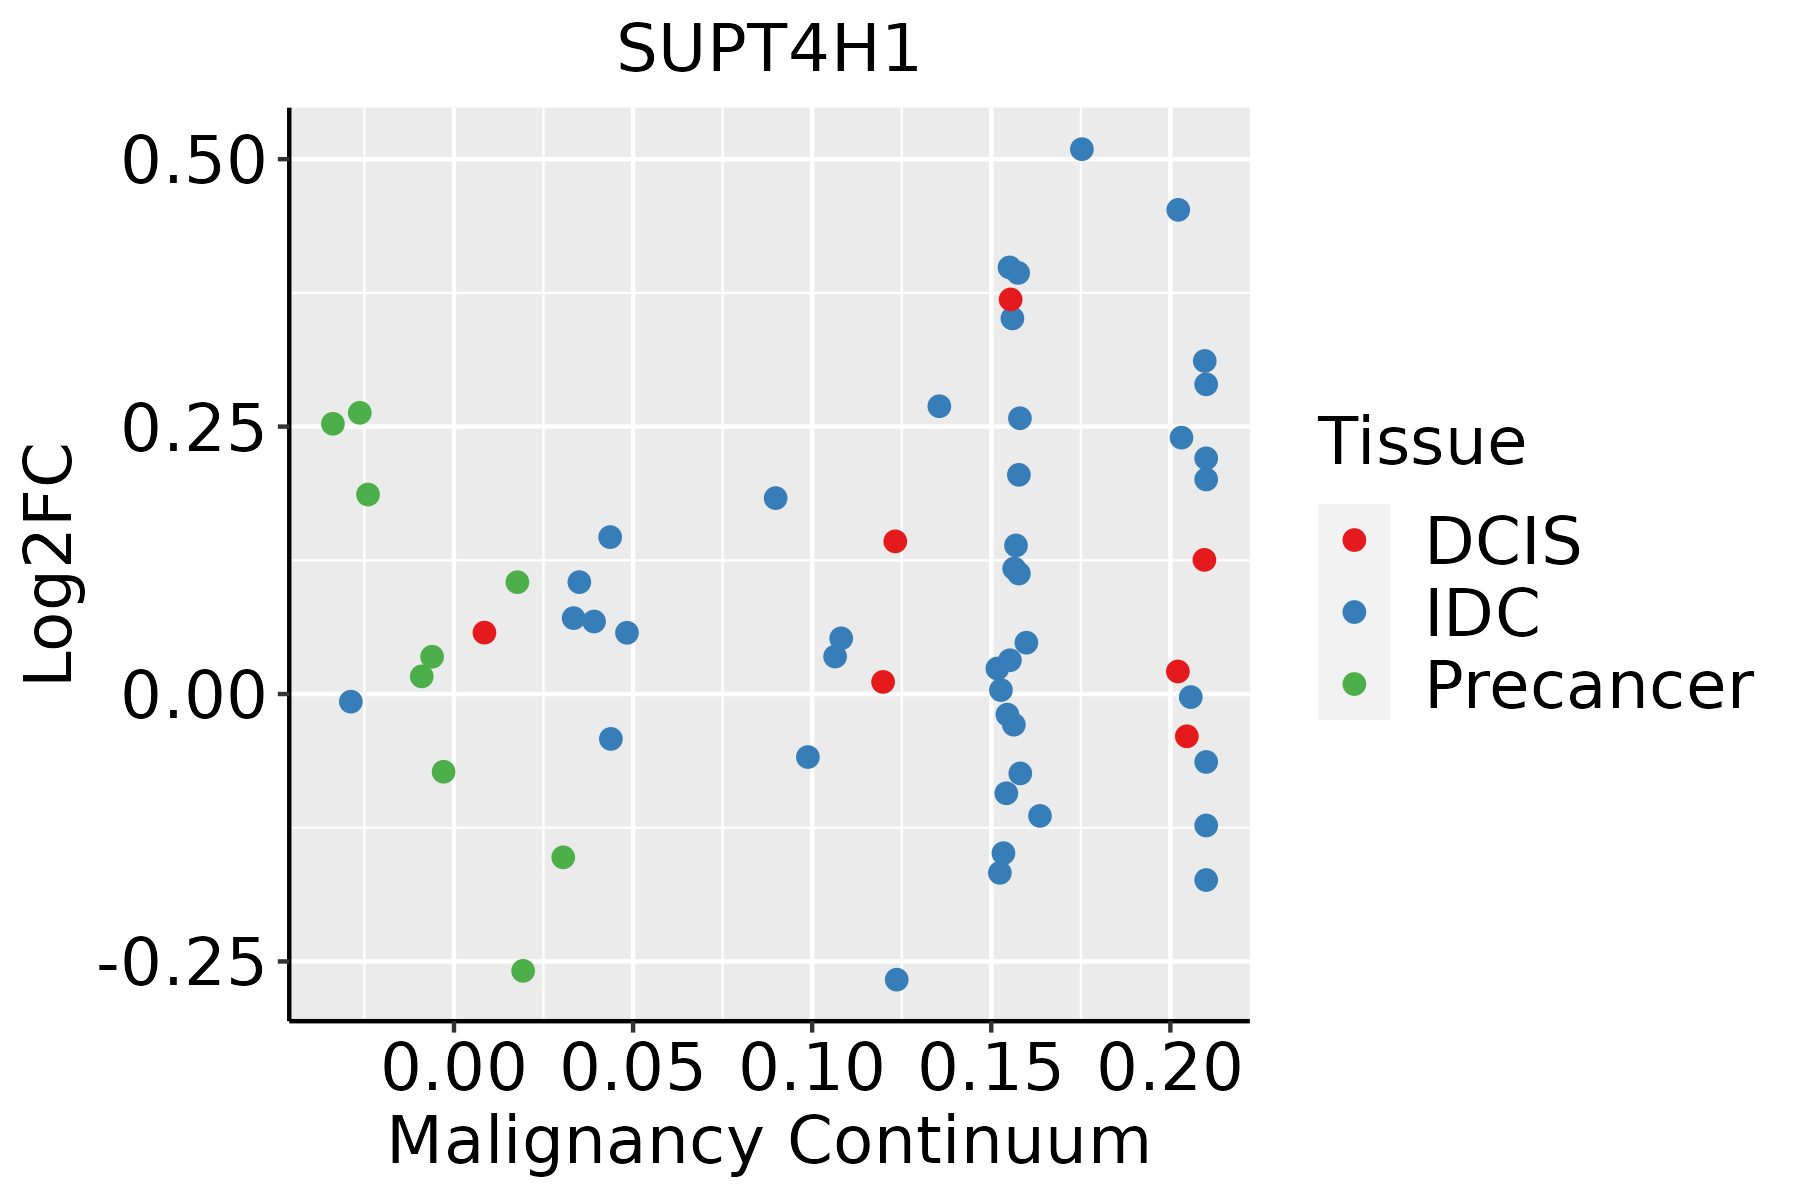 | IDC: Invasive ductal carcinoma |
| DCIS: Ductal carcinoma in situ | ||
| Precancer(BRCA1-mut): Precancerous lesion from BRCA1 mutation carriers | ||
| Colorectum (GSE201348) |  | FAP: Familial adenomatous polyposis |
| CRC: Colorectal cancer | ||
| Colorectum (HTA11) |  | AD: Adenomas |
| SER: Sessile serrated lesions | ||
| MSI-H: Microsatellite-high colorectal cancer | ||
| MSS: Microsatellite stable colorectal cancer | ||
| Endometrium |  | AEH: Atypical endometrial hyperplasia |
| EEC: Endometrioid Cancer | ||
| Esophagus |  | ESCC: Esophageal squamous cell carcinoma |
| HGIN: High-grade intraepithelial neoplasias | ||
| LGIN: Low-grade intraepithelial neoplasias | ||
| Liver | 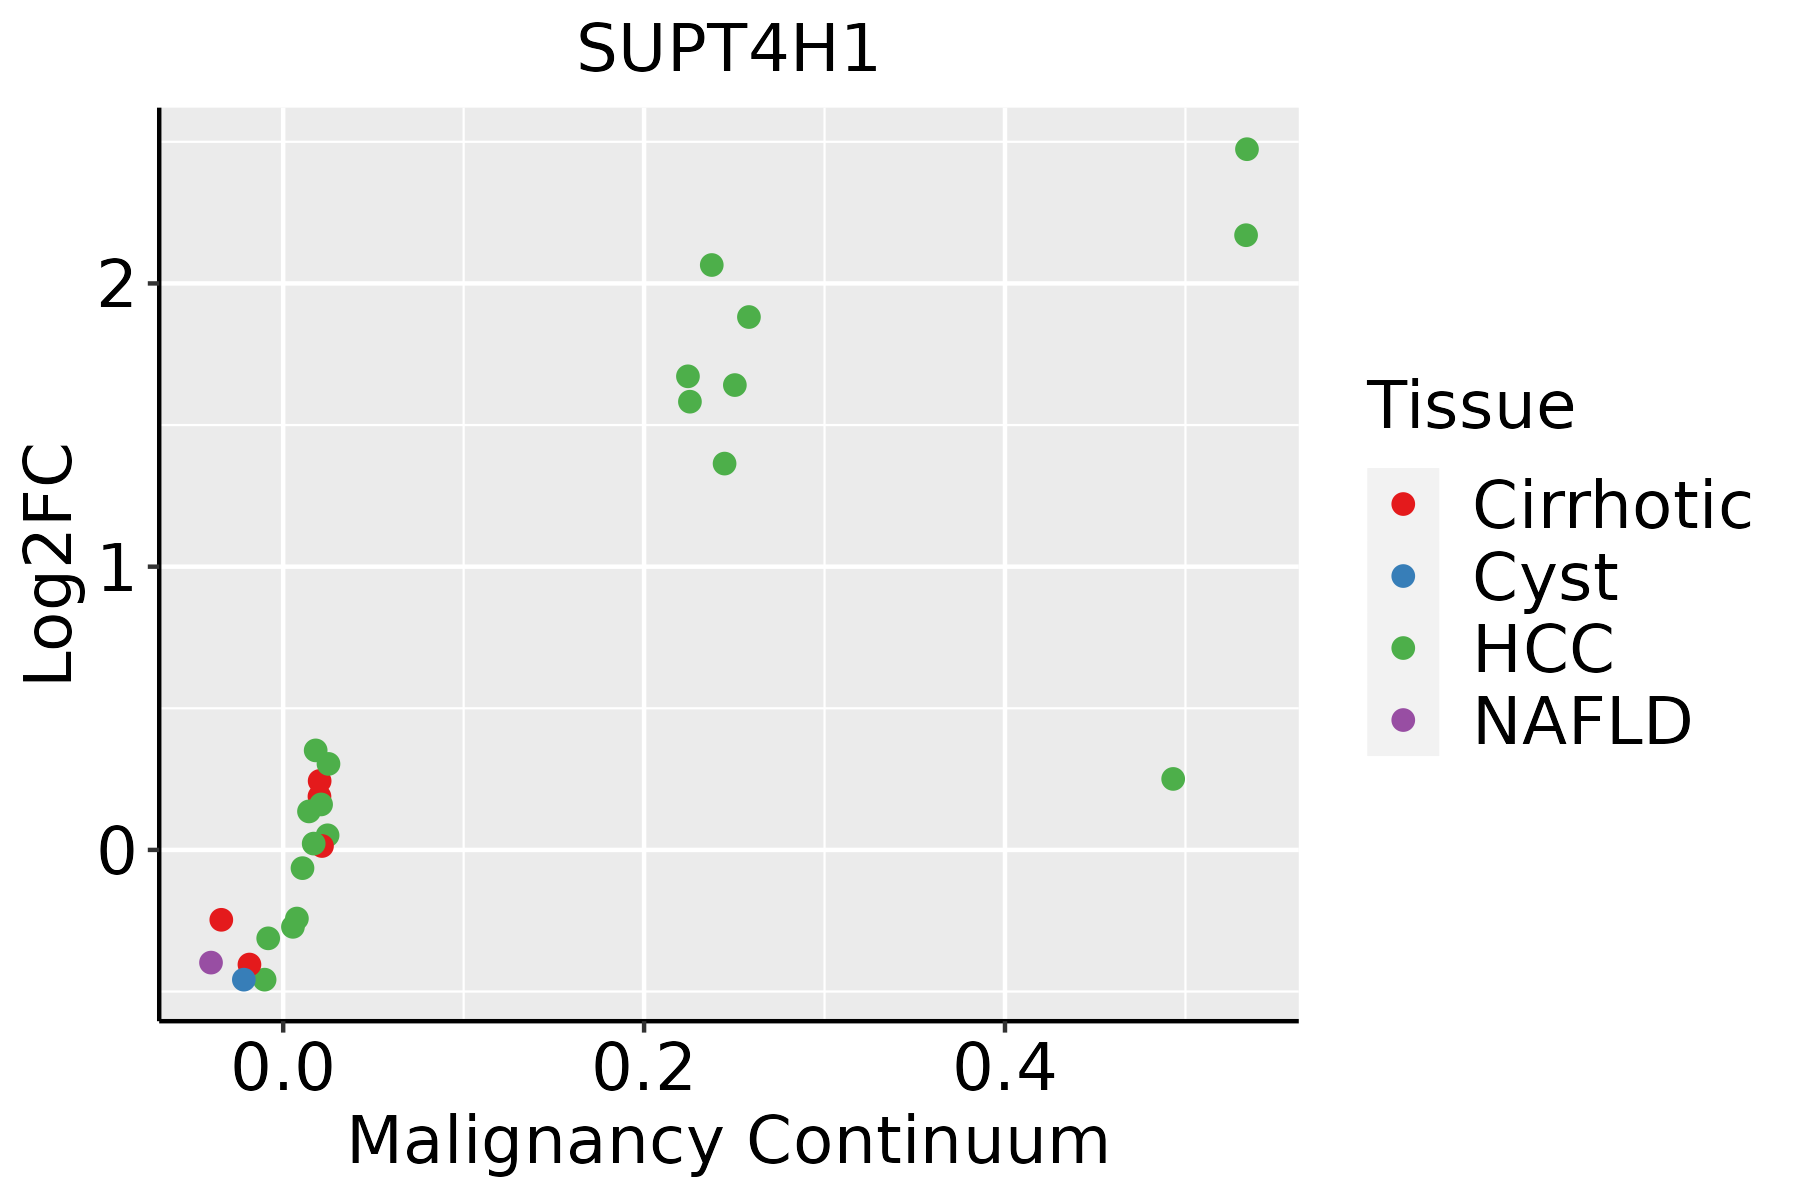 | HCC: Hepatocellular carcinoma |
| NAFLD: Non-alcoholic fatty liver disease | ||
| Oral Cavity | 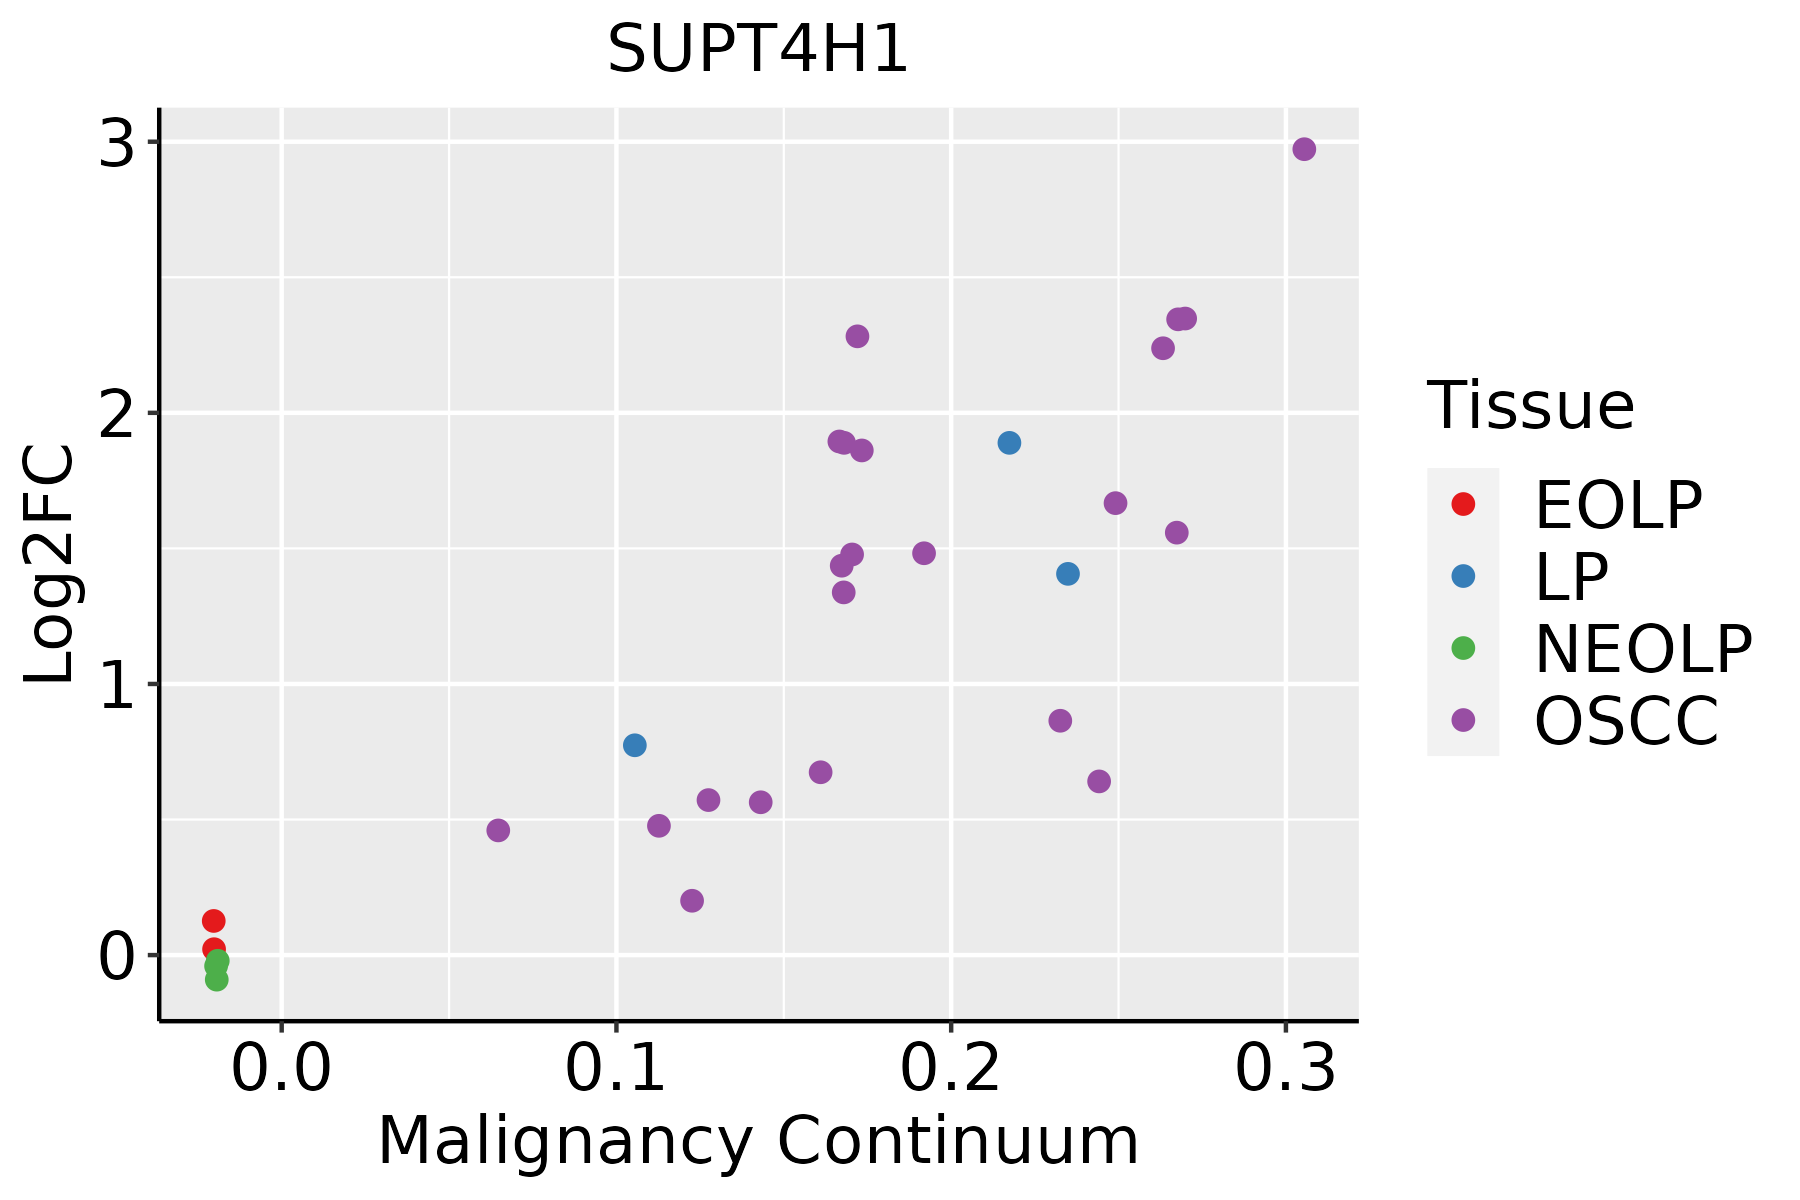 | EOLP: Erosive Oral lichen planus |
| LP: leukoplakia | ||
| NEOLP: Non-erosive oral lichen planus | ||
| OSCC: Oral squamous cell carcinoma | ||
| Prostate | 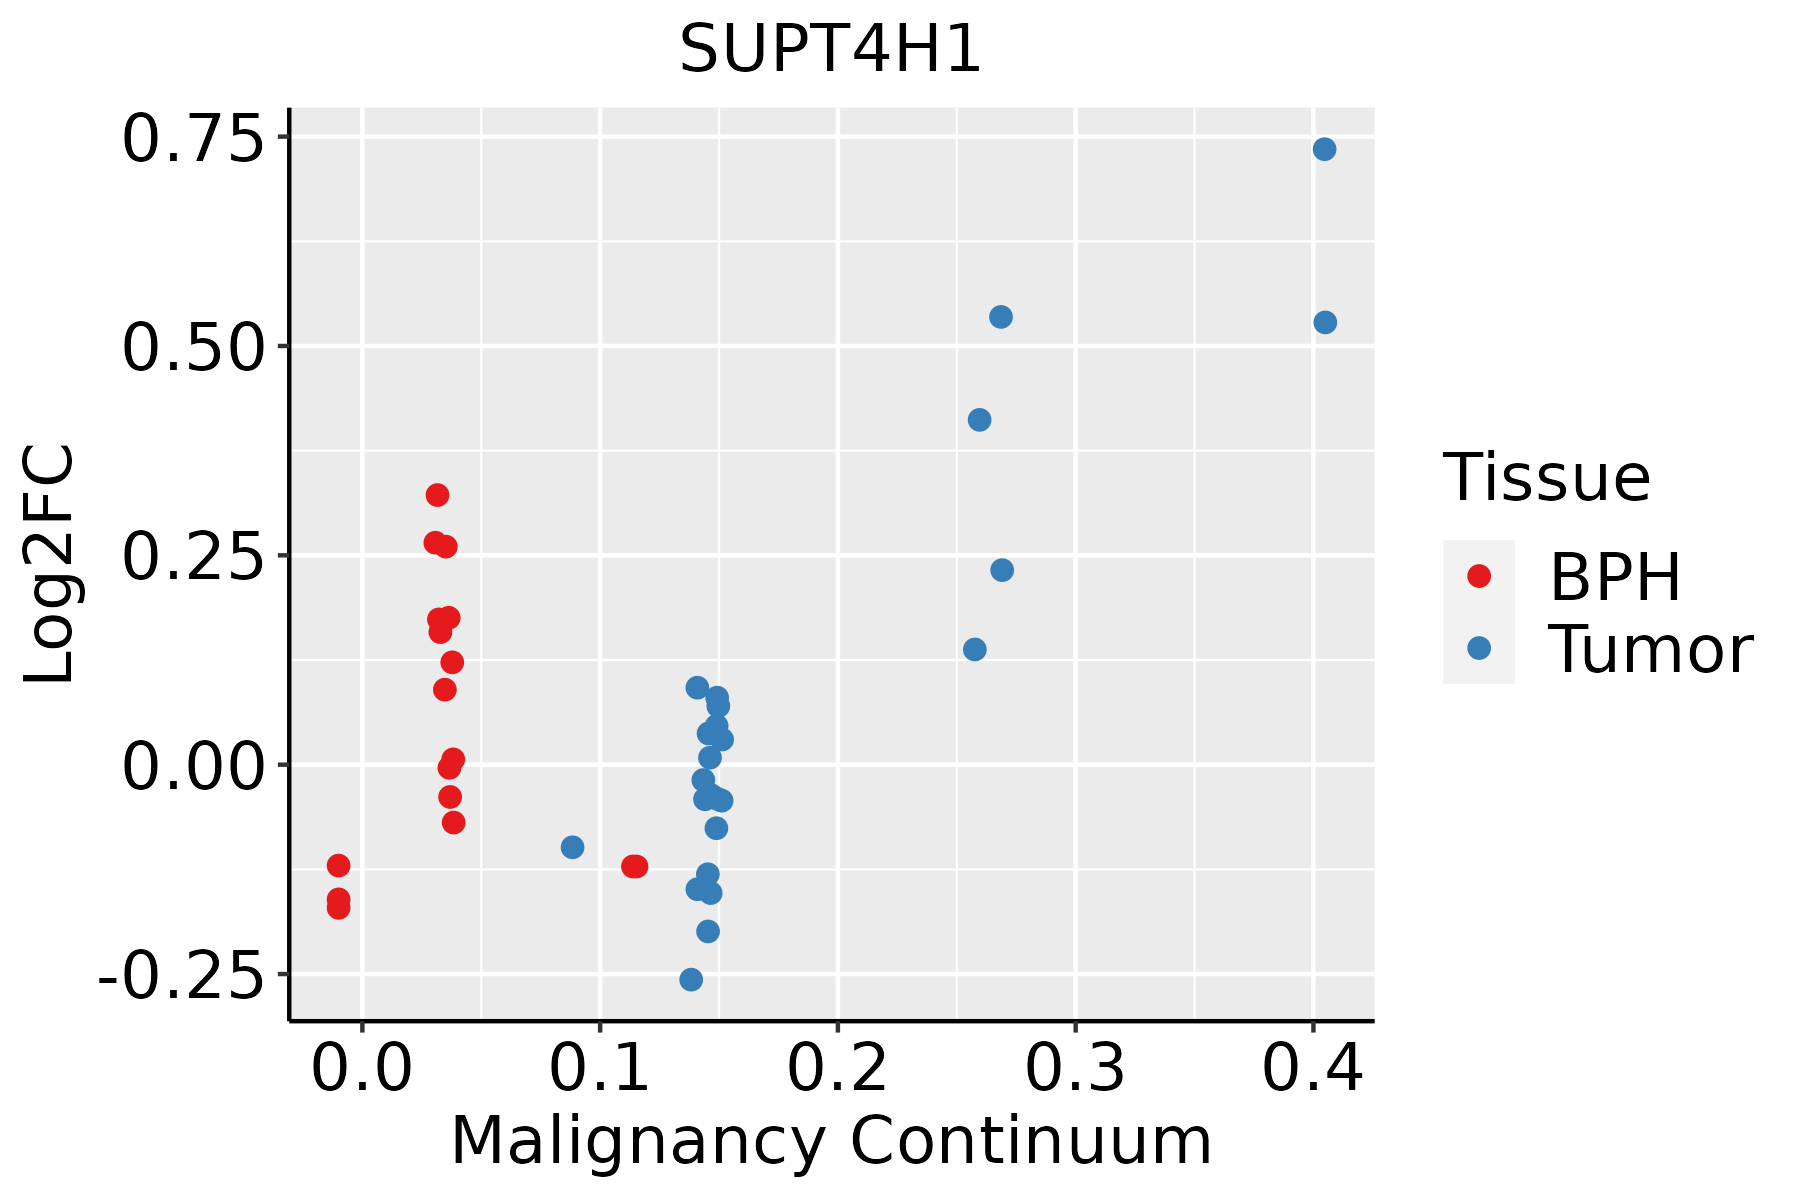 | BPH: Benign Prostatic Hyperplasia |
| Skin | 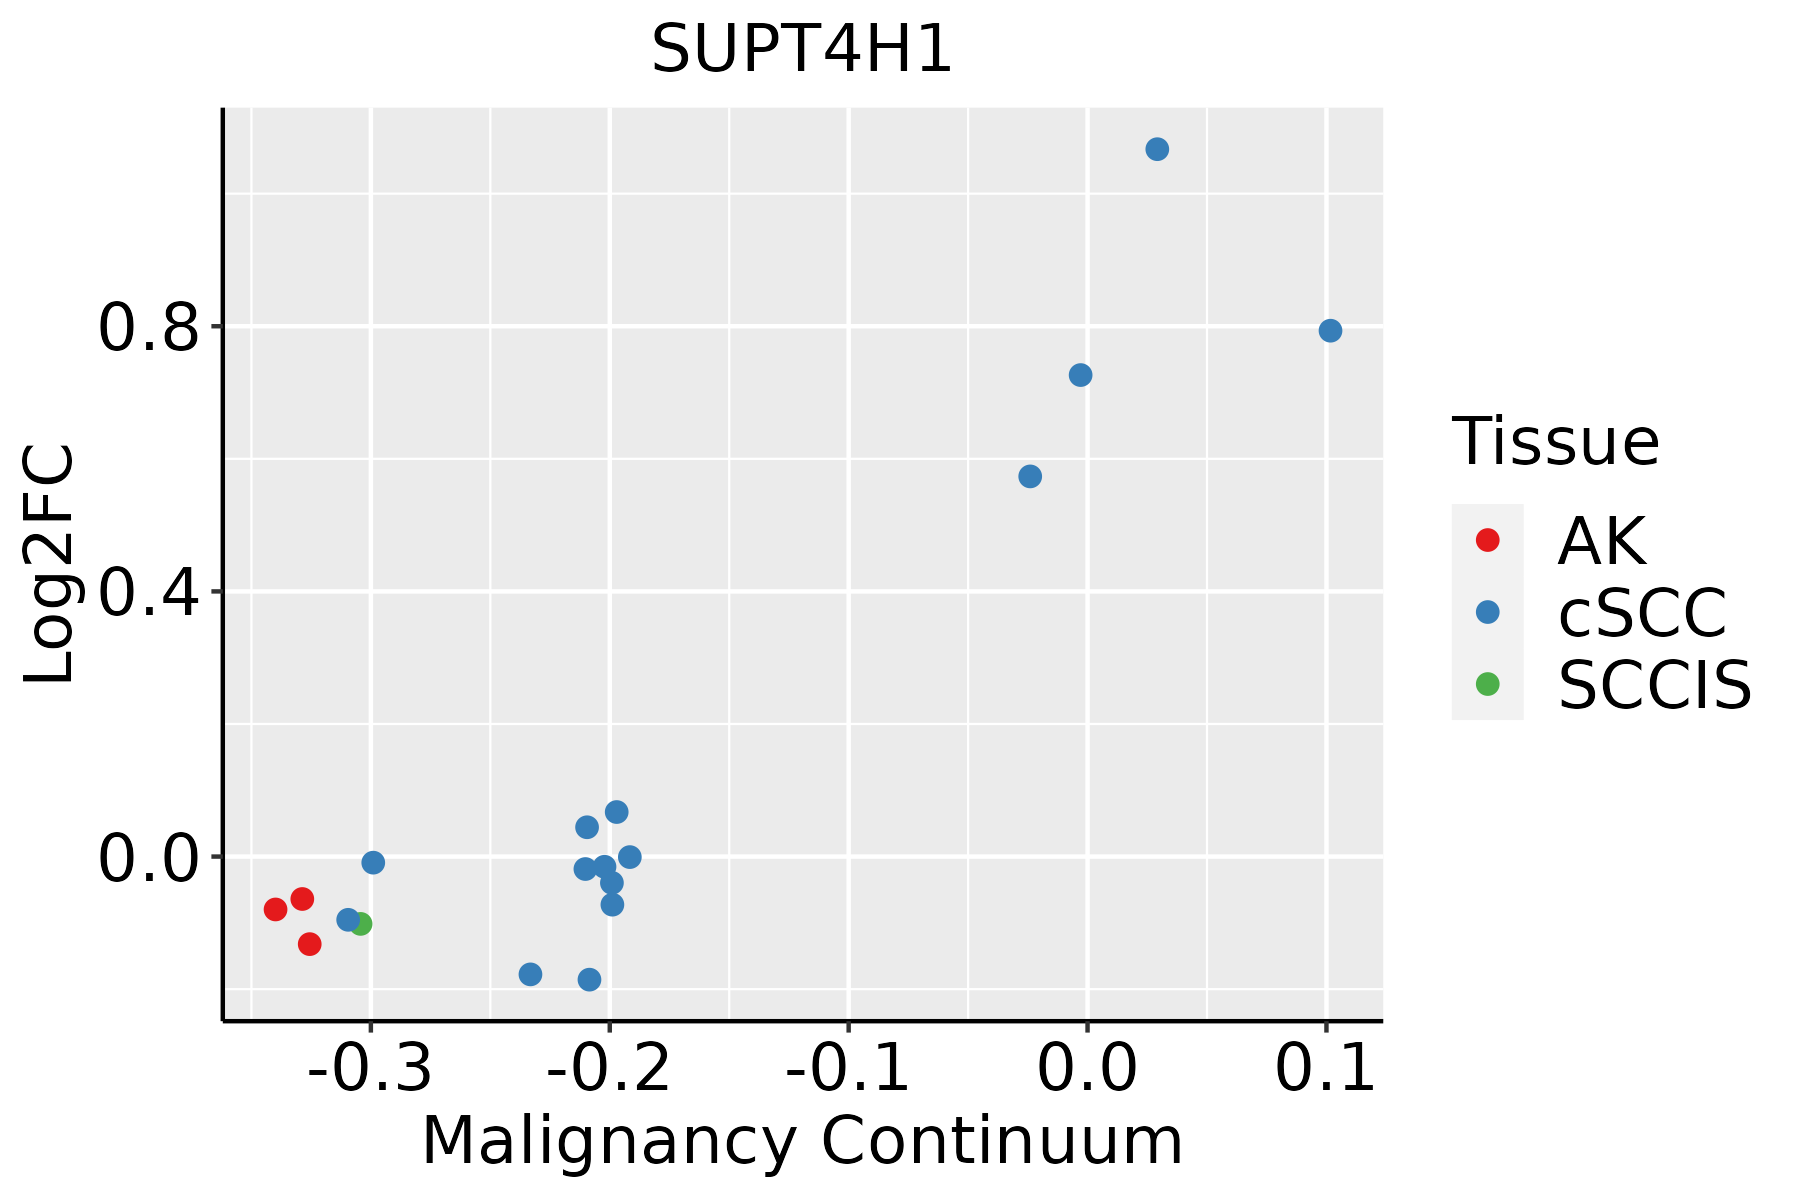 | AK: Actinic keratosis |
| cSCC: Cutaneous squamous cell carcinoma | ||
| SCCIS:squamous cell carcinoma in situ | ||
| Thyroid |  | ATC: Anaplastic thyroid cancer |
| HT: Hashimoto's thyroiditis | ||
| PTC: Papillary thyroid cancer |
| ∗log2FC in expression of this searched gene in stem-like cells from each diseased tissue sample relative to stem-like cells in normal samples in each tissue plotted against the malignancy continuum. Samples are colored based on if they are from different disease stage. |
Top |
Malignant transformation related pathway analysis |
| Find out the enriched GO biological processes and KEGG pathways involved in transition from healthy to precancer to cancer |
| Tissue | Disease Stage | Enriched GO biological Processes |
| Colorectum | AD |  |
| Colorectum | SER |  |
| Colorectum | MSS |  |
| Colorectum | MSI-H |  |
| Colorectum | FAP |  |
| ∗Top 15 enriched GO BP terms are showed in the bar plot of each disease state in each tissue. Each row represents a significant GO biological process which is colored according to the -log10(p.adjust). |
| Page: 1 2 3 4 5 6 7 8 9 |
| GO ID | Tissue | Disease Stage | Description | Gene Ratio | Bg Ratio | pvalue | p.adjust | Count |
| GO:0006325 | Colorectum | AD | chromatin organization | 119/3918 | 409/18723 | 4.85e-05 | 8.33e-04 | 119 |
| GO:0032786 | Colorectum | AD | positive regulation of DNA-templated transcription, elongation | 13/3918 | 27/18723 | 1.47e-03 | 1.25e-02 | 13 |
| GO:0006354 | Colorectum | AD | DNA-templated transcription, elongation | 31/3918 | 91/18723 | 2.46e-03 | 1.90e-02 | 31 |
| GO:0006368 | Colorectum | AD | transcription elongation from RNA polymerase II promoter | 24/3918 | 69/18723 | 5.35e-03 | 3.52e-02 | 24 |
| GO:00063251 | Colorectum | SER | chromatin organization | 89/2897 | 409/18723 | 4.15e-04 | 6.17e-03 | 89 |
| GO:00063252 | Colorectum | MSS | chromatin organization | 107/3467 | 409/18723 | 7.22e-05 | 1.21e-03 | 107 |
| GO:00063541 | Colorectum | MSS | DNA-templated transcription, elongation | 29/3467 | 91/18723 | 1.52e-03 | 1.39e-02 | 29 |
| GO:00327861 | Colorectum | MSS | positive regulation of DNA-templated transcription, elongation | 12/3467 | 27/18723 | 1.74e-03 | 1.55e-02 | 12 |
| GO:00063681 | Colorectum | MSS | transcription elongation from RNA polymerase II promoter | 22/3467 | 69/18723 | 5.31e-03 | 3.62e-02 | 22 |
| GO:00063253 | Colorectum | FAP | chromatin organization | 84/2622 | 409/18723 | 1.62e-04 | 2.47e-03 | 84 |
| GO:00327862 | Colorectum | FAP | positive regulation of DNA-templated transcription, elongation | 11/2622 | 27/18723 | 5.93e-04 | 6.58e-03 | 11 |
| GO:00063682 | Colorectum | FAP | transcription elongation from RNA polymerase II promoter | 20/2622 | 69/18723 | 9.25e-04 | 9.26e-03 | 20 |
| GO:00063542 | Colorectum | FAP | DNA-templated transcription, elongation | 24/2622 | 91/18723 | 1.32e-03 | 1.22e-02 | 24 |
| GO:00063258 | Endometrium | AEH | chromatin organization | 64/2100 | 409/18723 | 3.69e-03 | 2.52e-02 | 64 |
| GO:000632513 | Endometrium | EEC | chromatin organization | 65/2168 | 409/18723 | 4.98e-03 | 3.14e-02 | 65 |
| GO:000632516 | Esophagus | HGIN | chromatin organization | 92/2587 | 409/18723 | 1.05e-06 | 4.16e-05 | 92 |
| GO:00063687 | Esophagus | HGIN | transcription elongation from RNA polymerase II promoter | 24/2587 | 69/18723 | 8.93e-06 | 2.64e-04 | 24 |
| GO:00063548 | Esophagus | HGIN | DNA-templated transcription, elongation | 27/2587 | 91/18723 | 6.62e-05 | 1.52e-03 | 27 |
| GO:00342435 | Esophagus | HGIN | regulation of transcription elongation from RNA polymerase II promoter | 13/2587 | 32/18723 | 1.72e-04 | 3.32e-03 | 13 |
| GO:00327866 | Esophagus | HGIN | positive regulation of DNA-templated transcription, elongation | 11/2587 | 27/18723 | 5.28e-04 | 7.56e-03 | 11 |
| Page: 1 2 3 4 5 |
| Pathway ID | Tissue | Disease Stage | Description | Gene Ratio | Bg Ratio | pvalue | p.adjust | qvalue | Count |
| hsa03250 | Colorectum | MSS | Viral life cycle - HIV-1 | 23/1875 | 63/8465 | 6.55e-03 | 2.64e-02 | 1.62e-02 | 23 |
| hsa032501 | Colorectum | MSS | Viral life cycle - HIV-1 | 23/1875 | 63/8465 | 6.55e-03 | 2.64e-02 | 1.62e-02 | 23 |
| hsa032509 | Esophagus | ESCC | Viral life cycle - HIV-1 | 54/4205 | 63/8465 | 2.01e-09 | 2.17e-08 | 1.11e-08 | 54 |
| hsa0325014 | Esophagus | ESCC | Viral life cycle - HIV-1 | 54/4205 | 63/8465 | 2.01e-09 | 2.17e-08 | 1.11e-08 | 54 |
| hsa032502 | Liver | HCC | Viral life cycle - HIV-1 | 46/4020 | 63/8465 | 3.25e-05 | 1.88e-04 | 1.04e-04 | 46 |
| hsa0325011 | Liver | HCC | Viral life cycle - HIV-1 | 46/4020 | 63/8465 | 3.25e-05 | 1.88e-04 | 1.04e-04 | 46 |
| hsa032508 | Oral cavity | OSCC | Viral life cycle - HIV-1 | 45/3704 | 63/8465 | 7.62e-06 | 3.59e-05 | 1.83e-05 | 45 |
| hsa0325013 | Oral cavity | OSCC | Viral life cycle - HIV-1 | 45/3704 | 63/8465 | 7.62e-06 | 3.59e-05 | 1.83e-05 | 45 |
| hsa0325022 | Oral cavity | LP | Viral life cycle - HIV-1 | 32/2418 | 63/8465 | 1.55e-04 | 9.08e-04 | 5.86e-04 | 32 |
| hsa0325031 | Oral cavity | LP | Viral life cycle - HIV-1 | 32/2418 | 63/8465 | 1.55e-04 | 9.08e-04 | 5.86e-04 | 32 |
| hsa032504 | Prostate | BPH | Viral life cycle - HIV-1 | 24/1718 | 63/8465 | 8.32e-04 | 3.98e-03 | 2.46e-03 | 24 |
| hsa0325012 | Prostate | BPH | Viral life cycle - HIV-1 | 24/1718 | 63/8465 | 8.32e-04 | 3.98e-03 | 2.46e-03 | 24 |
| hsa0325021 | Prostate | Tumor | Viral life cycle - HIV-1 | 25/1791 | 63/8465 | 6.13e-04 | 3.07e-03 | 1.91e-03 | 25 |
| hsa032503 | Prostate | Tumor | Viral life cycle - HIV-1 | 25/1791 | 63/8465 | 6.13e-04 | 3.07e-03 | 1.91e-03 | 25 |
| Page: 1 |
Top |
Cell-cell communication analysis |
| Identification of potential cell-cell interactions between two cell types and their ligand-receptor pairs for different disease states |
| Ligand | Receptor | LRpair | Pathway | Tissue | Disease Stage |
| Page: 1 |
Top |
Single-cell gene regulatory network inference analysis |
| Find out the significant the regulons (TFs) and the target genes of each regulon across cell types for different disease states |
| TF | Cell Type | Tissue | Disease Stage | Target Gene | RSS | Regulon Activity |
| ∗The dot plots of a searched regulon are shown for all cell subpopulations in each disease state of each tissue based on the regulon specific score inferred using pySCENIC and by calculating the average expression. |
| Page: 1 |
Top |
Somatic mutation of malignant transformation related genes |
| Annotation of somatic variants for genes involved in malignant transformation |
| Hugo Symbol | Variant Class | Variant Classification | dbSNP RS | HGVSc | HGVSp | HGVSp Short | SWISSPROT | BIOTYPE | SIFT | PolyPhen | Tumor Sample Barcode | Tissue | Histology | Sex | Age | Stage | Therapy Types | Drugs | Outcome |
| SUPT4H1 | SNV | Missense_Mutation | rs771855308 | c.185N>T | p.Ala62Val | p.A62V | P63272 | protein_coding | deleterious(0.02) | possibly_damaging(0.592) | TCGA-AA-3864-01 | Colorectum | colon adenocarcinoma | Male | >=65 | I/II | Unknown | Unknown | SD |
| SUPT4H1 | SNV | Missense_Mutation | novel | c.275N>A | p.Arg92His | p.R92H | P63272 | protein_coding | deleterious(0) | benign(0.26) | TCGA-AX-A1C9-01 | Endometrium | uterine corpus endometrioid carcinoma | Female | >=65 | I/II | Unknown | Unknown | SD |
| SUPT4H1 | SNV | Missense_Mutation | c.203N>G | p.Asp68Gly | p.D68G | P63272 | protein_coding | deleterious(0.01) | benign(0.078) | TCGA-B5-A11E-01 | Endometrium | uterine corpus endometrioid carcinoma | Female | <65 | I/II | Unknown | Unknown | SD | |
| SUPT4H1 | SNV | Missense_Mutation | novel | c.76N>T | p.Asp26Tyr | p.D26Y | P63272 | protein_coding | deleterious(0.01) | probably_damaging(0.96) | TCGA-EO-A22T-01 | Endometrium | uterine corpus endometrioid carcinoma | Female | <65 | I/II | Unknown | Unknown | SD |
| SUPT4H1 | SNV | Missense_Mutation | novel | c.295N>T | p.Arg99Trp | p.R99W | P63272 | protein_coding | deleterious(0) | possibly_damaging(0.854) | TCGA-EO-A3AZ-01 | Endometrium | uterine corpus endometrioid carcinoma | Female | >=65 | I/II | Unknown | Unknown | SD |
| SUPT4H1 | SNV | Missense_Mutation | rs771855308 | c.185N>T | p.Ala62Val | p.A62V | P63272 | protein_coding | deleterious(0.02) | possibly_damaging(0.592) | TCGA-EY-A549-01 | Endometrium | uterine corpus endometrioid carcinoma | Female | >=65 | I/II | Unknown | Unknown | SD |
| SUPT4H1 | SNV | Missense_Mutation | c.290T>A | p.Ile97Asn | p.I97N | P63272 | protein_coding | deleterious(0) | possibly_damaging(0.622) | TCGA-DD-A4NV-01 | Liver | liver hepatocellular carcinoma | Male | <65 | III/IV | Unknown | Unknown | SD | |
| SUPT4H1 | SNV | Missense_Mutation | c.188T>C | p.Met63Thr | p.M63T | P63272 | protein_coding | deleterious(0.03) | possibly_damaging(0.708) | TCGA-BR-7707-01 | Stomach | stomach adenocarcinoma | Female | >=65 | I/II | Unknown | Unknown | SD |
| Page: 1 |
Top |
Related drugs of malignant transformation related genes |
| Identification of chemicals and drugs interact with genes involved in malignant transfromation |
| (DGIdb 4.0) |
| Entrez ID | Symbol | Category | Interaction Types | Drug Claim Name | Drug Name | PMIDs |
| Page: 1 |

Copyright 2023-Present -The University of Texas Health Science Center at Houston |