
|
|||||
|
 | |
| |
| |
| |
| |
| |
|
Gene: SUPT3H |
Gene summary for SUPT3H |
| Gene information | Species | Human | Gene symbol | SUPT3H | Gene ID | 8464 |
| Gene name | SPT3 homolog, SAGA and STAGA complex component | |
| Gene Alias | SPT3 | |
| Cytomap | 6p21.1 | |
| Gene Type | protein-coding | GO ID | GO:0006139 | UniProtAcc | B4E1H0 |
Top |
Malignant transformation analysis |
| Identification of the aberrant gene expression in precancerous and cancerous lesions by comparing the gene expression of stem-like cells in diseased tissues with normal stem cells |
| Entrez ID | Symbol | Replicates | Species | Organ | Tissue | Adj P-value | Log2FC | Malignancy |
| 8464 | SUPT3H | HTA11_3410_2000001011 | Human | Colorectum | AD | 6.93e-10 | -4.03e-01 | 0.0155 |
| 8464 | SUPT3H | HTA11_2487_2000001011 | Human | Colorectum | SER | 1.30e-03 | -4.42e-01 | -0.1808 |
| 8464 | SUPT3H | HTA11_1938_2000001011 | Human | Colorectum | AD | 2.46e-02 | -4.14e-01 | -0.0811 |
| 8464 | SUPT3H | HTA11_347_2000001011 | Human | Colorectum | AD | 5.59e-09 | -3.90e-01 | -0.1954 |
| 8464 | SUPT3H | HTA11_3361_2000001011 | Human | Colorectum | AD | 7.56e-05 | -4.90e-01 | -0.1207 |
| 8464 | SUPT3H | HTA11_696_2000001011 | Human | Colorectum | AD | 2.54e-11 | -4.50e-01 | -0.1464 |
| 8464 | SUPT3H | HTA11_866_2000001011 | Human | Colorectum | AD | 4.53e-08 | -4.33e-01 | -0.1001 |
| 8464 | SUPT3H | HTA11_866_3004761011 | Human | Colorectum | AD | 1.80e-09 | -3.88e-01 | 0.096 |
| 8464 | SUPT3H | HTA11_10711_2000001011 | Human | Colorectum | AD | 2.35e-02 | -3.38e-01 | 0.0338 |
| 8464 | SUPT3H | HTA11_7696_3000711011 | Human | Colorectum | AD | 1.15e-03 | -3.46e-01 | 0.0674 |
| 8464 | SUPT3H | HTA11_99999971662_82457 | Human | Colorectum | MSS | 1.38e-02 | -2.69e-01 | 0.3859 |
| 8464 | SUPT3H | HTA11_99999974143_84620 | Human | Colorectum | MSS | 9.11e-04 | -3.18e-01 | 0.3005 |
| 8464 | SUPT3H | A015-C-203 | Human | Colorectum | FAP | 3.31e-10 | -2.29e-01 | -0.1294 |
| 8464 | SUPT3H | A002-C-201 | Human | Colorectum | FAP | 2.58e-03 | -1.71e-01 | 0.0324 |
| 8464 | SUPT3H | A001-C-108 | Human | Colorectum | FAP | 4.27e-02 | -1.18e-01 | -0.0272 |
| 8464 | SUPT3H | A002-C-205 | Human | Colorectum | FAP | 9.93e-09 | -2.87e-01 | -0.1236 |
| 8464 | SUPT3H | A015-C-006 | Human | Colorectum | FAP | 2.93e-05 | -2.07e-01 | -0.0994 |
| 8464 | SUPT3H | A002-C-114 | Human | Colorectum | FAP | 5.40e-08 | -3.54e-01 | -0.1561 |
| 8464 | SUPT3H | A015-C-104 | Human | Colorectum | FAP | 1.18e-11 | -2.80e-01 | -0.1899 |
| 8464 | SUPT3H | A002-C-016 | Human | Colorectum | FAP | 8.21e-07 | -2.31e-01 | 0.0521 |
| Page: 1 2 3 4 5 6 7 8 |
| Tissue | Expression Dynamics | Abbreviation |
| Colorectum (GSE201348) |  | FAP: Familial adenomatous polyposis |
| CRC: Colorectal cancer | ||
| Colorectum (HTA11) |  | AD: Adenomas |
| SER: Sessile serrated lesions | ||
| MSI-H: Microsatellite-high colorectal cancer | ||
| MSS: Microsatellite stable colorectal cancer | ||
| Endometrium |  | AEH: Atypical endometrial hyperplasia |
| EEC: Endometrioid Cancer | ||
| Esophagus | 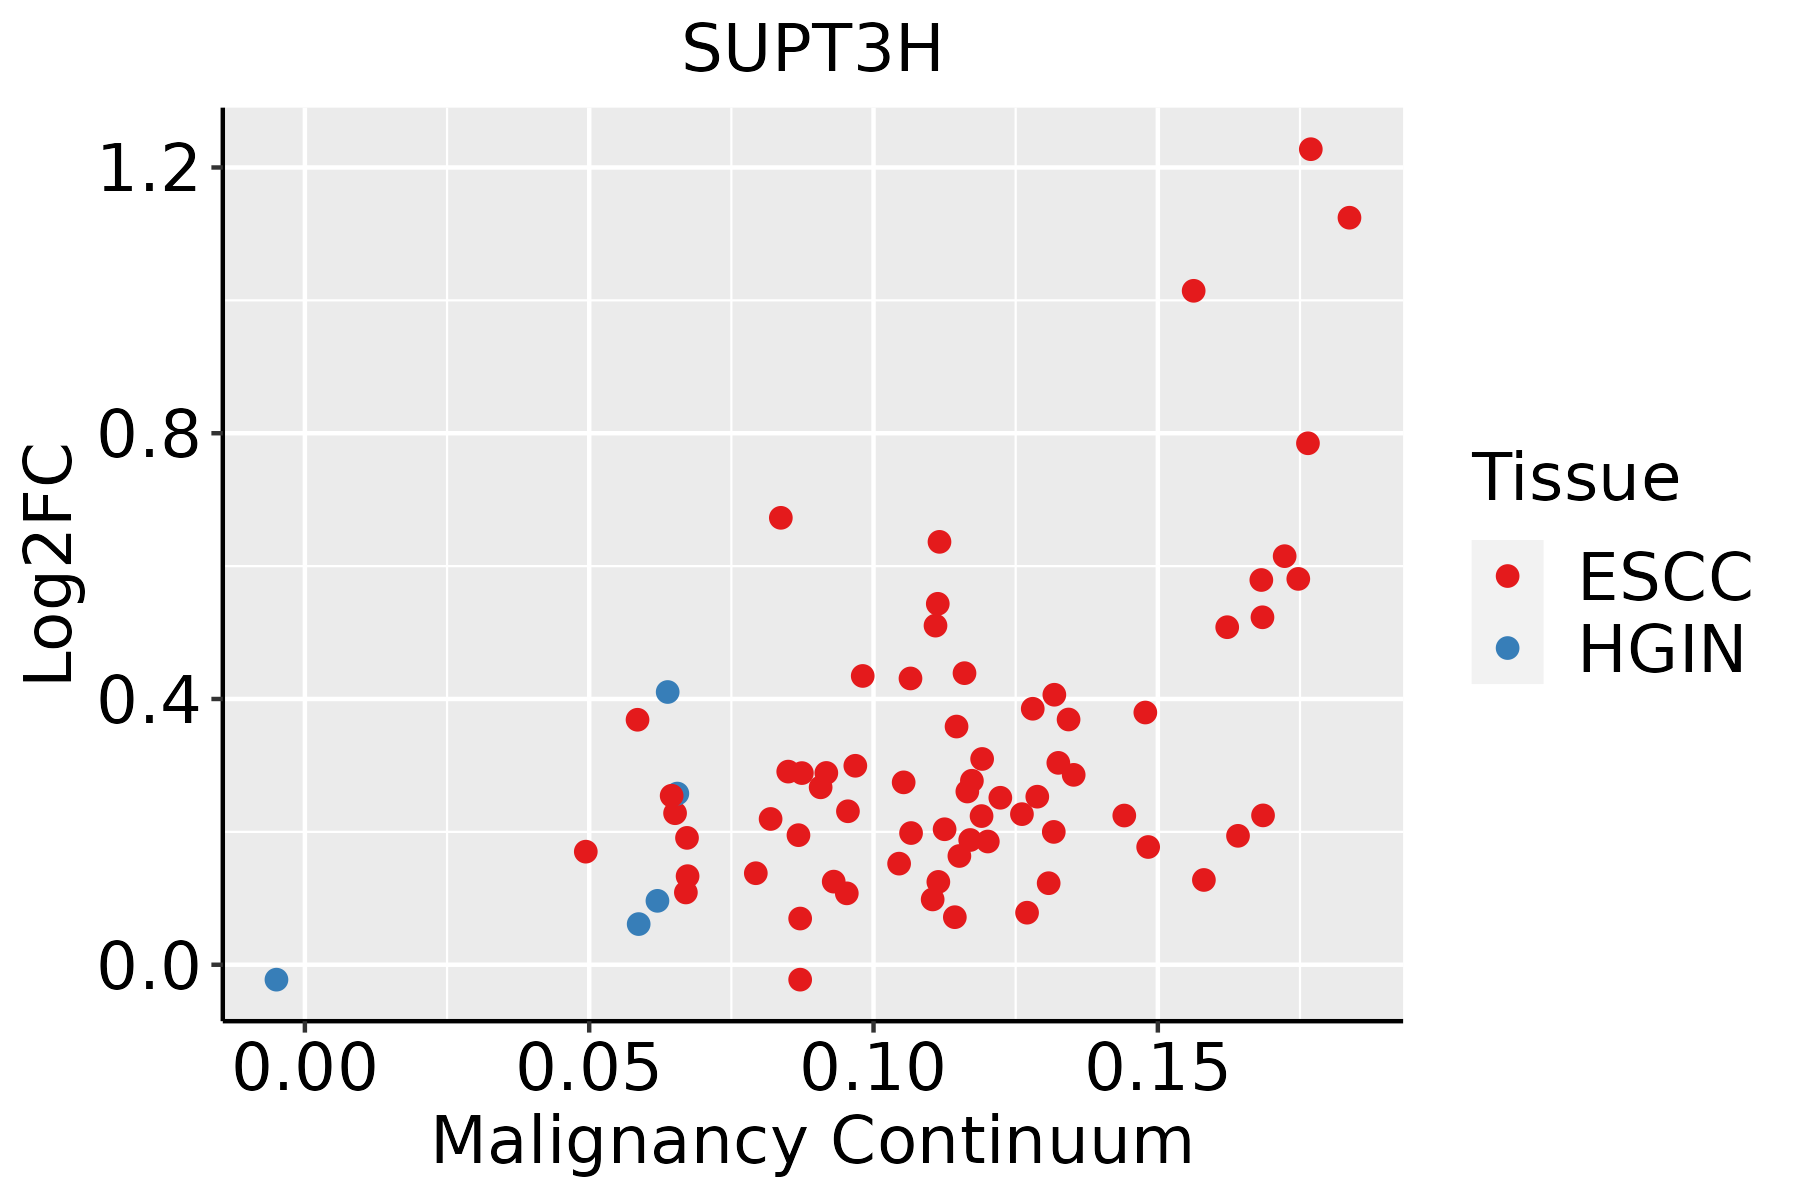 | ESCC: Esophageal squamous cell carcinoma |
| HGIN: High-grade intraepithelial neoplasias | ||
| LGIN: Low-grade intraepithelial neoplasias | ||
| Lung | 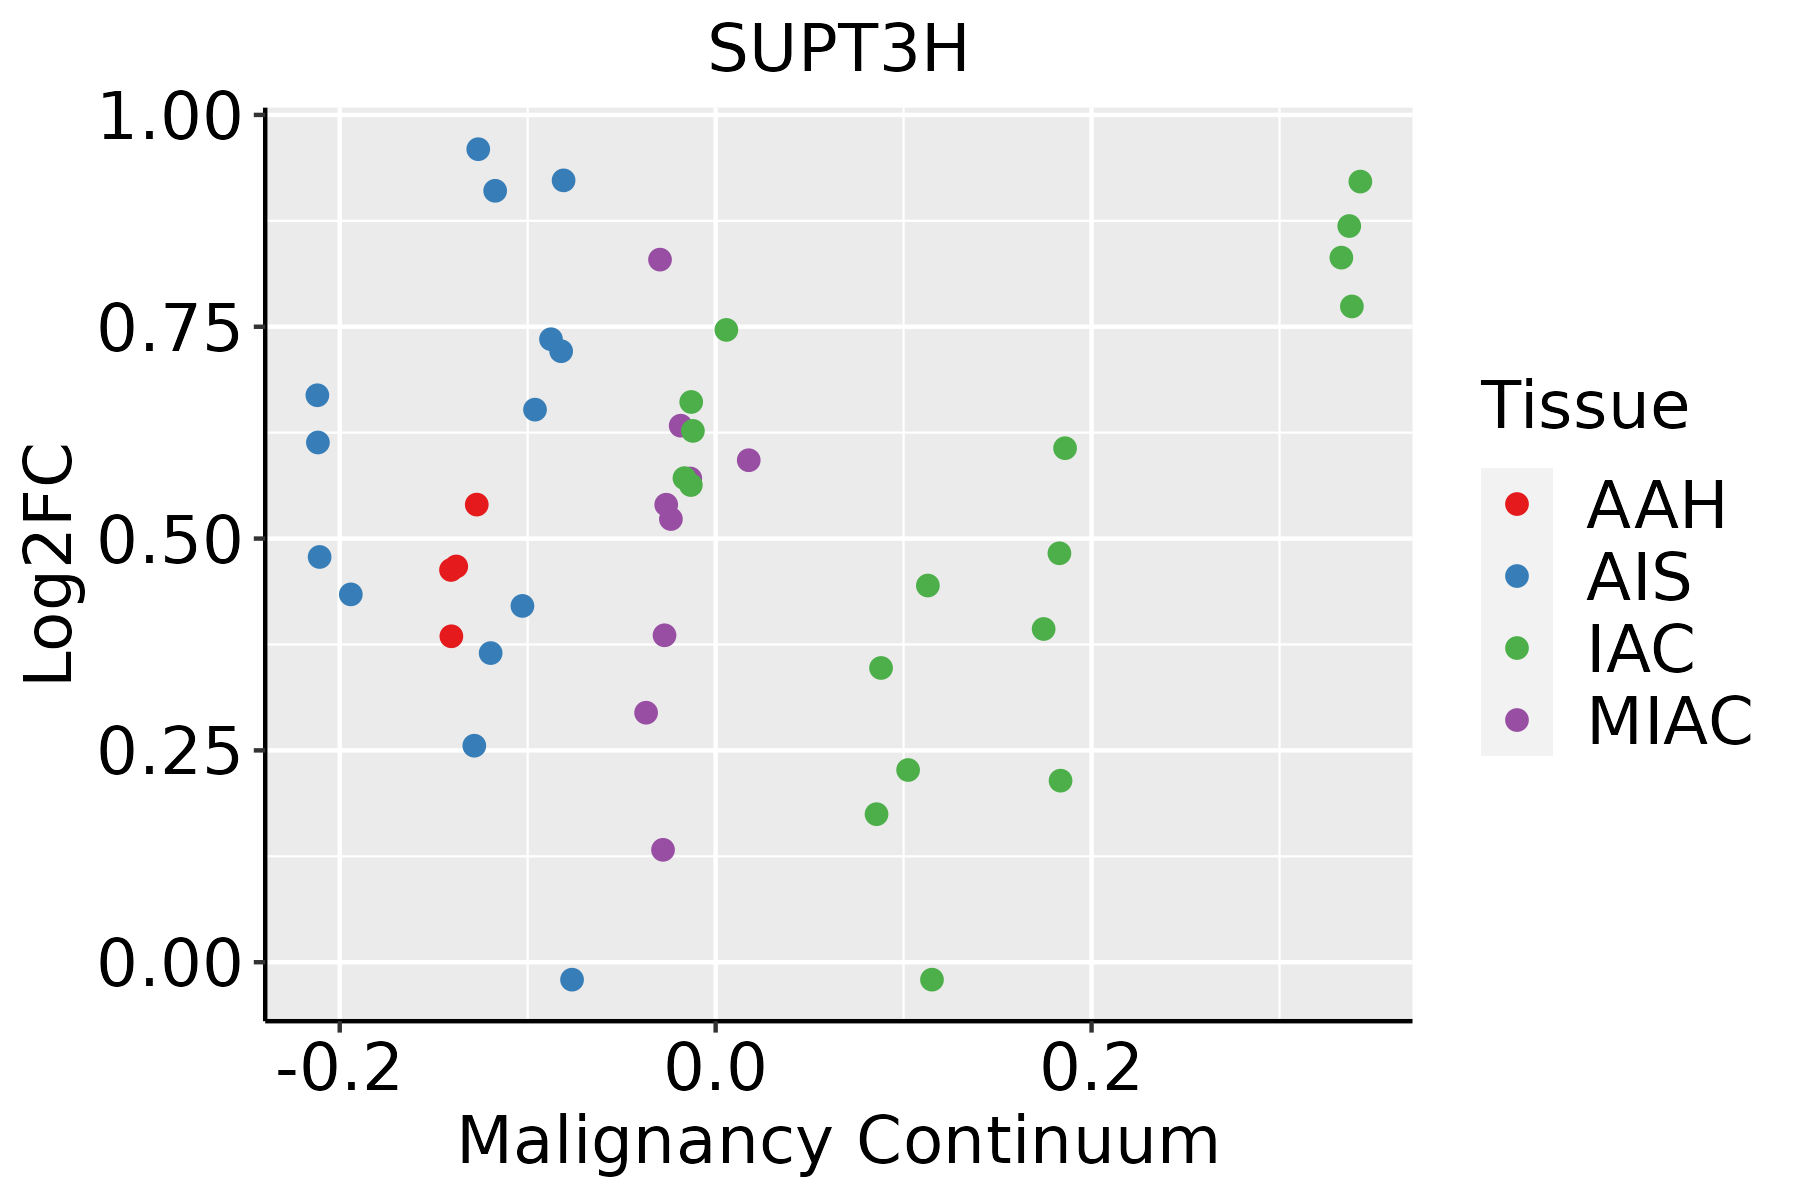 | AAH: Atypical adenomatous hyperplasia |
| AIS: Adenocarcinoma in situ | ||
| IAC: Invasive lung adenocarcinoma | ||
| MIA: Minimally invasive adenocarcinoma | ||
| Oral Cavity | 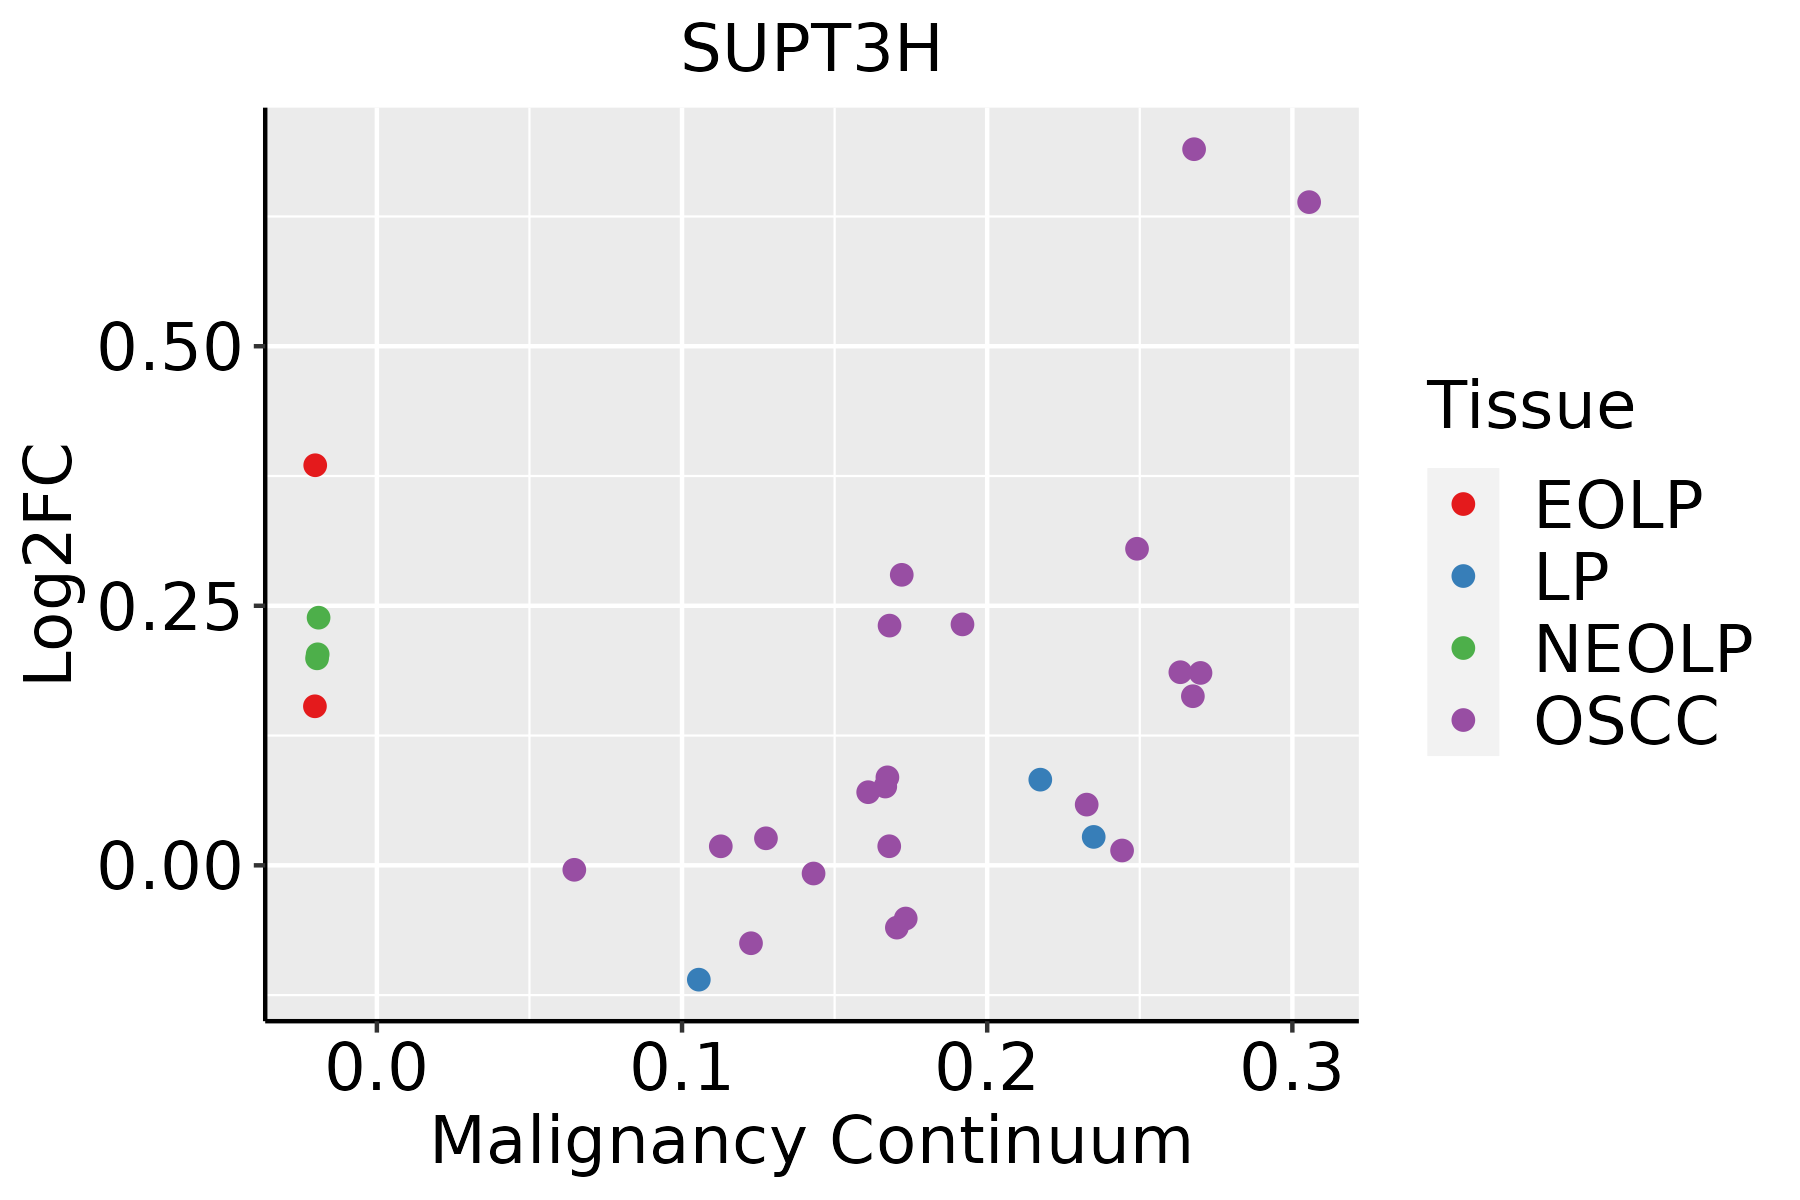 | EOLP: Erosive Oral lichen planus |
| LP: leukoplakia | ||
| NEOLP: Non-erosive oral lichen planus | ||
| OSCC: Oral squamous cell carcinoma | ||
| Prostate |  | BPH: Benign Prostatic Hyperplasia |
| ∗log2FC in expression of this searched gene in stem-like cells from each diseased tissue sample relative to stem-like cells in normal samples in each tissue plotted against the malignancy continuum. Samples are colored based on if they are from different disease stage. |
Top |
Malignant transformation related pathway analysis |
| Find out the enriched GO biological processes and KEGG pathways involved in transition from healthy to precancer to cancer |
| Tissue | Disease Stage | Enriched GO biological Processes |
| Colorectum | AD |  |
| Colorectum | SER |  |
| Colorectum | MSS |  |
| Colorectum | MSI-H |  |
| Colorectum | FAP |  |
| ∗Top 15 enriched GO BP terms are showed in the bar plot of each disease state in each tissue. Each row represents a significant GO biological process which is colored according to the -log10(p.adjust). |
| Page: 1 2 3 4 5 6 7 8 9 |
| GO ID | Tissue | Disease Stage | Description | Gene Ratio | Bg Ratio | pvalue | p.adjust | Count |
| GO:0016570 | Colorectum | MSS | histone modification | 113/3467 | 463/18723 | 8.37e-04 | 8.68e-03 | 113 |
| GO:00165701 | Colorectum | FAP | histone modification | 94/2622 | 463/18723 | 1.06e-04 | 1.76e-03 | 94 |
| GO:00165702 | Colorectum | CRC | histone modification | 75/2078 | 463/18723 | 4.95e-04 | 7.06e-03 | 75 |
| GO:00182057 | Esophagus | HGIN | peptidyl-lysine modification | 88/2587 | 376/18723 | 2.99e-07 | 1.39e-05 | 88 |
| GO:00165708 | Esophagus | HGIN | histone modification | 92/2587 | 463/18723 | 1.70e-04 | 3.30e-03 | 92 |
| GO:00064735 | Esophagus | HGIN | protein acetylation | 45/2587 | 201/18723 | 6.17e-04 | 8.58e-03 | 45 |
| GO:00183945 | Esophagus | HGIN | peptidyl-lysine acetylation | 39/2587 | 169/18723 | 7.46e-04 | 9.90e-03 | 39 |
| GO:00435435 | Esophagus | HGIN | protein acylation | 51/2587 | 243/18723 | 1.33e-03 | 1.57e-02 | 51 |
| GO:00064755 | Esophagus | HGIN | internal protein amino acid acetylation | 36/2587 | 160/18723 | 1.87e-03 | 2.01e-02 | 36 |
| GO:00183935 | Esophagus | HGIN | internal peptidyl-lysine acetylation | 35/2587 | 158/18723 | 2.82e-03 | 2.75e-02 | 35 |
| GO:00706463 | Esophagus | HGIN | protein modification by small protein removal | 34/2587 | 157/18723 | 4.68e-03 | 4.02e-02 | 34 |
| GO:001657015 | Esophagus | ESCC | histone modification | 323/8552 | 463/18723 | 2.61e-26 | 7.88e-24 | 323 |
| GO:001820514 | Esophagus | ESCC | peptidyl-lysine modification | 259/8552 | 376/18723 | 3.90e-20 | 5.26e-18 | 259 |
| GO:001839413 | Esophagus | ESCC | peptidyl-lysine acetylation | 123/8552 | 169/18723 | 6.58e-13 | 2.94e-11 | 123 |
| GO:004354313 | Esophagus | ESCC | protein acylation | 165/8552 | 243/18723 | 1.69e-12 | 7.14e-11 | 165 |
| GO:000647313 | Esophagus | ESCC | protein acetylation | 140/8552 | 201/18723 | 4.37e-12 | 1.69e-10 | 140 |
| GO:001839313 | Esophagus | ESCC | internal peptidyl-lysine acetylation | 114/8552 | 158/18723 | 1.16e-11 | 4.24e-10 | 114 |
| GO:000647513 | Esophagus | ESCC | internal protein amino acid acetylation | 115/8552 | 160/18723 | 1.43e-11 | 5.08e-10 | 115 |
| GO:00165735 | Esophagus | ESCC | histone acetylation | 110/8552 | 152/18723 | 1.95e-11 | 6.81e-10 | 110 |
| GO:00439662 | Esophagus | ESCC | histone H3 acetylation | 43/8552 | 61/18723 | 7.57e-05 | 5.67e-04 | 43 |
| Page: 1 2 3 4 |
| Pathway ID | Tissue | Disease Stage | Description | Gene Ratio | Bg Ratio | pvalue | p.adjust | qvalue | Count |
| hsa05202 | Colorectum | FAP | Transcriptional misregulation in cancer | 45/1404 | 193/8465 | 9.19e-03 | 3.33e-02 | 2.03e-02 | 45 |
| hsa052021 | Colorectum | FAP | Transcriptional misregulation in cancer | 45/1404 | 193/8465 | 9.19e-03 | 3.33e-02 | 2.03e-02 | 45 |
| hsa052028 | Esophagus | ESCC | Transcriptional misregulation in cancer | 116/4205 | 193/8465 | 2.08e-03 | 5.95e-03 | 3.05e-03 | 116 |
| hsa0520213 | Esophagus | ESCC | Transcriptional misregulation in cancer | 116/4205 | 193/8465 | 2.08e-03 | 5.95e-03 | 3.05e-03 | 116 |
| hsa052026 | Lung | IAC | Transcriptional misregulation in cancer | 40/1053 | 193/8465 | 6.90e-04 | 5.90e-03 | 3.92e-03 | 40 |
| hsa0520211 | Lung | IAC | Transcriptional misregulation in cancer | 40/1053 | 193/8465 | 6.90e-04 | 5.90e-03 | 3.92e-03 | 40 |
| hsa052022 | Lung | AIS | Transcriptional misregulation in cancer | 39/961 | 193/8465 | 2.15e-04 | 2.41e-03 | 1.54e-03 | 39 |
| hsa052023 | Lung | AIS | Transcriptional misregulation in cancer | 39/961 | 193/8465 | 2.15e-04 | 2.41e-03 | 1.54e-03 | 39 |
| hsa052024 | Lung | MIAC | Transcriptional misregulation in cancer | 22/507 | 193/8465 | 2.64e-03 | 2.26e-02 | 1.64e-02 | 22 |
| hsa052025 | Lung | MIAC | Transcriptional misregulation in cancer | 22/507 | 193/8465 | 2.64e-03 | 2.26e-02 | 1.64e-02 | 22 |
| hsa052027 | Prostate | BPH | Transcriptional misregulation in cancer | 53/1718 | 193/8465 | 9.56e-03 | 2.92e-02 | 1.81e-02 | 53 |
| hsa0520212 | Prostate | BPH | Transcriptional misregulation in cancer | 53/1718 | 193/8465 | 9.56e-03 | 2.92e-02 | 1.81e-02 | 53 |
| Page: 1 |
Top |
Cell-cell communication analysis |
| Identification of potential cell-cell interactions between two cell types and their ligand-receptor pairs for different disease states |
| Ligand | Receptor | LRpair | Pathway | Tissue | Disease Stage |
| Page: 1 |
Top |
Single-cell gene regulatory network inference analysis |
| Find out the significant the regulons (TFs) and the target genes of each regulon across cell types for different disease states |
| TF | Cell Type | Tissue | Disease Stage | Target Gene | RSS | Regulon Activity |
| ∗The dot plots of a searched regulon are shown for all cell subpopulations in each disease state of each tissue based on the regulon specific score inferred using pySCENIC and by calculating the average expression. |
| Page: 1 |
Top |
Somatic mutation of malignant transformation related genes |
| Annotation of somatic variants for genes involved in malignant transformation |
| Hugo Symbol | Variant Class | Variant Classification | dbSNP RS | HGVSc | HGVSp | HGVSp Short | SWISSPROT | BIOTYPE | SIFT | PolyPhen | Tumor Sample Barcode | Tissue | Histology | Sex | Age | Stage | Therapy Types | Drugs | Outcome |
| SUPT3H | SNV | Missense_Mutation | c.414N>A | p.Ser138Arg | p.S138R | O75486 | protein_coding | tolerated(0.17) | benign(0.12) | TCGA-AR-A0U0-01 | Breast | breast invasive carcinoma | Female | >=65 | I/II | Unknown | Unknown | SD | |
| SUPT3H | SNV | Missense_Mutation | novel | c.691A>G | p.Ile231Val | p.I231V | O75486 | protein_coding | tolerated(0.27) | benign(0.046) | TCGA-D8-A142-01 | Breast | breast invasive carcinoma | Female | >=65 | I/II | Chemotherapy | cyclophosphamid | SD |
| SUPT3H | SNV | Missense_Mutation | c.975T>G | p.Phe325Leu | p.F325L | O75486 | protein_coding | tolerated(0.52) | probably_damaging(0.979) | TCGA-E2-A14R-01 | Breast | breast invasive carcinoma | Female | <65 | I/II | Chemotherapy | doxorubicin | PD | |
| SUPT3H | SNV | Missense_Mutation | novel | c.623C>T | p.Ala208Val | p.A208V | O75486 | protein_coding | tolerated(0.17) | possibly_damaging(0.521) | TCGA-GM-A4E0-01 | Breast | breast invasive carcinoma | Female | >=65 | III/IV | Chemotherapy | xeloda | CR |
| SUPT3H | insertion | Frame_Shift_Ins | novel | c.412_413insAACGG | p.Ser138LysfsTer27 | p.S138Kfs*27 | O75486 | protein_coding | TCGA-AR-A0U0-01 | Breast | breast invasive carcinoma | Female | >=65 | I/II | Unknown | Unknown | SD | ||
| SUPT3H | SNV | Missense_Mutation | rs373980353 | c.295C>T | p.Arg99Cys | p.R99C | O75486 | protein_coding | deleterious(0) | probably_damaging(0.999) | TCGA-2W-A8YY-01 | Cervix | cervical & endocervical cancer | Female | <65 | I/II | Chemotherapy | cisplatin | CR |
| SUPT3H | SNV | Missense_Mutation | rs376196104 | c.376N>A | p.Asp126Asn | p.D126N | O75486 | protein_coding | tolerated(0.12) | benign(0.375) | TCGA-AA-3510-01 | Colorectum | colon adenocarcinoma | Male | >=65 | I/II | Unknown | Unknown | SD |
| SUPT3H | SNV | Missense_Mutation | c.650G>A | p.Cys217Tyr | p.C217Y | O75486 | protein_coding | tolerated(0.06) | probably_damaging(0.929) | TCGA-AA-3950-01 | Colorectum | colon adenocarcinoma | Female | >=65 | I/II | Unknown | Unknown | SD | |
| SUPT3H | SNV | Missense_Mutation | c.386N>G | p.Asp129Gly | p.D129G | O75486 | protein_coding | deleterious(0) | possibly_damaging(0.585) | TCGA-CK-6746-01 | Colorectum | colon adenocarcinoma | Female | >=65 | I/II | Unknown | Unknown | SD | |
| SUPT3H | SNV | Missense_Mutation | c.655A>C | p.Ser219Arg | p.S219R | O75486 | protein_coding | deleterious(0.01) | possibly_damaging(0.694) | TCGA-CM-6674-01 | Colorectum | colon adenocarcinoma | Male | <65 | I/II | Unknown | Unknown | SD |
| Page: 1 2 3 4 5 |
Top |
Related drugs of malignant transformation related genes |
| Identification of chemicals and drugs interact with genes involved in malignant transfromation |
| (DGIdb 4.0) |
| Entrez ID | Symbol | Category | Interaction Types | Drug Claim Name | Drug Name | PMIDs |
| Page: 1 |

Copyright 2023-Present -The University of Texas Health Science Center at Houston |