
|
|||||
|
 | |
| |
| |
| |
| |
| |
|
Gene: SUPT20H |
Gene summary for SUPT20H |
| Gene information | Species | Human | Gene symbol | SUPT20H | Gene ID | 55578 |
| Gene name | SPT20 homolog, SAGA complex component | |
| Gene Alias | C13 | |
| Cytomap | 13q13.3 | |
| Gene Type | protein-coding | GO ID | GO:0006139 | UniProtAcc | Q8NEM7 |
Top |
Malignant transformation analysis |
| Identification of the aberrant gene expression in precancerous and cancerous lesions by comparing the gene expression of stem-like cells in diseased tissues with normal stem cells |
| Entrez ID | Symbol | Replicates | Species | Organ | Tissue | Adj P-value | Log2FC | Malignancy |
| 55578 | SUPT20H | LZE2T | Human | Esophagus | ESCC | 1.72e-03 | 3.02e-01 | 0.082 |
| 55578 | SUPT20H | LZE3D | Human | Esophagus | HGIN | 4.59e-02 | 4.24e-01 | 0.0668 |
| 55578 | SUPT20H | LZE4T | Human | Esophagus | ESCC | 1.73e-14 | 3.71e-01 | 0.0811 |
| 55578 | SUPT20H | LZE5T | Human | Esophagus | ESCC | 1.35e-05 | 4.29e-01 | 0.0514 |
| 55578 | SUPT20H | LZE7T | Human | Esophagus | ESCC | 5.06e-09 | 4.30e-01 | 0.0667 |
| 55578 | SUPT20H | LZE8T | Human | Esophagus | ESCC | 5.99e-15 | 2.46e-01 | 0.067 |
| 55578 | SUPT20H | LZE20T | Human | Esophagus | ESCC | 2.76e-03 | 1.47e-01 | 0.0662 |
| 55578 | SUPT20H | LZE21D1 | Human | Esophagus | HGIN | 2.20e-03 | 3.02e-01 | 0.0632 |
| 55578 | SUPT20H | LZE24T | Human | Esophagus | ESCC | 1.03e-19 | 3.00e-01 | 0.0596 |
| 55578 | SUPT20H | LZE21T | Human | Esophagus | ESCC | 3.78e-09 | 3.05e-01 | 0.0655 |
| 55578 | SUPT20H | LZE6T | Human | Esophagus | ESCC | 1.54e-02 | 1.43e-01 | 0.0845 |
| 55578 | SUPT20H | P1T-E | Human | Esophagus | ESCC | 2.61e-13 | 5.67e-01 | 0.0875 |
| 55578 | SUPT20H | P2T-E | Human | Esophagus | ESCC | 5.22e-43 | 5.57e-01 | 0.1177 |
| 55578 | SUPT20H | P4T-E | Human | Esophagus | ESCC | 5.86e-19 | 3.93e-01 | 0.1323 |
| 55578 | SUPT20H | P5T-E | Human | Esophagus | ESCC | 8.35e-13 | 1.67e-01 | 0.1327 |
| 55578 | SUPT20H | P8T-E | Human | Esophagus | ESCC | 3.83e-49 | 8.84e-01 | 0.0889 |
| 55578 | SUPT20H | P9T-E | Human | Esophagus | ESCC | 1.41e-14 | 3.06e-01 | 0.1131 |
| 55578 | SUPT20H | P10T-E | Human | Esophagus | ESCC | 1.34e-39 | 5.88e-01 | 0.116 |
| 55578 | SUPT20H | P11T-E | Human | Esophagus | ESCC | 3.29e-09 | 4.29e-01 | 0.1426 |
| 55578 | SUPT20H | P12T-E | Human | Esophagus | ESCC | 5.32e-22 | 3.43e-01 | 0.1122 |
| Page: 1 2 3 4 5 6 |
| Tissue | Expression Dynamics | Abbreviation |
| Esophagus | 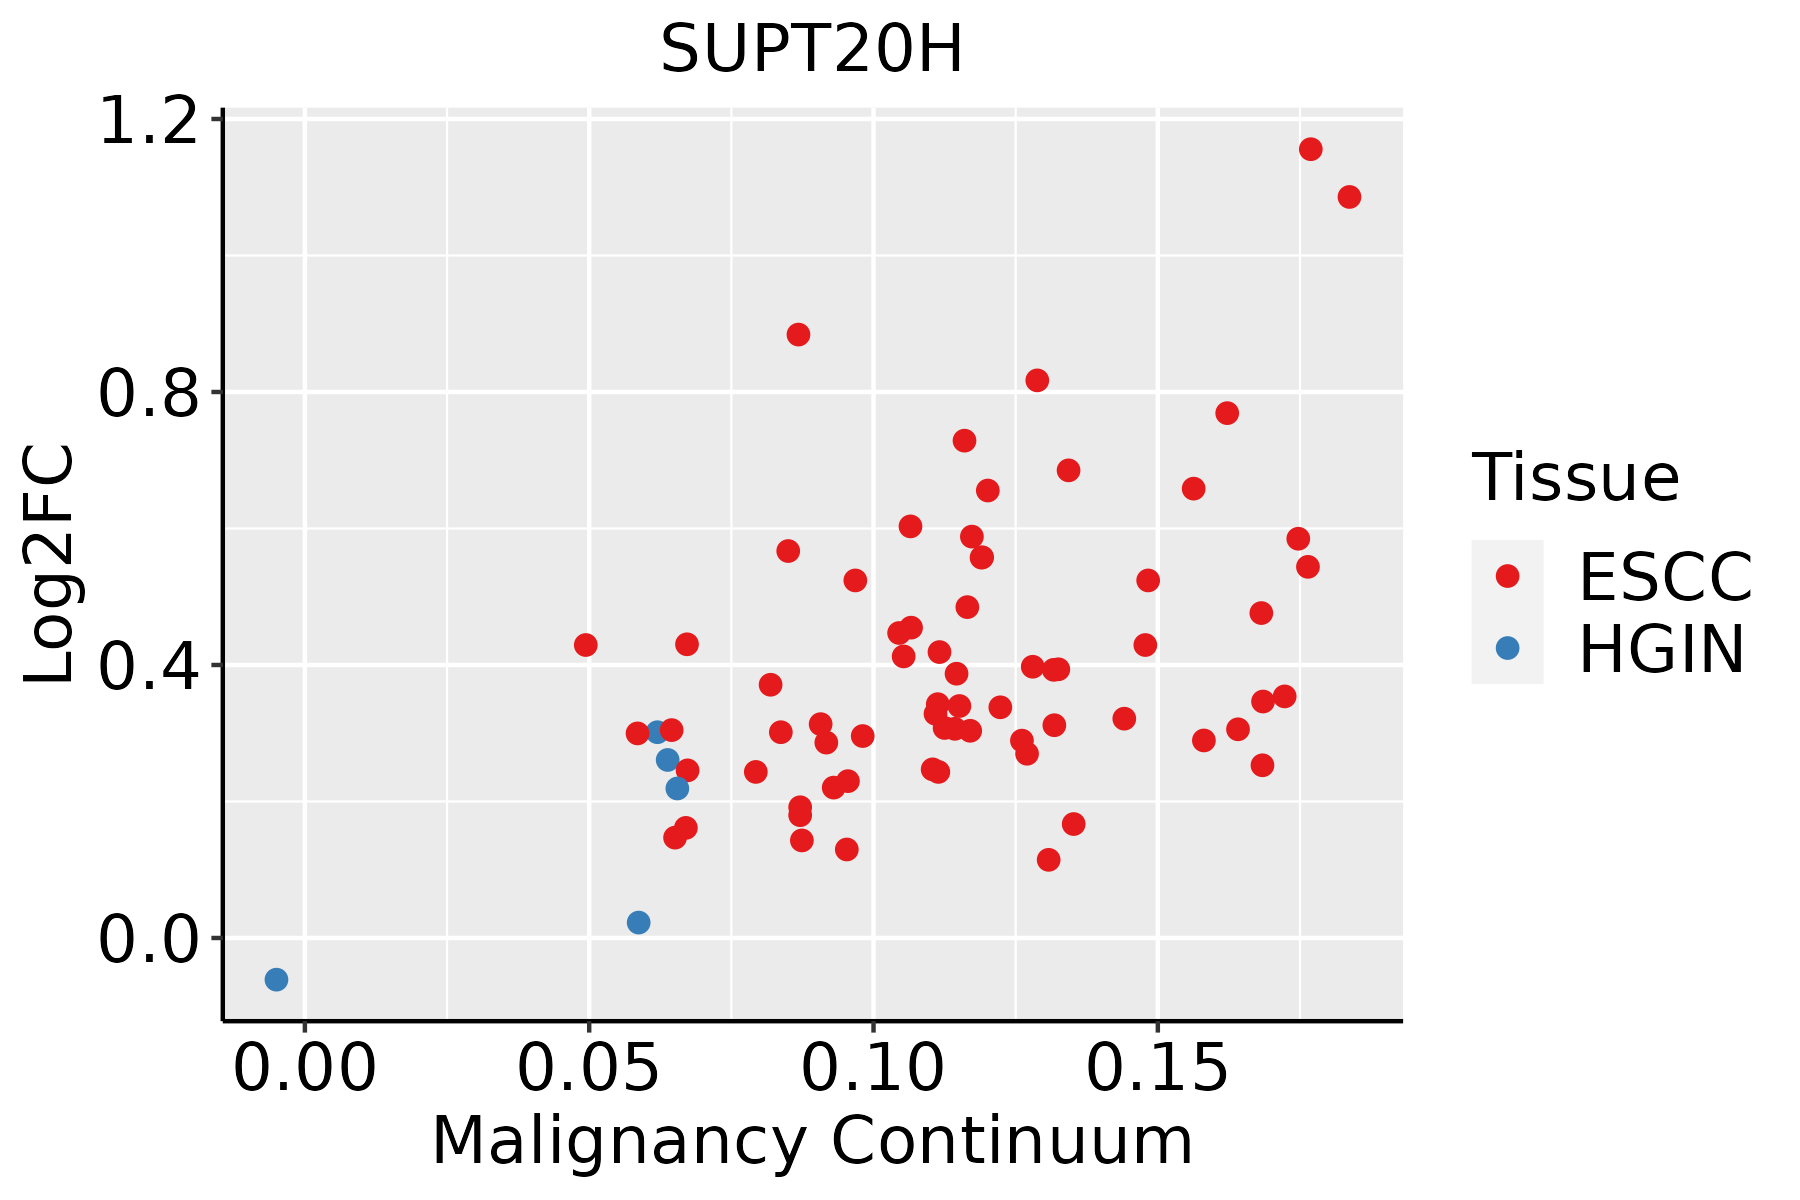 | ESCC: Esophageal squamous cell carcinoma |
| HGIN: High-grade intraepithelial neoplasias | ||
| LGIN: Low-grade intraepithelial neoplasias | ||
| Liver |  | HCC: Hepatocellular carcinoma |
| NAFLD: Non-alcoholic fatty liver disease | ||
| Oral Cavity |  | EOLP: Erosive Oral lichen planus |
| LP: leukoplakia | ||
| NEOLP: Non-erosive oral lichen planus | ||
| OSCC: Oral squamous cell carcinoma | ||
| Skin |  | AK: Actinic keratosis |
| cSCC: Cutaneous squamous cell carcinoma | ||
| SCCIS:squamous cell carcinoma in situ | ||
| Thyroid |  | ATC: Anaplastic thyroid cancer |
| HT: Hashimoto's thyroiditis | ||
| PTC: Papillary thyroid cancer |
| ∗log2FC in expression of this searched gene in stem-like cells from each diseased tissue sample relative to stem-like cells in normal samples in each tissue plotted against the malignancy continuum. Samples are colored based on if they are from different disease stage. |
Top |
Malignant transformation related pathway analysis |
| Find out the enriched GO biological processes and KEGG pathways involved in transition from healthy to precancer to cancer |
| Tissue | Disease Stage | Enriched GO biological Processes |
| Colorectum | AD |  |
| Colorectum | SER |  |
| Colorectum | MSS |  |
| Colorectum | MSI-H |  |
| Colorectum | FAP |  |
| ∗Top 15 enriched GO BP terms are showed in the bar plot of each disease state in each tissue. Each row represents a significant GO biological process which is colored according to the -log10(p.adjust). |
| Page: 1 2 3 4 5 6 7 8 9 |
| GO ID | Tissue | Disease Stage | Description | Gene Ratio | Bg Ratio | pvalue | p.adjust | Count |
| GO:00073698 | Esophagus | ESCC | gastrulation | 115/8552 | 185/18723 | 4.35e-06 | 4.64e-05 | 115 |
| GO:00073697 | Oral cavity | OSCC | gastrulation | 95/7305 | 185/18723 | 4.17e-04 | 2.54e-03 | 95 |
| GO:000736913 | Oral cavity | EOLP | gastrulation | 39/2218 | 185/18723 | 2.29e-04 | 2.25e-03 | 39 |
| GO:000736910 | Thyroid | PTC | gastrulation | 84/5968 | 185/18723 | 7.58e-05 | 6.52e-04 | 84 |
| GO:000736915 | Thyroid | ATC | gastrulation | 90/6293 | 185/18723 | 1.54e-05 | 1.43e-04 | 90 |
| Page: 1 |
| Pathway ID | Tissue | Disease Stage | Description | Gene Ratio | Bg Ratio | pvalue | p.adjust | qvalue | Count |
| hsa0414010 | Esophagus | ESCC | Autophagy - animal | 101/4205 | 141/8465 | 7.60e-08 | 6.21e-07 | 3.18e-07 | 101 |
| hsa0414015 | Esophagus | ESCC | Autophagy - animal | 101/4205 | 141/8465 | 7.60e-08 | 6.21e-07 | 3.18e-07 | 101 |
| hsa041406 | Liver | Cirrhotic | Autophagy - animal | 65/2530 | 141/8465 | 3.10e-05 | 2.47e-04 | 1.52e-04 | 65 |
| hsa0414011 | Liver | Cirrhotic | Autophagy - animal | 65/2530 | 141/8465 | 3.10e-05 | 2.47e-04 | 1.52e-04 | 65 |
| hsa0414021 | Liver | HCC | Autophagy - animal | 99/4020 | 141/8465 | 3.08e-08 | 4.70e-07 | 2.61e-07 | 99 |
| hsa0414031 | Liver | HCC | Autophagy - animal | 99/4020 | 141/8465 | 3.08e-08 | 4.70e-07 | 2.61e-07 | 99 |
| hsa041409 | Oral cavity | OSCC | Autophagy - animal | 94/3704 | 141/8465 | 2.73e-08 | 2.38e-07 | 1.21e-07 | 94 |
| hsa0414014 | Oral cavity | OSCC | Autophagy - animal | 94/3704 | 141/8465 | 2.73e-08 | 2.38e-07 | 1.21e-07 | 94 |
| hsa0414024 | Oral cavity | LP | Autophagy - animal | 55/2418 | 141/8465 | 4.54e-03 | 1.87e-02 | 1.20e-02 | 55 |
| hsa0414034 | Oral cavity | LP | Autophagy - animal | 55/2418 | 141/8465 | 4.54e-03 | 1.87e-02 | 1.20e-02 | 55 |
| hsa0414041 | Oral cavity | EOLP | Autophagy - animal | 39/1218 | 141/8465 | 2.68e-05 | 1.38e-04 | 8.12e-05 | 39 |
| hsa0414051 | Oral cavity | EOLP | Autophagy - animal | 39/1218 | 141/8465 | 2.68e-05 | 1.38e-04 | 8.12e-05 | 39 |
| Page: 1 |
Top |
Cell-cell communication analysis |
| Identification of potential cell-cell interactions between two cell types and their ligand-receptor pairs for different disease states |
| Ligand | Receptor | LRpair | Pathway | Tissue | Disease Stage |
| Page: 1 |
Top |
Single-cell gene regulatory network inference analysis |
| Find out the significant the regulons (TFs) and the target genes of each regulon across cell types for different disease states |
| TF | Cell Type | Tissue | Disease Stage | Target Gene | RSS | Regulon Activity |
| SUPT20H | CD8TCM | Cervix | HSIL_HPV | SFXN2,CEMIP2,BPHL, etc. | 2.18e-01 |  |
| SUPT20H | ASC | Colorectum | CRC | PLXNA1,DLEU7-AS1,AC011287.1, etc. | 3.32e-01 |  |
| SUPT20H | PLA | Endometrium | AEH | HOXB-AS1,SLC17A5,ZNF254, etc. | 4.72e-02 |  |
| SUPT20H | PLA | Endometrium | EEC | HOXB-AS1,SLC17A5,ZNF254, etc. | 5.74e-02 |  |
| SUPT20H | BN | Esophagus | ADJ | C6orf89,RABEPK,CABP1, etc. | 2.36e-02 |  |
| SUPT20H | BMEM | Esophagus | ESCC | C6orf89,RABEPK,CABP1, etc. | 2.37e-01 |  |
| SUPT20H | BN | Esophagus | ESCC | C6orf89,RABEPK,CABP1, etc. | 9.42e-02 | |
| SUPT20H | CLUB | Lung | Healthy | AADAC,MET,BRAF, etc. | 1.11e-01 |  |
| SUPT20H | PVA | Lung | Healthy | RNF25,CCDC18-AS1,PMS2, etc. | 1.10e-01 | |
| SUPT20H | BN | Pancreas | PDAC | LMBRD2,AL162253.2,LGR4, etc. | 1.87e-01 |  |
| ∗The dot plots of a searched regulon are shown for all cell subpopulations in each disease state of each tissue based on the regulon specific score inferred using pySCENIC and by calculating the average expression. |
| Page: 1 2 |
Top |
Somatic mutation of malignant transformation related genes |
| Annotation of somatic variants for genes involved in malignant transformation |
| Hugo Symbol | Variant Class | Variant Classification | dbSNP RS | HGVSc | HGVSp | HGVSp Short | SWISSPROT | BIOTYPE | SIFT | PolyPhen | Tumor Sample Barcode | Tissue | Histology | Sex | Age | Stage | Therapy Types | Drugs | Outcome |
| SUPT20H | SNV | Missense_Mutation | c.2347N>T | p.Leu783Phe | p.L783F | Q8NEM7 | protein_coding | deleterious(0) | probably_damaging(0.991) | TCGA-AC-A23H-01 | Breast | breast invasive carcinoma | Female | >=65 | I/II | Unknown | Unknown | PD | |
| SUPT20H | SNV | Missense_Mutation | c.376N>A | p.Asp126Asn | p.D126N | Q8NEM7 | protein_coding | tolerated(0.07) | possibly_damaging(0.759) | TCGA-AC-A2B8-01 | Breast | breast invasive carcinoma | Female | >=65 | I/II | Chemotherapy | chemo | PD | |
| SUPT20H | SNV | Missense_Mutation | c.1547N>C | p.Ser516Thr | p.S516T | Q8NEM7 | protein_coding | deleterious(0.03) | benign(0.081) | TCGA-B6-A0I6-01 | Breast | breast invasive carcinoma | Female | <65 | I/II | Unknown | Unknown | PD | |
| SUPT20H | deletion | Frame_Shift_Del | novel | c.2167delC | p.Gln723SerfsTer47 | p.Q723Sfs*47 | Q8NEM7 | protein_coding | TCGA-D8-A27V-01 | Breast | breast invasive carcinoma | Female | <65 | I/II | Hormone Therapy | tamoxiphen | SD | ||
| SUPT20H | deletion | Frame_Shift_Del | novel | c.1935delN | p.Met645IlefsTer9 | p.M645Ifs*9 | Q8NEM7 | protein_coding | TCGA-EW-A2FV-01 | Breast | breast invasive carcinoma | Female | <65 | III/IV | Chemotherapy | docetaxel | SD | ||
| SUPT20H | SNV | Missense_Mutation | novel | c.1085T>C | p.Leu362Pro | p.L362P | Q8NEM7 | protein_coding | tolerated(0.12) | benign(0.274) | TCGA-2W-A8YY-01 | Cervix | cervical & endocervical cancer | Female | <65 | I/II | Chemotherapy | cisplatin | CR |
| SUPT20H | SNV | Missense_Mutation | novel | c.796T>G | p.Phe266Val | p.F266V | Q8NEM7 | protein_coding | tolerated(0.1) | benign(0.09) | TCGA-2W-A8YY-01 | Cervix | cervical & endocervical cancer | Female | <65 | I/II | Chemotherapy | cisplatin | CR |
| SUPT20H | SNV | Missense_Mutation | c.1540N>G | p.Gln514Glu | p.Q514E | Q8NEM7 | protein_coding | tolerated(0.09) | possibly_damaging(0.9) | TCGA-DR-A0ZM-01 | Cervix | cervical & endocervical cancer | Female | <65 | III/IV | Unspecific | Cisplatin | SD | |
| SUPT20H | SNV | Missense_Mutation | c.814G>C | p.Glu272Gln | p.E272Q | Q8NEM7 | protein_coding | deleterious(0.05) | benign(0.418) | TCGA-FU-A40J-01 | Cervix | cervical & endocervical cancer | Female | <65 | III/IV | Chemotherapy | carboplatin | CR | |
| SUPT20H | SNV | Missense_Mutation | novel | c.1398N>G | p.Ile466Met | p.I466M | Q8NEM7 | protein_coding | deleterious(0.04) | probably_damaging(0.921) | TCGA-FU-A5XV-01 | Cervix | cervical & endocervical cancer | Female | <65 | III/IV | Unknown | Unknown | SD |
| Page: 1 2 3 4 5 6 7 8 9 |
Top |
Related drugs of malignant transformation related genes |
| Identification of chemicals and drugs interact with genes involved in malignant transfromation |
| (DGIdb 4.0) |
| Entrez ID | Symbol | Category | Interaction Types | Drug Claim Name | Drug Name | PMIDs |
| Page: 1 |

Copyright 2023-Present -The University of Texas Health Science Center at Houston |