Schematic overview of the cellular and molecular mechanisms involved in the cancer progression, including the proposed cellular and molecular mechanisms in cancer cells trajectory. AT1: alveolar type 1 cells; AT2: alveolar type 2 cells; AAH: atypical adenomatous hyperplasia; AIS: adenocarcinoma in situ; MIA: minimally invasive adenocarcinoma; IA: invasive adenocarcinoma; EMT: epithelial-mesenchymal transition

Home

Download

Statistics

Help

Contact

Center for Computational Systems Medicine
leaf

Gene summary

leaf

Malignant transformation analysis

leaf

Malignant transformation related pathway analysis

leaf

Cell-cell communication analysis

leaf

Single-cell gene regulatory network inference analysis

leaf

Somatic mutation of malignant transformation related genes

leaf

Related drugs of malignant transformation related genes

Gene: SUPT16H

Gene summary for SUPT16H

check button Gene summary.

Gene informationSpeciesHuman
Gene symbol

SUPT16H

Gene ID

11198

Gene nameSPT16 homolog, facilitates chromatin remodeling subunit
Gene AliasCDC68
Cytomap14q11.2
Gene Typeprotein-coding
GO ID

GO:0006139

UniProtAcc

Q9Y5B9


Top

Malignant transformation analysis

check button Identification of the aberrant gene expression in precancerous and cancerous lesions by comparing the gene expression of stem-like cells in diseased tissues with normal stem cells
check button Malignant transformation involving gene list.
Entrez IDSymbolReplicatesSpeciesOrganTissueAdj P-valueLog2FCMalignancy
11198SUPT16HHTA11_347_2000001011HumanColorectumAD9.98e-114.49e-01-0.1954
11198SUPT16HHTA11_1391_2000001011HumanColorectumAD6.85e-096.42e-01-0.059
11198SUPT16HHTA11_866_3004761011HumanColorectumAD3.68e-033.29e-010.096
11198SUPT16HHTA11_99999970781_79442HumanColorectumMSS4.20e-054.25e-010.294
11198SUPT16HHTA11_99999965104_69814HumanColorectumMSS5.50e-106.49e-010.281
11198SUPT16HA015-C-203HumanColorectumFAP2.46e-065.18e-02-0.1294
11198SUPT16HA015-C-104HumanColorectumFAP2.36e-081.99e-02-0.1899
11198SUPT16HA001-C-014HumanColorectumFAP1.49e-02-3.51e-020.0135
11198SUPT16HA002-C-016HumanColorectumFAP4.71e-03-1.76e-020.0521
11198SUPT16HA002-C-116HumanColorectumFAP4.76e-06-7.64e-03-0.0452
11198SUPT16HLZE2DHumanEsophagusHGIN2.31e-033.57e-010.0642
11198SUPT16HLZE2THumanEsophagusESCC1.30e-071.12e+000.082
11198SUPT16HLZE4THumanEsophagusESCC8.41e-227.83e-010.0811
11198SUPT16HLZE5THumanEsophagusESCC2.20e-081.05e+000.0514
11198SUPT16HLZE7THumanEsophagusESCC3.11e-053.92e-010.0667
11198SUPT16HLZE8THumanEsophagusESCC7.60e-072.28e-010.067
11198SUPT16HLZE20THumanEsophagusESCC8.75e-122.80e-010.0662
11198SUPT16HLZE21D1HumanEsophagusHGIN4.62e-052.02e-010.0632
11198SUPT16HLZE22D1HumanEsophagusHGIN1.61e-029.07e-020.0595
11198SUPT16HLZE24THumanEsophagusESCC1.05e-183.72e-010.0596
Page: 1 2 3 4 5 6 7 8 

check button Transcriptomic changes along malignancy continuum.
TissueExpression DynamicsAbbreviation
Colorectum (GSE201348)The image shows the transcriptomic changes along malignancy continuum.log2FC in expression of this searched gene in stem-like cells from each diseased tissue sample relative to stem-like cells in normal samples in each tissue plotted against the malignancy continuum. Samples are colored based on if they are from different disease stage.FAP: Familial adenomatous polyposis
CRC: Colorectal cancer
Colorectum (HTA11)The image shows the transcriptomic changes along malignancy continuum.log2FC in expression of this searched gene in stem-like cells from each diseased tissue sample relative to stem-like cells in normal samples in each tissue plotted against the malignancy continuum. Samples are colored based on if they are from different disease stage.AD: Adenomas
SER: Sessile serrated lesions
MSI-H: Microsatellite-high colorectal cancer
MSS: Microsatellite stable colorectal cancer
EsophagusThe image shows the transcriptomic changes along malignancy continuum.log2FC in expression of this searched gene in stem-like cells from each diseased tissue sample relative to stem-like cells in normal samples in each tissue plotted against the malignancy continuum. Samples are colored based on if they are from different disease stage.ESCC: Esophageal squamous cell carcinoma
HGIN: High-grade intraepithelial neoplasias
LGIN: Low-grade intraepithelial neoplasias
LiverThe image shows the transcriptomic changes along malignancy continuum.log2FC in expression of this searched gene in stem-like cells from each diseased tissue sample relative to stem-like cells in normal samples in each tissue plotted against the malignancy continuum. Samples are colored based on if they are from different disease stage.
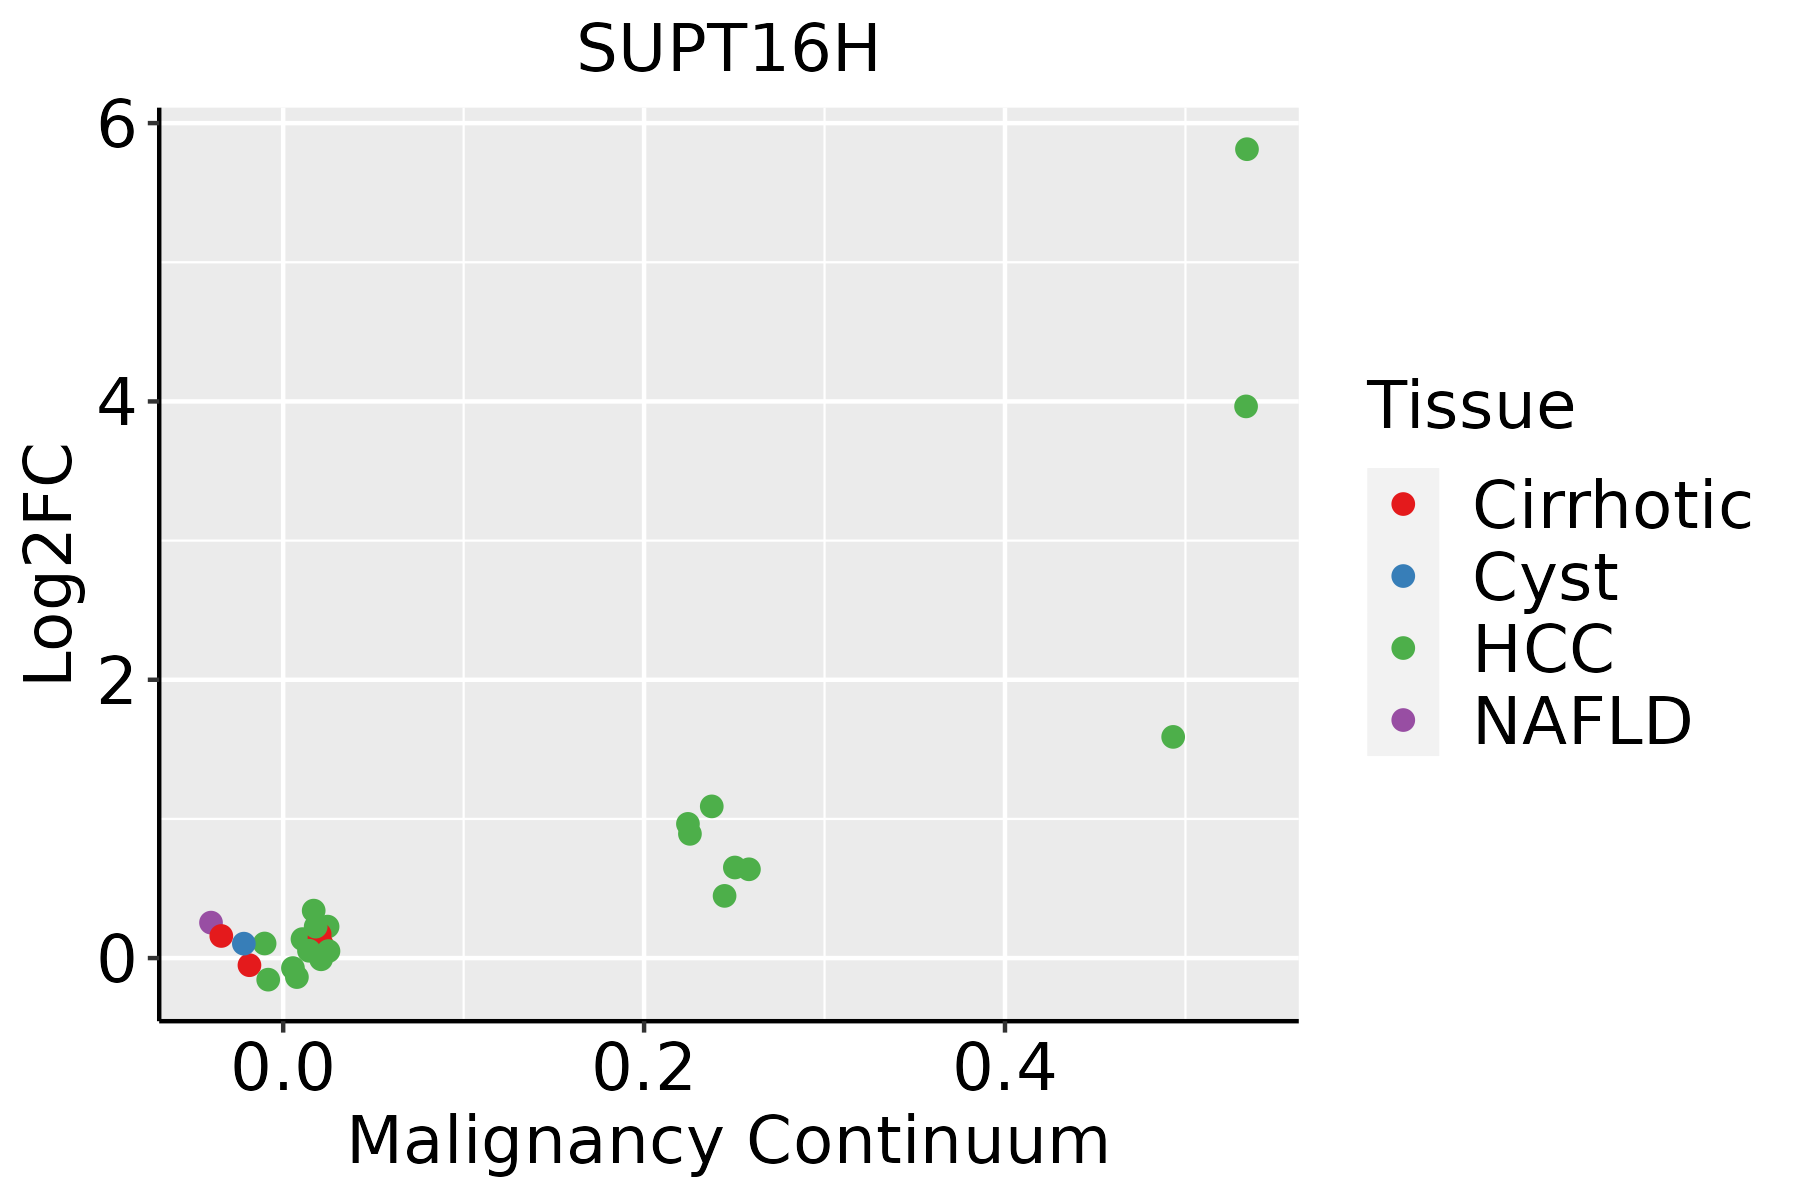
HCC: Hepatocellular carcinoma
NAFLD: Non-alcoholic fatty liver disease
Oral CavityThe image shows the transcriptomic changes along malignancy continuum.log2FC in expression of this searched gene in stem-like cells from each diseased tissue sample relative to stem-like cells in normal samples in each tissue plotted against the malignancy continuum. Samples are colored based on if they are from different disease stage.EOLP: Erosive Oral lichen planus
LP: leukoplakia
NEOLP: Non-erosive oral lichen planus
OSCC: Oral squamous cell carcinoma
ProstateThe image shows the transcriptomic changes along malignancy continuum.log2FC in expression of this searched gene in stem-like cells from each diseased tissue sample relative to stem-like cells in normal samples in each tissue plotted against the malignancy continuum. Samples are colored based on if they are from different disease stage.
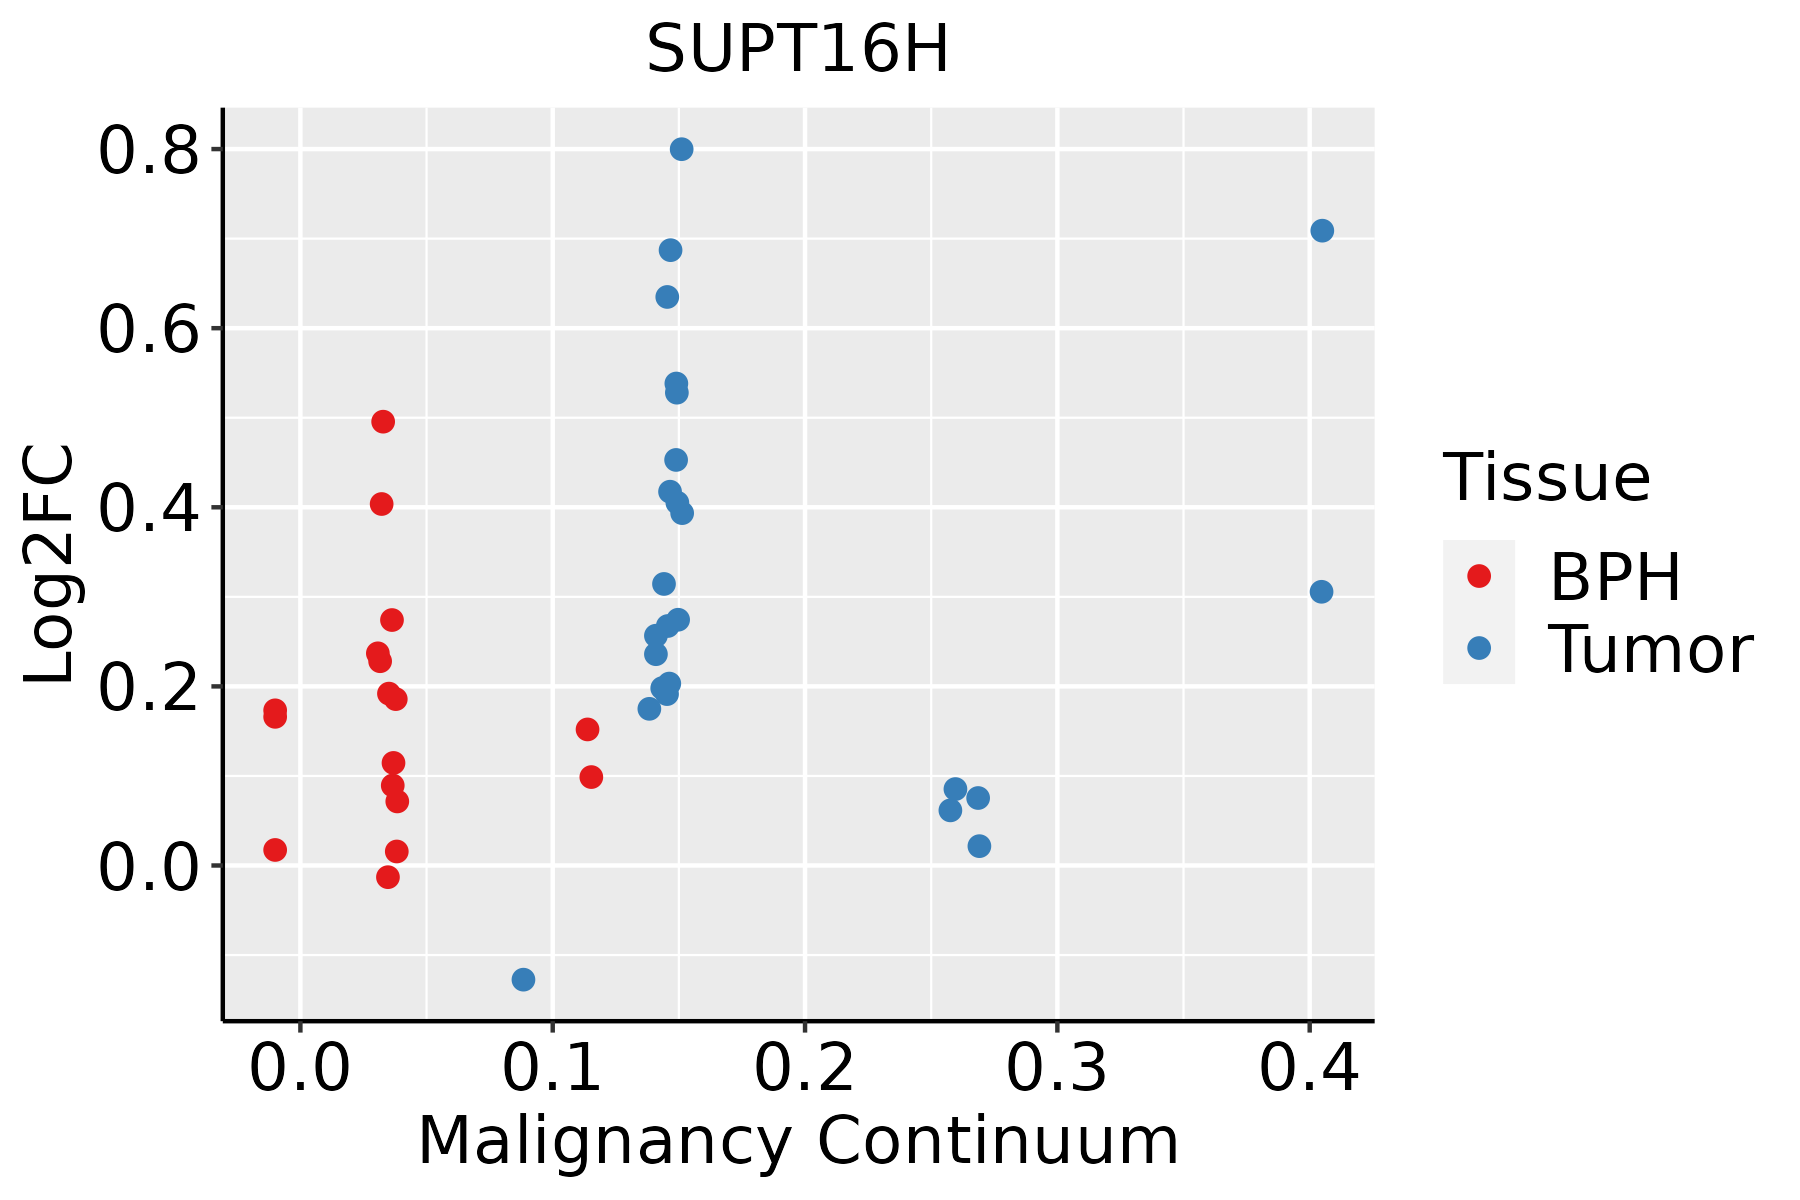
BPH: Benign Prostatic Hyperplasia
SkinThe image shows the transcriptomic changes along malignancy continuum.log2FC in expression of this searched gene in stem-like cells from each diseased tissue sample relative to stem-like cells in normal samples in each tissue plotted against the malignancy continuum. Samples are colored based on if they are from different disease stage.AK: Actinic keratosis
cSCC: Cutaneous squamous cell carcinoma
SCCIS:squamous cell carcinoma in situ
ThyroidThe image shows the transcriptomic changes along malignancy continuum.log2FC in expression of this searched gene in stem-like cells from each diseased tissue sample relative to stem-like cells in normal samples in each tissue plotted against the malignancy continuum. Samples are colored based on if they are from different disease stage.
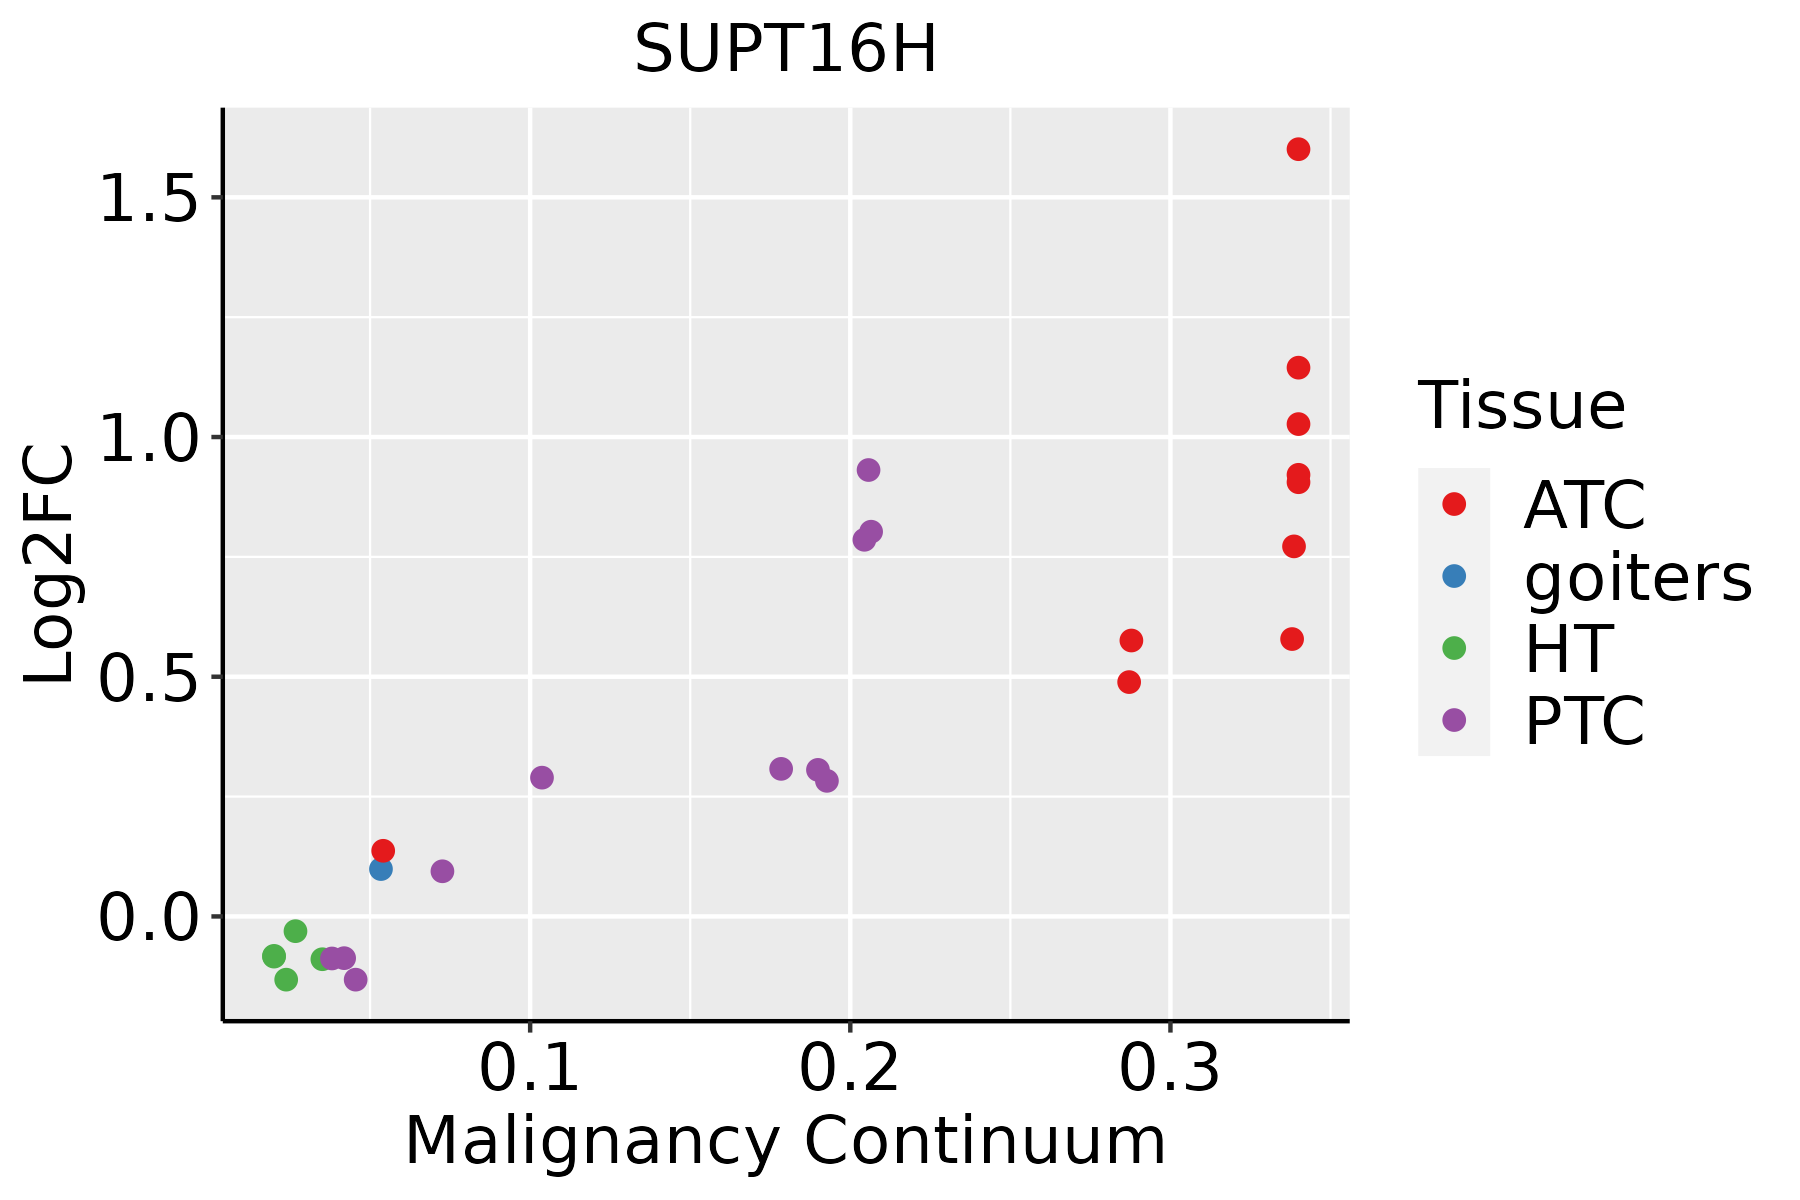
ATC: Anaplastic thyroid cancer
HT: Hashimoto's thyroiditis
PTC: Papillary thyroid cancer
∗log2FC in expression of this searched gene in stem-like cells from each diseased tissue sample relative to stem-like cells in normal samples in each tissue plotted against the malignancy continuum. Samples are colored based on if they are from different disease stage.

Top

Malignant transformation related pathway analysis

check buttonFind out the enriched GO biological processes and KEGG pathways involved in transition from healthy to precancer to cancer
check button Figure of enriched GO biological processes.
TissueDisease StageEnriched GO biological Processes
ColorectumADGO analysis - Figure of enriched GO biological processes: Top 15 enriched GO BP terms are showed in the bar plot of each disease state in each tissue. Each row represents a significant GO biological process which is colored according to the -log10(p.adjust).
ColorectumSERGO analysis - Figure of enriched GO biological processes: Top 15 enriched GO BP terms are showed in the bar plot of each disease state in each tissue. Each row represents a significant GO biological process which is colored according to the -log10(p.adjust).
ColorectumMSSGO analysis - Figure of enriched GO biological processes: Top 15 enriched GO BP terms are showed in the bar plot of each disease state in each tissue. Each row represents a significant GO biological process which is colored according to the -log10(p.adjust).
ColorectumMSI-HGO analysis - Figure of enriched GO biological processes: Top 15 enriched GO BP terms are showed in the bar plot of each disease state in each tissue. Each row represents a significant GO biological process which is colored according to the -log10(p.adjust).
ColorectumFAPGO analysis - Figure of enriched GO biological processes: Top 15 enriched GO BP terms are showed in the bar plot of each disease state in each tissue. Each row represents a significant GO biological process which is colored according to the -log10(p.adjust).
∗Top 15 enriched GO BP terms are showed in the bar plot of each disease state in each tissue. Each row represents a significant GO biological process which is colored according to the -log10(p.adjust).
Page: 1 2 3 4 5 6 7 8 9 

check button Enriched GO biological processes.
GO IDTissueDisease StageDescriptionGene RatioBg Ratiopvaluep.adjustCount
GO:0022411ColorectumADcellular component disassembly147/3918443/187238.53e-106.76e-08147
GO:0032984ColorectumADprotein-containing complex disassembly81/3918224/187239.41e-084.65e-0681
GO:0006325ColorectumADchromatin organization119/3918409/187234.85e-058.33e-04119
GO:0032986ColorectumADprotein-DNA complex disassembly12/391820/187231.60e-042.21e-0312
GO:0031498ColorectumADchromatin disassembly11/391820/187238.39e-048.21e-0311
GO:0006337ColorectumADnucleosome disassembly10/391818/187231.31e-031.15e-0210
GO:0032786ColorectumADpositive regulation of DNA-templated transcription, elongation13/391827/187231.47e-031.25e-0213
GO:0006354ColorectumADDNA-templated transcription, elongation31/391891/187232.46e-031.90e-0231
GO:0006368ColorectumADtranscription elongation from RNA polymerase II promoter24/391869/187235.35e-033.52e-0224
GO:0006338ColorectumADchromatin remodeling70/3918255/187237.44e-034.53e-0270
GO:00224112ColorectumMSScellular component disassembly130/3467443/187231.44e-088.46e-07130
GO:00329842ColorectumMSSprotein-containing complex disassembly69/3467224/187235.61e-061.50e-0469
GO:00329862ColorectumMSSprotein-DNA complex disassembly12/346720/187234.55e-058.35e-0412
GO:00063252ColorectumMSSchromatin organization107/3467409/187237.22e-051.21e-03107
GO:00314982ColorectumMSSchromatin disassembly11/346720/187232.77e-043.67e-0311
GO:00063371ColorectumMSSnucleosome disassembly10/346718/187234.76e-045.58e-0310
GO:00063541ColorectumMSSDNA-templated transcription, elongation29/346791/187231.52e-031.39e-0229
GO:00327861ColorectumMSSpositive regulation of DNA-templated transcription, elongation12/346727/187231.74e-031.55e-0212
GO:00063681ColorectumMSStranscription elongation from RNA polymerase II promoter22/346769/187235.31e-033.62e-0222
GO:00224114ColorectumFAPcellular component disassembly97/2622443/187233.44e-061.23e-0497
Page: 1 2 3 4 5 6 7 8 9 

check button Enriched KEGG pathways.
Pathway IDTissueDisease StageDescriptionGene RatioBg Ratiopvaluep.adjustqvalueCount
Page: 1 

Top

Cell-cell communication analysis

check buttonIdentification of potential cell-cell interactions between two cell types and their ligand-receptor pairs for different disease states
LigandReceptorLRpairPathwayTissueDisease Stage
Page: 1 

Top

Single-cell gene regulatory network inference analysis

check buttonFind out the significant the regulons (TFs) and the target genes of each regulon across cell types for different disease states
TFCell TypeTissueDisease StageTarget GeneRSSRegulon Activity
∗The dot plots of a searched regulon are shown for all cell subpopulations in each disease state of each tissue based on the regulon specific score inferred using pySCENIC and by calculating the average expression.
Page: 1 

Top

Somatic mutation of malignant transformation related genes

check buttonAnnotation of somatic variants for genes involved in malignant transformation
Hugo SymbolVariant ClassVariant ClassificationdbSNP RSHGVScHGVSpHGVSp ShortSWISSPROTBIOTYPESIFTPolyPhenTumor Sample BarcodeTissueHistologySexAgeStageTherapy TypesDrugsOutcome
SUPT16HSNVMissense_Mutationnovelc.121N>Cp.Asp41Hisp.D41HQ9Y5B9protein_codingdeleterious(0)probably_damaging(0.962)TCGA-3C-AALI-01Breastbreast invasive carcinomaFemale<65I/IIUnspecificPoly EComplete Response
SUPT16HSNVMissense_Mutationnovelc.1921G>Ap.Glu641Lysp.E641KQ9Y5B9protein_codingdeleterious(0)probably_damaging(0.996)TCGA-5L-AAT1-01Breastbreast invasive carcinomaFemale<65III/IVHormone TherapyletrozolSD
SUPT16HSNVMissense_Mutationc.1444G>Cp.Ala482Prop.A482PQ9Y5B9protein_codingtolerated(0.14)possibly_damaging(0.759)TCGA-A8-A09A-01Breastbreast invasive carcinomaFemale<65I/IIHormone TherapytamoxiphenSD
SUPT16HSNVMissense_Mutationc.594N>Ap.Phe198Leup.F198LQ9Y5B9protein_codingtolerated(1)benign(0.003)TCGA-AC-A23H-01Breastbreast invasive carcinomaFemale>=65I/IIUnknownUnknownPD
SUPT16HSNVMissense_Mutationnovelc.535N>Ap.Glu179Lysp.E179KQ9Y5B9protein_codingdeleterious(0)probably_damaging(0.999)TCGA-AN-A046-01Breastbreast invasive carcinomaFemale>=65I/IIUnknownUnknownSD
SUPT16HSNVMissense_Mutationnovelc.296G>Cp.Gly99Alap.G99AQ9Y5B9protein_codingtolerated(0.09)benign(0.147)TCGA-BH-A0B6-01Breastbreast invasive carcinomaFemale<65I/IIUnknownUnknownSD
SUPT16HSNVMissense_Mutationnovelc.2806N>Ap.Glu936Lysp.E936KQ9Y5B9protein_codingtolerated(0.2)benign(0.011)TCGA-C8-A8HQ-01Breastbreast invasive carcinomaFemale<65I/IIUnknownUnknownSD
SUPT16HSNVMissense_Mutationc.905N>Gp.Tyr302Cysp.Y302CQ9Y5B9protein_codingdeleterious(0)possibly_damaging(0.877)TCGA-D8-A1JH-01Breastbreast invasive carcinomaFemale<65I/IIHormone TherapynolvadexSD
SUPT16HSNVMissense_Mutationc.991N>Tp.Asp331Tyrp.D331YQ9Y5B9protein_codingdeleterious(0.01)possibly_damaging(0.827)TCGA-E9-A1RG-01Breastbreast invasive carcinomaFemale<65III/IVHormone TherapytamoxiphenSD
SUPT16HSNVMissense_Mutationc.441G>Ap.Met147Ilep.M147IQ9Y5B9protein_codingtolerated(0.81)benign(0.011)TCGA-GM-A2D9-01Breastbreast invasive carcinomaFemale>=65I/IIHormone TherapyarimidexSD
Page: 1 2 3 4 5 6 7 8 9 10 11 12 13 14 

Top

Related drugs of malignant transformation related genes

check buttonIdentification of chemicals and drugs interact with genes involved in malignant transfromation
(DGIdb 4.0)
Entrez IDSymbolCategoryInteraction TypesDrug Claim NameDrug NamePMIDs
Page: 1