
|
|||||
|
 | |
| |
| |
| |
| |
| |
|
Gene: SUOX |
Gene summary for SUOX |
| Gene information | Species | Human | Gene symbol | SUOX | Gene ID | 6821 |
| Gene name | sulfite oxidase | |
| Gene Alias | SUOX | |
| Cytomap | 12q13.2 | |
| Gene Type | protein-coding | GO ID | GO:0006790 | UniProtAcc | A0A024RB79 |
Top |
Malignant transformation analysis |
| Identification of the aberrant gene expression in precancerous and cancerous lesions by comparing the gene expression of stem-like cells in diseased tissues with normal stem cells |
| Entrez ID | Symbol | Replicates | Species | Organ | Tissue | Adj P-value | Log2FC | Malignancy |
| 6821 | SUOX | LZE24T | Human | Esophagus | ESCC | 1.37e-06 | 1.96e-01 | 0.0596 |
| 6821 | SUOX | P2T-E | Human | Esophagus | ESCC | 1.14e-16 | 2.06e-01 | 0.1177 |
| 6821 | SUOX | P4T-E | Human | Esophagus | ESCC | 7.45e-08 | 1.99e-01 | 0.1323 |
| 6821 | SUOX | P5T-E | Human | Esophagus | ESCC | 4.25e-03 | 8.71e-02 | 0.1327 |
| 6821 | SUOX | P8T-E | Human | Esophagus | ESCC | 1.97e-18 | 1.43e-01 | 0.0889 |
| 6821 | SUOX | P12T-E | Human | Esophagus | ESCC | 8.05e-10 | 2.07e-01 | 0.1122 |
| 6821 | SUOX | P15T-E | Human | Esophagus | ESCC | 8.39e-04 | 1.01e-01 | 0.1149 |
| 6821 | SUOX | P16T-E | Human | Esophagus | ESCC | 1.31e-08 | 1.26e-01 | 0.1153 |
| 6821 | SUOX | P20T-E | Human | Esophagus | ESCC | 3.07e-02 | 8.50e-02 | 0.1124 |
| 6821 | SUOX | P22T-E | Human | Esophagus | ESCC | 3.88e-03 | 7.29e-02 | 0.1236 |
| 6821 | SUOX | P23T-E | Human | Esophagus | ESCC | 3.83e-08 | 2.12e-01 | 0.108 |
| 6821 | SUOX | P24T-E | Human | Esophagus | ESCC | 3.40e-02 | 4.45e-02 | 0.1287 |
| 6821 | SUOX | P27T-E | Human | Esophagus | ESCC | 1.55e-09 | 1.60e-01 | 0.1055 |
| 6821 | SUOX | P30T-E | Human | Esophagus | ESCC | 2.91e-04 | 1.72e-01 | 0.137 |
| 6821 | SUOX | P32T-E | Human | Esophagus | ESCC | 6.74e-05 | 6.27e-02 | 0.1666 |
| 6821 | SUOX | P36T-E | Human | Esophagus | ESCC | 6.53e-03 | 1.42e-01 | 0.1187 |
| 6821 | SUOX | P37T-E | Human | Esophagus | ESCC | 1.27e-02 | 1.23e-01 | 0.1371 |
| 6821 | SUOX | P39T-E | Human | Esophagus | ESCC | 4.13e-03 | 6.44e-02 | 0.0894 |
| 6821 | SUOX | P40T-E | Human | Esophagus | ESCC | 9.64e-03 | 1.25e-01 | 0.109 |
| 6821 | SUOX | P42T-E | Human | Esophagus | ESCC | 1.01e-09 | 3.04e-01 | 0.1175 |
| Page: 1 2 |
| Tissue | Expression Dynamics | Abbreviation |
| Esophagus | 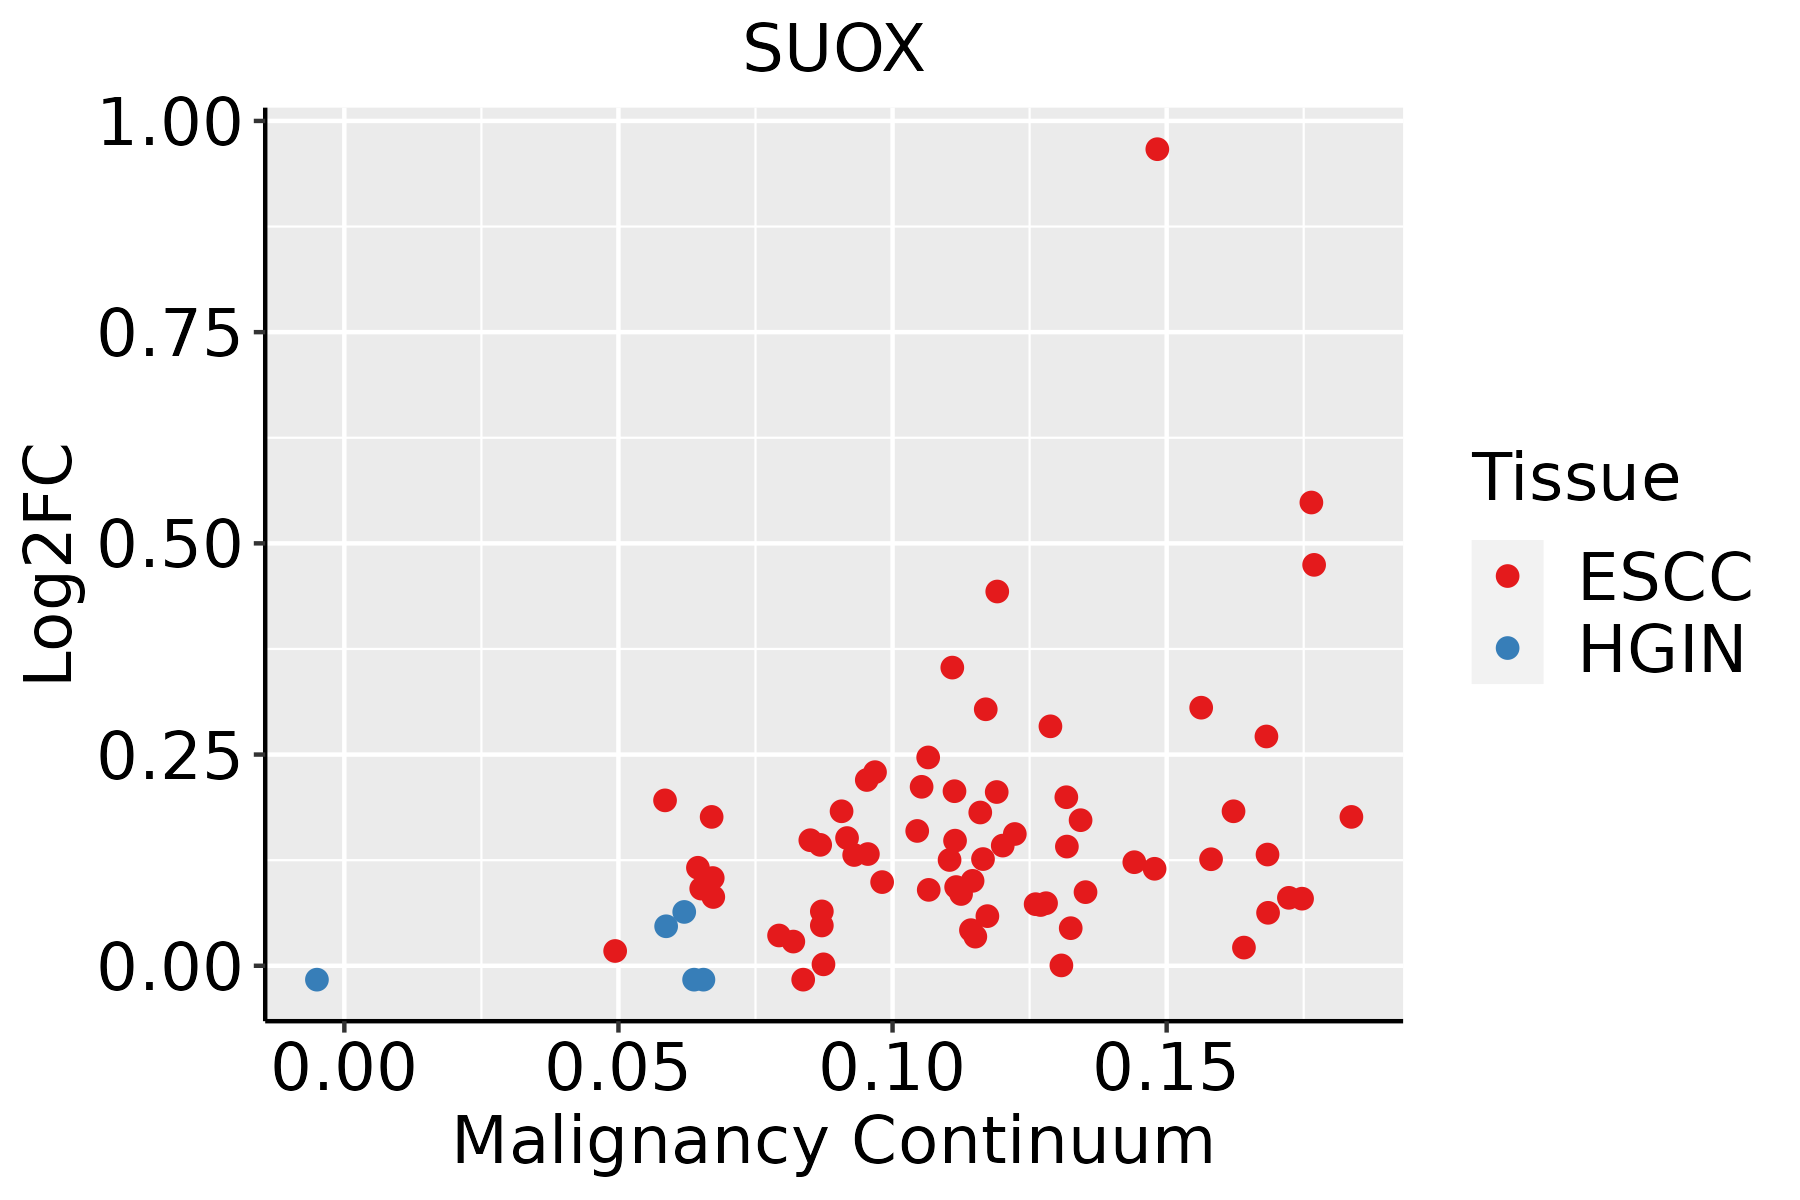 | ESCC: Esophageal squamous cell carcinoma |
| HGIN: High-grade intraepithelial neoplasias | ||
| LGIN: Low-grade intraepithelial neoplasias |
| ∗log2FC in expression of this searched gene in stem-like cells from each diseased tissue sample relative to stem-like cells in normal samples in each tissue plotted against the malignancy continuum. Samples are colored based on if they are from different disease stage. |
Top |
Malignant transformation related pathway analysis |
| Find out the enriched GO biological processes and KEGG pathways involved in transition from healthy to precancer to cancer |
| Tissue | Disease Stage | Enriched GO biological Processes |
| Colorectum | AD |  |
| Colorectum | SER |  |
| Colorectum | MSS |  |
| Colorectum | MSI-H |  |
| Colorectum | FAP |  |
| ∗Top 15 enriched GO BP terms are showed in the bar plot of each disease state in each tissue. Each row represents a significant GO biological process which is colored according to the -log10(p.adjust). |
| Page: 1 2 3 4 5 6 7 8 9 |
| GO ID | Tissue | Disease Stage | Description | Gene Ratio | Bg Ratio | pvalue | p.adjust | Count |
| GO:00067906 | Esophagus | ESCC | sulfur compound metabolic process | 201/8552 | 339/18723 | 2.64e-07 | 3.94e-06 | 201 |
| Page: 1 |
| Pathway ID | Tissue | Disease Stage | Description | Gene Ratio | Bg Ratio | pvalue | p.adjust | qvalue | Count |
| Page: 1 |
Top |
Cell-cell communication analysis |
| Identification of potential cell-cell interactions between two cell types and their ligand-receptor pairs for different disease states |
| Ligand | Receptor | LRpair | Pathway | Tissue | Disease Stage |
| Page: 1 |
Top |
Single-cell gene regulatory network inference analysis |
| Find out the significant the regulons (TFs) and the target genes of each regulon across cell types for different disease states |
| TF | Cell Type | Tissue | Disease Stage | Target Gene | RSS | Regulon Activity |
| ∗The dot plots of a searched regulon are shown for all cell subpopulations in each disease state of each tissue based on the regulon specific score inferred using pySCENIC and by calculating the average expression. |
| Page: 1 |
Top |
Somatic mutation of malignant transformation related genes |
| Annotation of somatic variants for genes involved in malignant transformation |
| Hugo Symbol | Variant Class | Variant Classification | dbSNP RS | HGVSc | HGVSp | HGVSp Short | SWISSPROT | BIOTYPE | SIFT | PolyPhen | Tumor Sample Barcode | Tissue | Histology | Sex | Age | Stage | Therapy Types | Drugs | Outcome |
| SUOX | SNV | Missense_Mutation | novel | c.1350N>T | p.Trp450Cys | p.W450C | P51687 | protein_coding | deleterious(0) | probably_damaging(0.995) | TCGA-3C-AALI-01 | Breast | breast invasive carcinoma | Female | <65 | I/II | Unspecific | Poly E | Complete Response |
| SUOX | SNV | Missense_Mutation | c.1615N>T | p.Val539Phe | p.V539F | P51687 | protein_coding | deleterious(0) | probably_damaging(0.941) | TCGA-A8-A09M-01 | Breast | breast invasive carcinoma | Female | >=65 | III/IV | Chemotherapy | paclitaxel | CR | |
| SUOX | SNV | Missense_Mutation | c.29N>C | p.Leu10Pro | p.L10P | P51687 | protein_coding | tolerated_low_confidence(0.24) | benign(0) | TCGA-AR-A1AO-01 | Breast | breast invasive carcinoma | Female | <65 | I/II | Chemotherapy | doxorubicin | SD | |
| SUOX | SNV | Missense_Mutation | c.1397G>T | p.Gly466Val | p.G466V | P51687 | protein_coding | deleterious(0) | probably_damaging(0.995) | TCGA-AR-A250-01 | Breast | breast invasive carcinoma | Female | <65 | I/II | Chemotherapy | doxorubicin | SD | |
| SUOX | SNV | Missense_Mutation | rs201162460 | c.377T>G | p.Met126Arg | p.M126R | P51687 | protein_coding | deleterious(0) | probably_damaging(0.944) | TCGA-BH-A0BL-01 | Breast | breast invasive carcinoma | Female | <65 | I/II | Chemotherapy | adriamycin | CR |
| SUOX | SNV | Missense_Mutation | c.448G>A | p.Glu150Lys | p.E150K | P51687 | protein_coding | tolerated(0.19) | benign(0.25) | TCGA-E2-A10C-01 | Breast | breast invasive carcinoma | Female | <65 | I/II | Chemotherapy | cytoxan | SD | |
| SUOX | SNV | Missense_Mutation | novel | c.1076N>T | p.Arg359Leu | p.R359L | P51687 | protein_coding | deleterious(0.02) | benign(0.255) | TCGA-LQ-A4E4-01 | Breast | breast invasive carcinoma | Female | >=65 | III/IV | Hormone Therapy | anastrozole | PD |
| SUOX | SNV | Missense_Mutation | rs139286617 | c.424N>A | p.Val142Ile | p.V142I | P51687 | protein_coding | tolerated(0.34) | benign(0.005) | TCGA-2W-A8YY-01 | Cervix | cervical & endocervical cancer | Female | <65 | I/II | Chemotherapy | cisplatin | CR |
| SUOX | SNV | Missense_Mutation | novel | c.497N>A | p.Val166Glu | p.V166E | P51687 | protein_coding | tolerated(1) | benign(0) | TCGA-DS-A1OD-01 | Cervix | cervical & endocervical cancer | Female | <65 | I/II | Chemotherapy | cisplatin | SD |
| SUOX | SNV | Missense_Mutation | novel | c.499N>C | p.Ala167Pro | p.A167P | P51687 | protein_coding | tolerated(0.32) | benign(0) | TCGA-DS-A1OD-01 | Cervix | cervical & endocervical cancer | Female | <65 | I/II | Chemotherapy | cisplatin | SD |
| Page: 1 2 3 4 5 6 |
Top |
Related drugs of malignant transformation related genes |
| Identification of chemicals and drugs interact with genes involved in malignant transfromation |
| (DGIdb 4.0) |
| Entrez ID | Symbol | Category | Interaction Types | Drug Claim Name | Drug Name | PMIDs |
| Page: 1 |

Copyright 2023-Present -The University of Texas Health Science Center at Houston |