
|
|||||
|
 | |
| |
| |
| |
| |
| |
|
Gene: SUN2 |
Gene summary for SUN2 |
| Gene information | Species | Human | Gene symbol | SUN2 | Gene ID | 25777 |
| Gene name | Sad1 and UNC84 domain containing 2 | |
| Gene Alias | UNC84B | |
| Cytomap | 22q13.1 | |
| Gene Type | protein-coding | GO ID | GO:0000003 | UniProtAcc | B4E2A6 |
Top |
Malignant transformation analysis |
| Identification of the aberrant gene expression in precancerous and cancerous lesions by comparing the gene expression of stem-like cells in diseased tissues with normal stem cells |
| Entrez ID | Symbol | Replicates | Species | Organ | Tissue | Adj P-value | Log2FC | Malignancy |
| 25777 | SUN2 | LZE2T | Human | Esophagus | ESCC | 2.61e-06 | 5.79e-01 | 0.082 |
| 25777 | SUN2 | LZE4T | Human | Esophagus | ESCC | 2.56e-08 | 2.42e-02 | 0.0811 |
| 25777 | SUN2 | LZE7T | Human | Esophagus | ESCC | 2.43e-04 | 1.08e-01 | 0.0667 |
| 25777 | SUN2 | LZE20T | Human | Esophagus | ESCC | 6.89e-04 | 1.13e-01 | 0.0662 |
| 25777 | SUN2 | LZE24T | Human | Esophagus | ESCC | 9.03e-07 | -1.59e-02 | 0.0596 |
| 25777 | SUN2 | LZE6T | Human | Esophagus | ESCC | 4.84e-02 | 1.35e-02 | 0.0845 |
| 25777 | SUN2 | P1T-E | Human | Esophagus | ESCC | 1.58e-11 | 7.04e-01 | 0.0875 |
| 25777 | SUN2 | P2T-E | Human | Esophagus | ESCC | 4.77e-16 | 5.14e-01 | 0.1177 |
| 25777 | SUN2 | P4T-E | Human | Esophagus | ESCC | 8.63e-17 | 3.91e-01 | 0.1323 |
| 25777 | SUN2 | P8T-E | Human | Esophagus | ESCC | 3.61e-21 | 3.94e-01 | 0.0889 |
| 25777 | SUN2 | P9T-E | Human | Esophagus | ESCC | 1.34e-06 | 1.26e-01 | 0.1131 |
| 25777 | SUN2 | P10T-E | Human | Esophagus | ESCC | 1.12e-07 | 6.63e-01 | 0.116 |
| 25777 | SUN2 | P11T-E | Human | Esophagus | ESCC | 1.24e-18 | 6.59e-01 | 0.1426 |
| 25777 | SUN2 | P12T-E | Human | Esophagus | ESCC | 2.50e-21 | 3.02e-01 | 0.1122 |
| 25777 | SUN2 | P15T-E | Human | Esophagus | ESCC | 4.87e-19 | 6.97e-01 | 0.1149 |
| 25777 | SUN2 | P16T-E | Human | Esophagus | ESCC | 3.18e-21 | 6.68e-01 | 0.1153 |
| 25777 | SUN2 | P17T-E | Human | Esophagus | ESCC | 2.99e-09 | 5.22e-01 | 0.1278 |
| 25777 | SUN2 | P19T-E | Human | Esophagus | ESCC | 1.09e-09 | 6.77e-01 | 0.1662 |
| 25777 | SUN2 | P20T-E | Human | Esophagus | ESCC | 1.63e-11 | 1.55e-01 | 0.1124 |
| 25777 | SUN2 | P21T-E | Human | Esophagus | ESCC | 1.35e-26 | 7.52e-01 | 0.1617 |
| Page: 1 2 3 4 5 6 |
| Tissue | Expression Dynamics | Abbreviation |
| Esophagus | 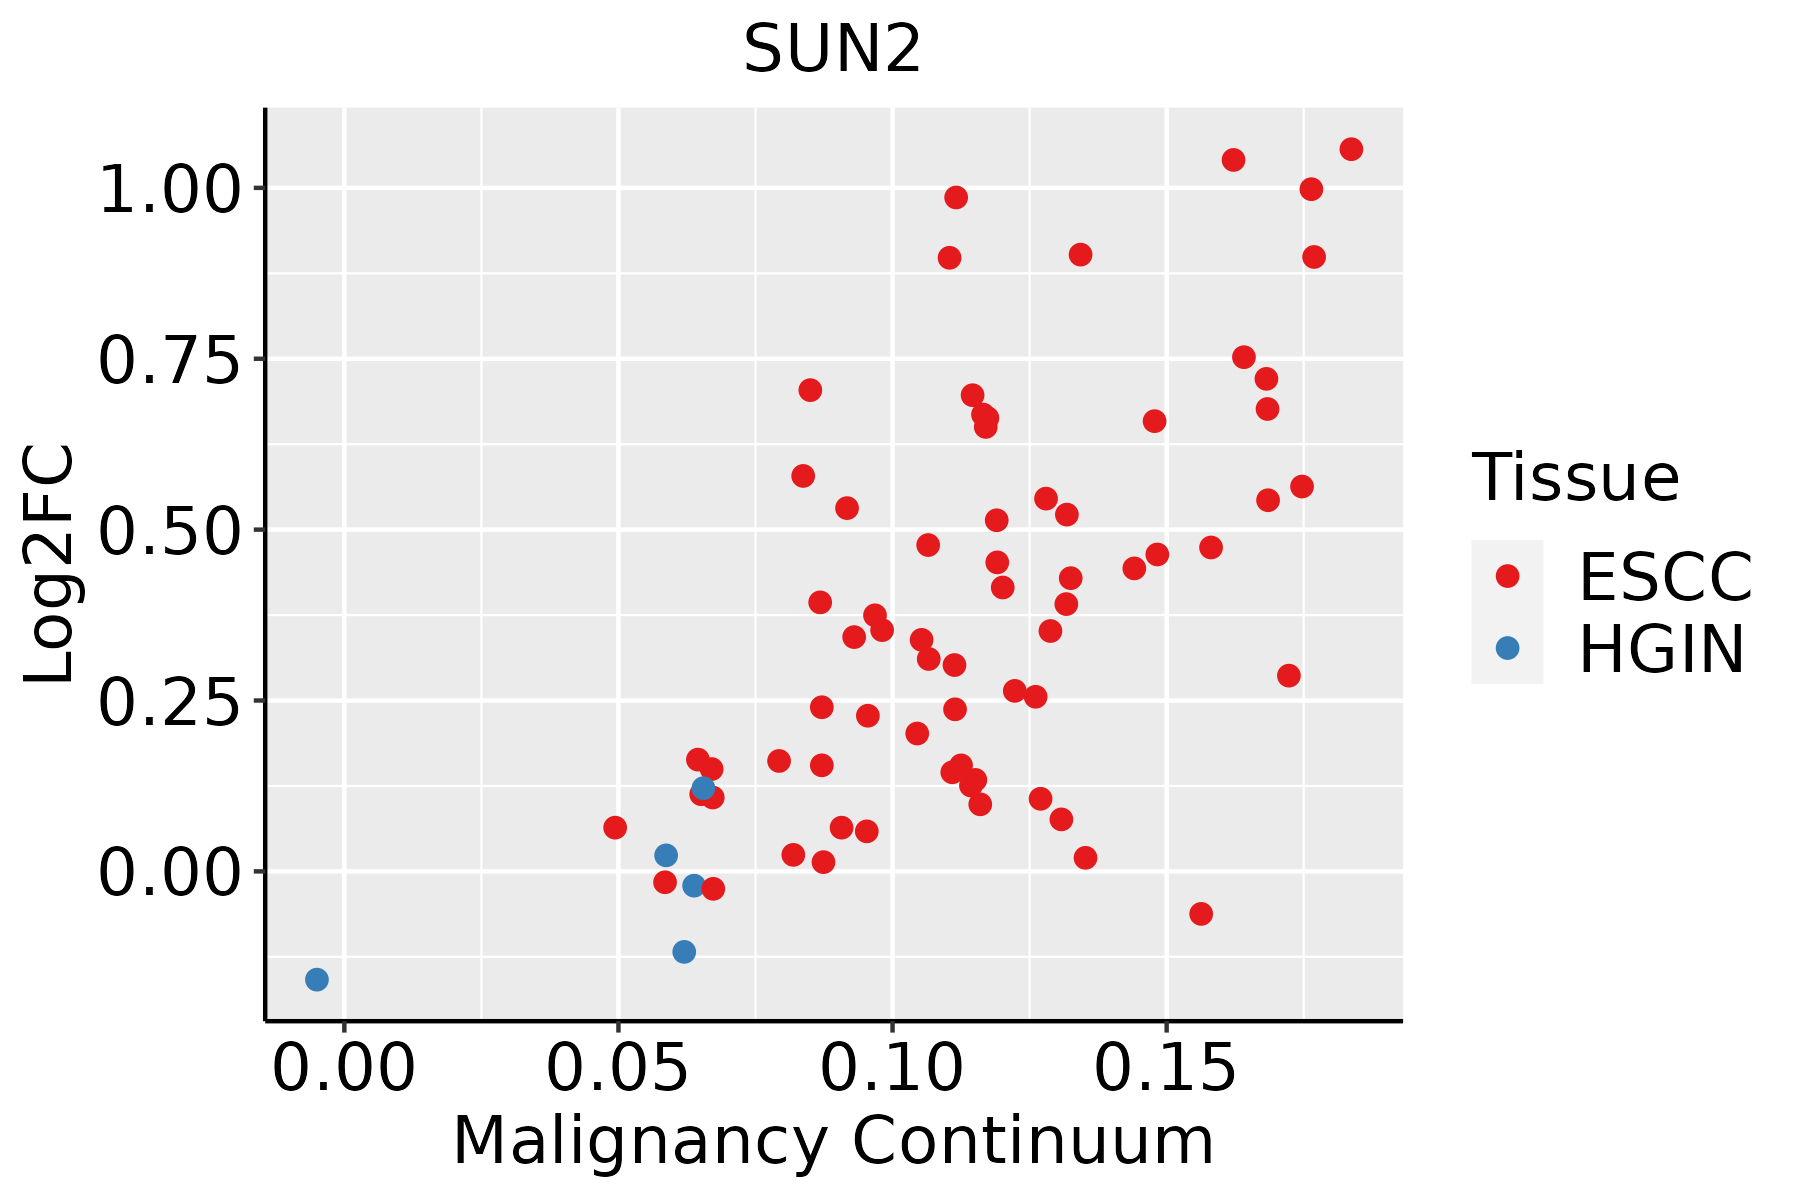 | ESCC: Esophageal squamous cell carcinoma |
| HGIN: High-grade intraepithelial neoplasias | ||
| LGIN: Low-grade intraepithelial neoplasias | ||
| Oral Cavity | 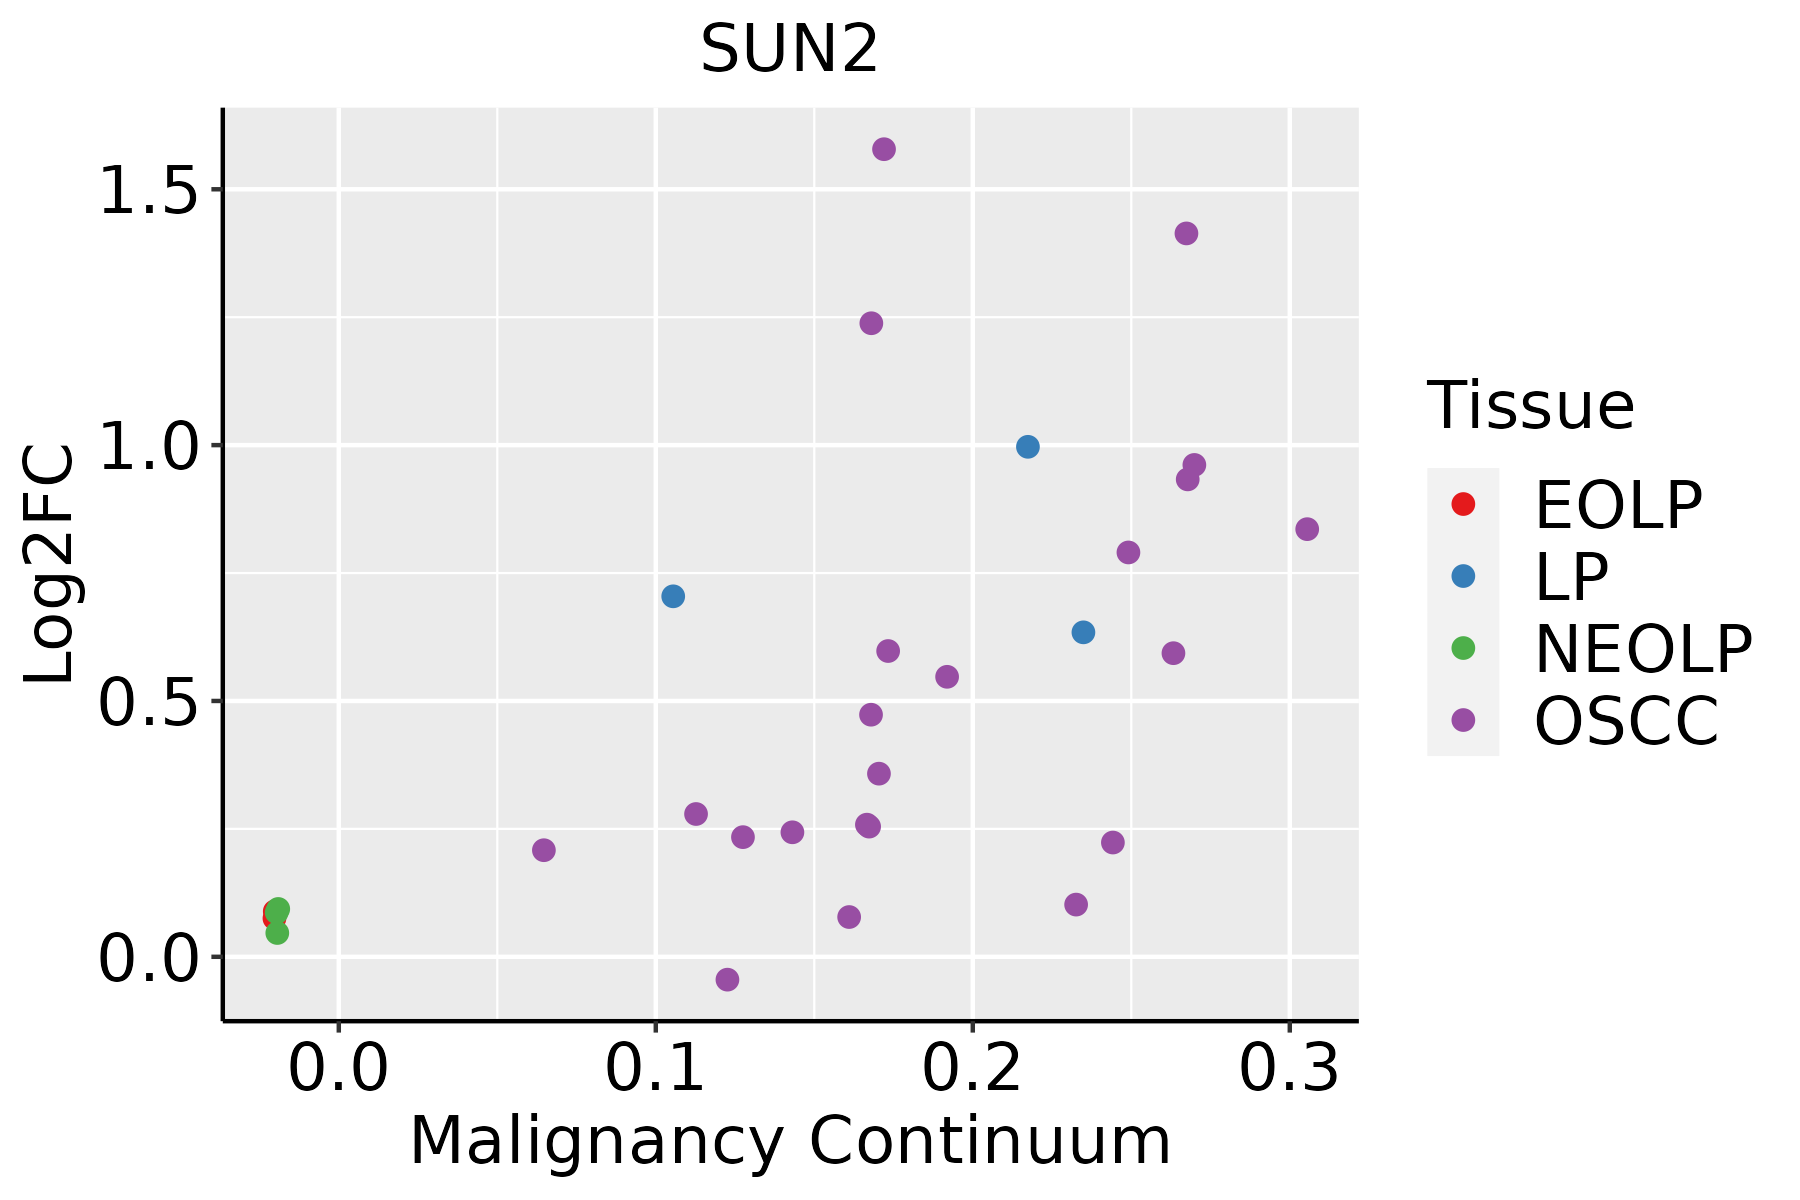 | EOLP: Erosive Oral lichen planus |
| LP: leukoplakia | ||
| NEOLP: Non-erosive oral lichen planus | ||
| OSCC: Oral squamous cell carcinoma | ||
| Prostate | 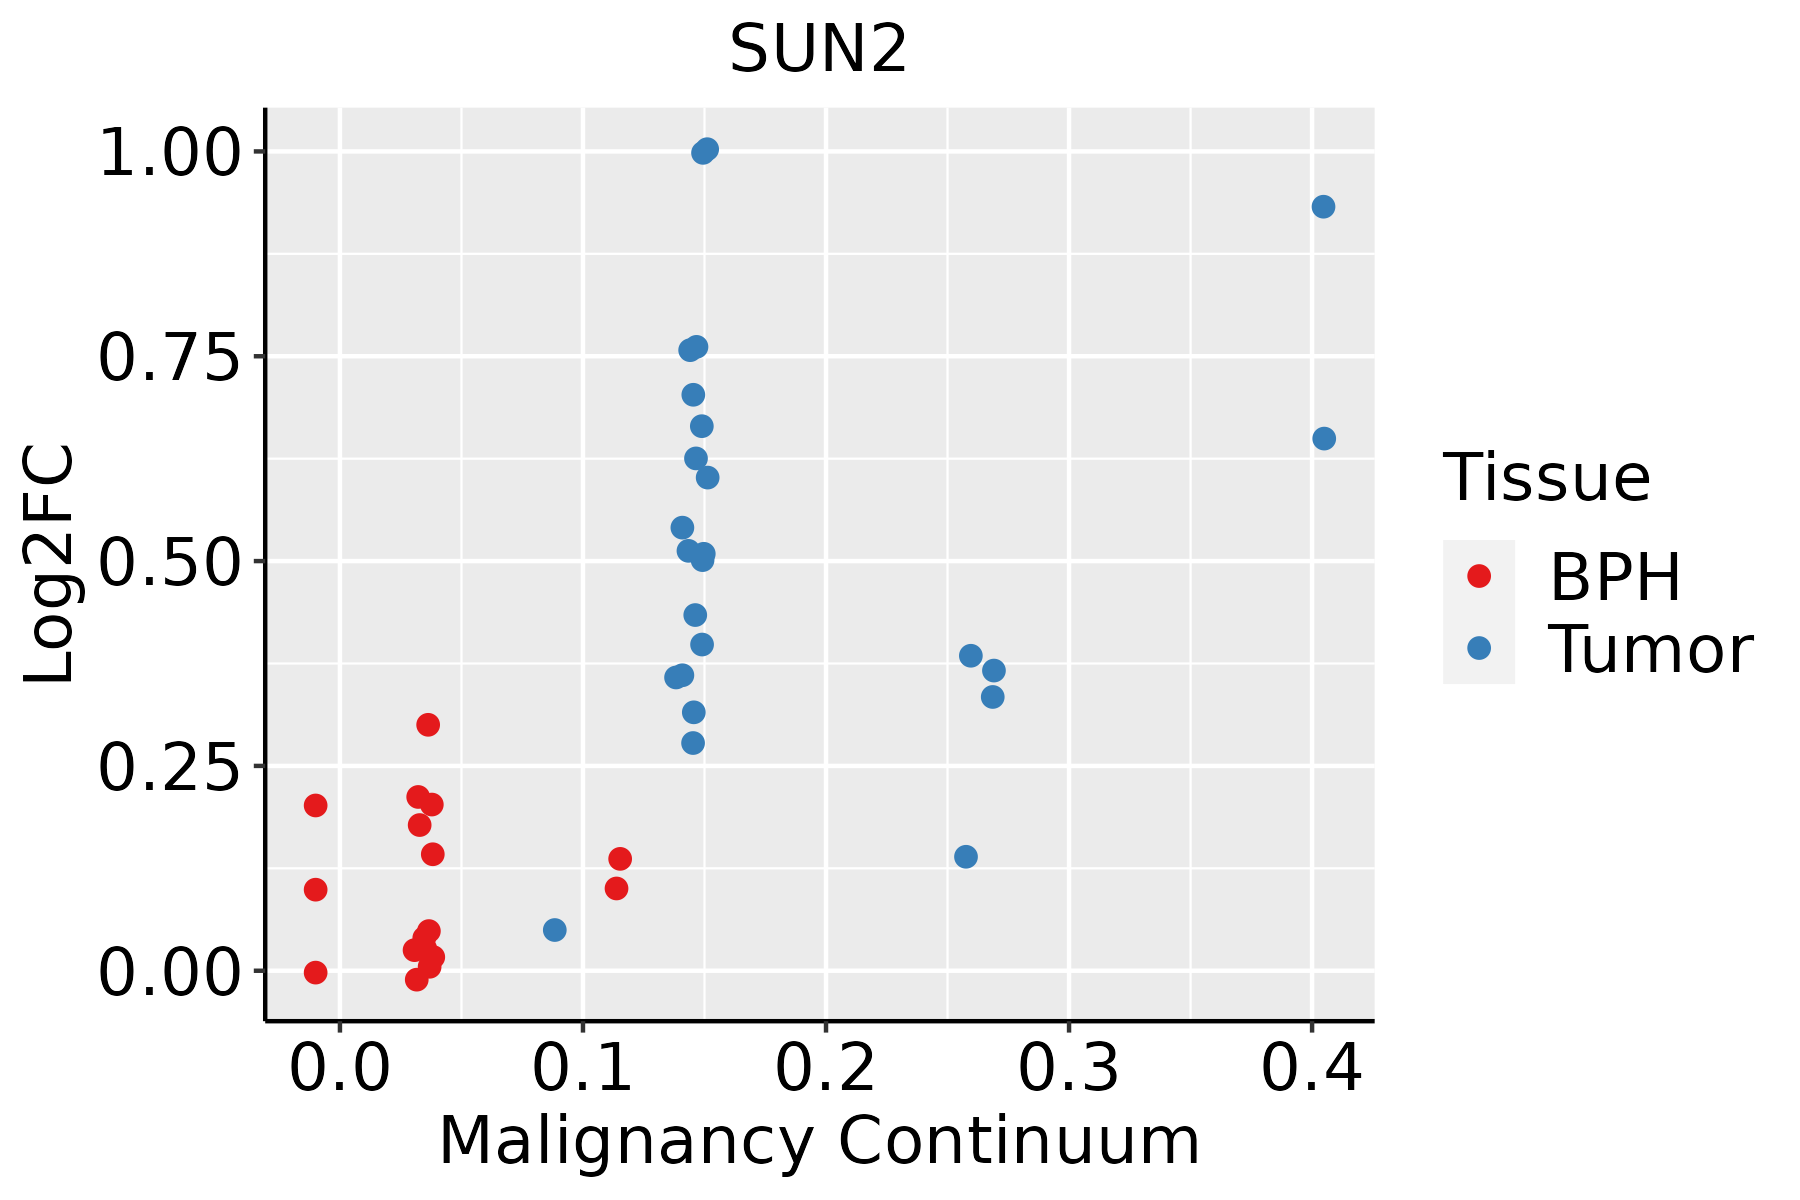 | BPH: Benign Prostatic Hyperplasia |
| Skin | 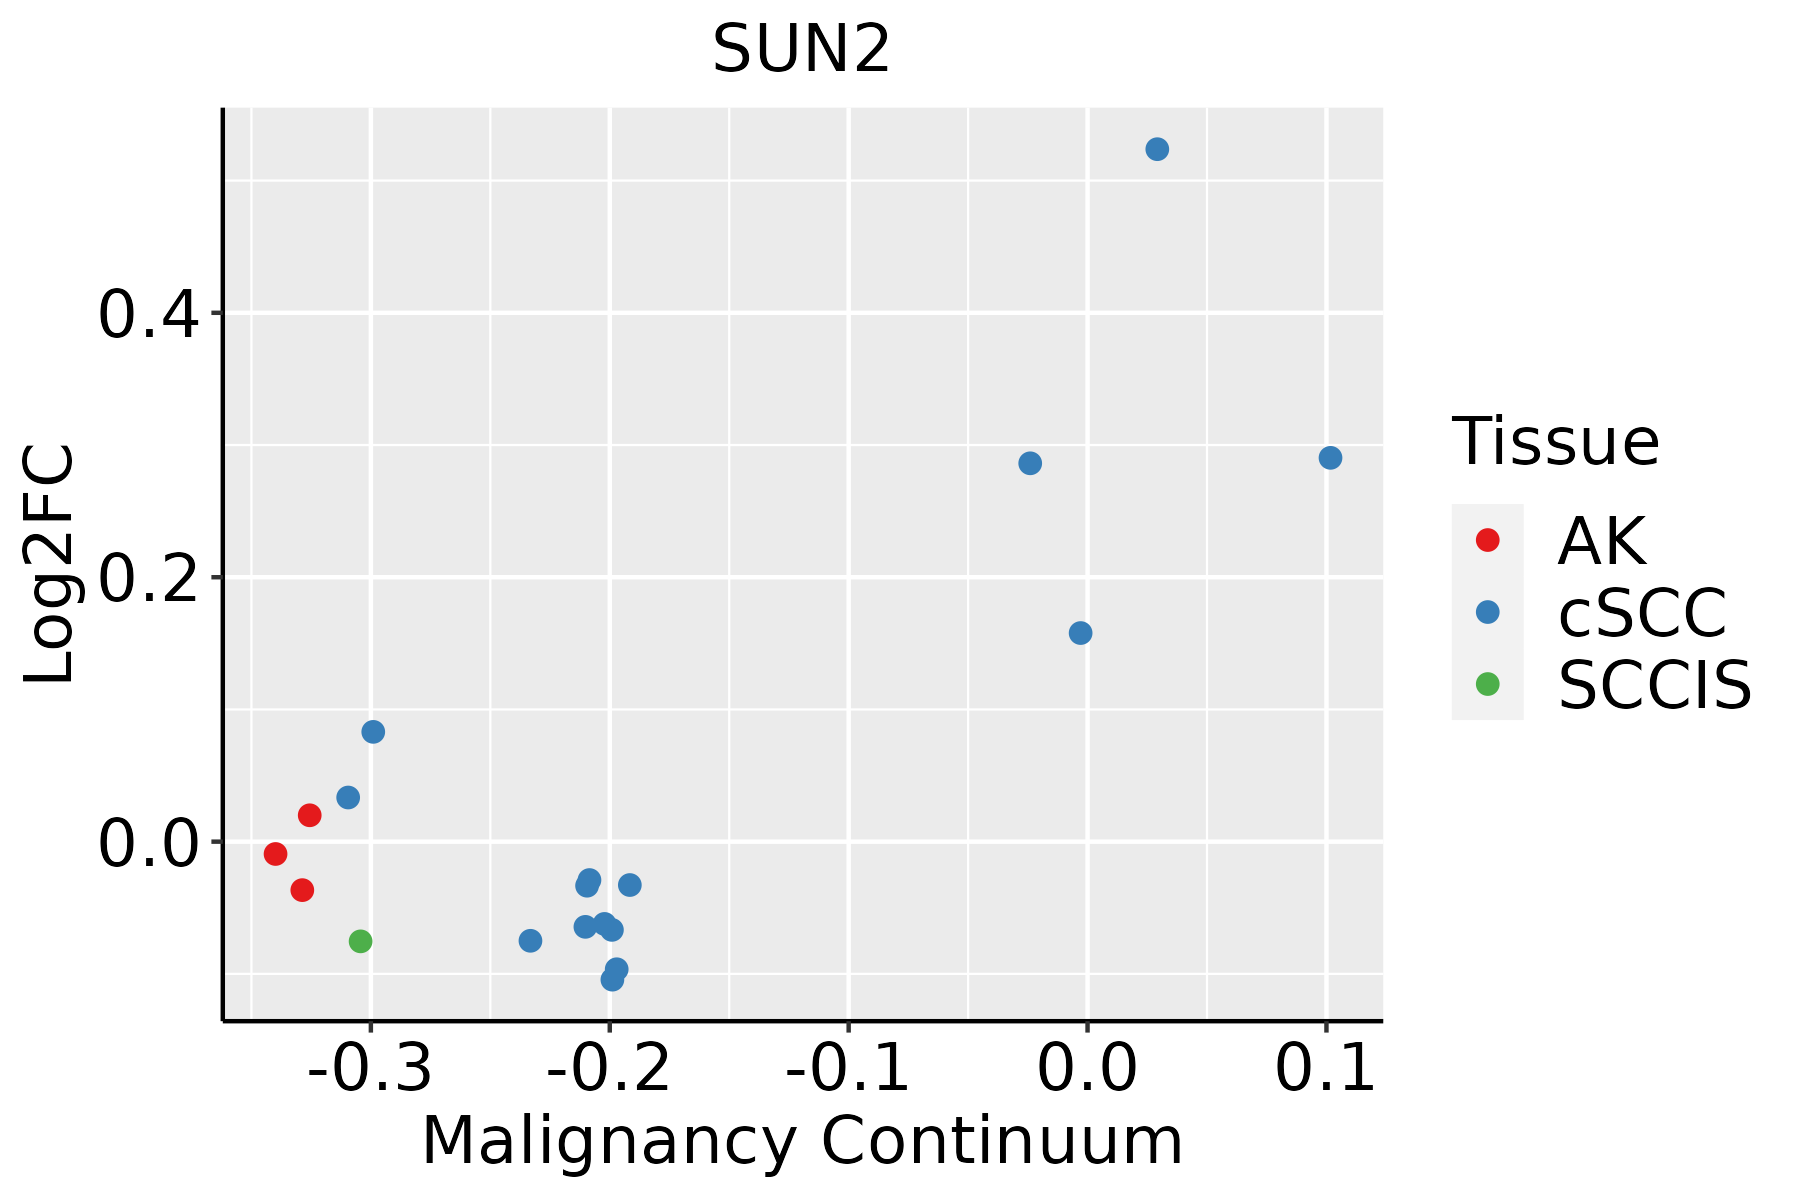 | AK: Actinic keratosis |
| cSCC: Cutaneous squamous cell carcinoma | ||
| SCCIS:squamous cell carcinoma in situ | ||
| Thyroid | 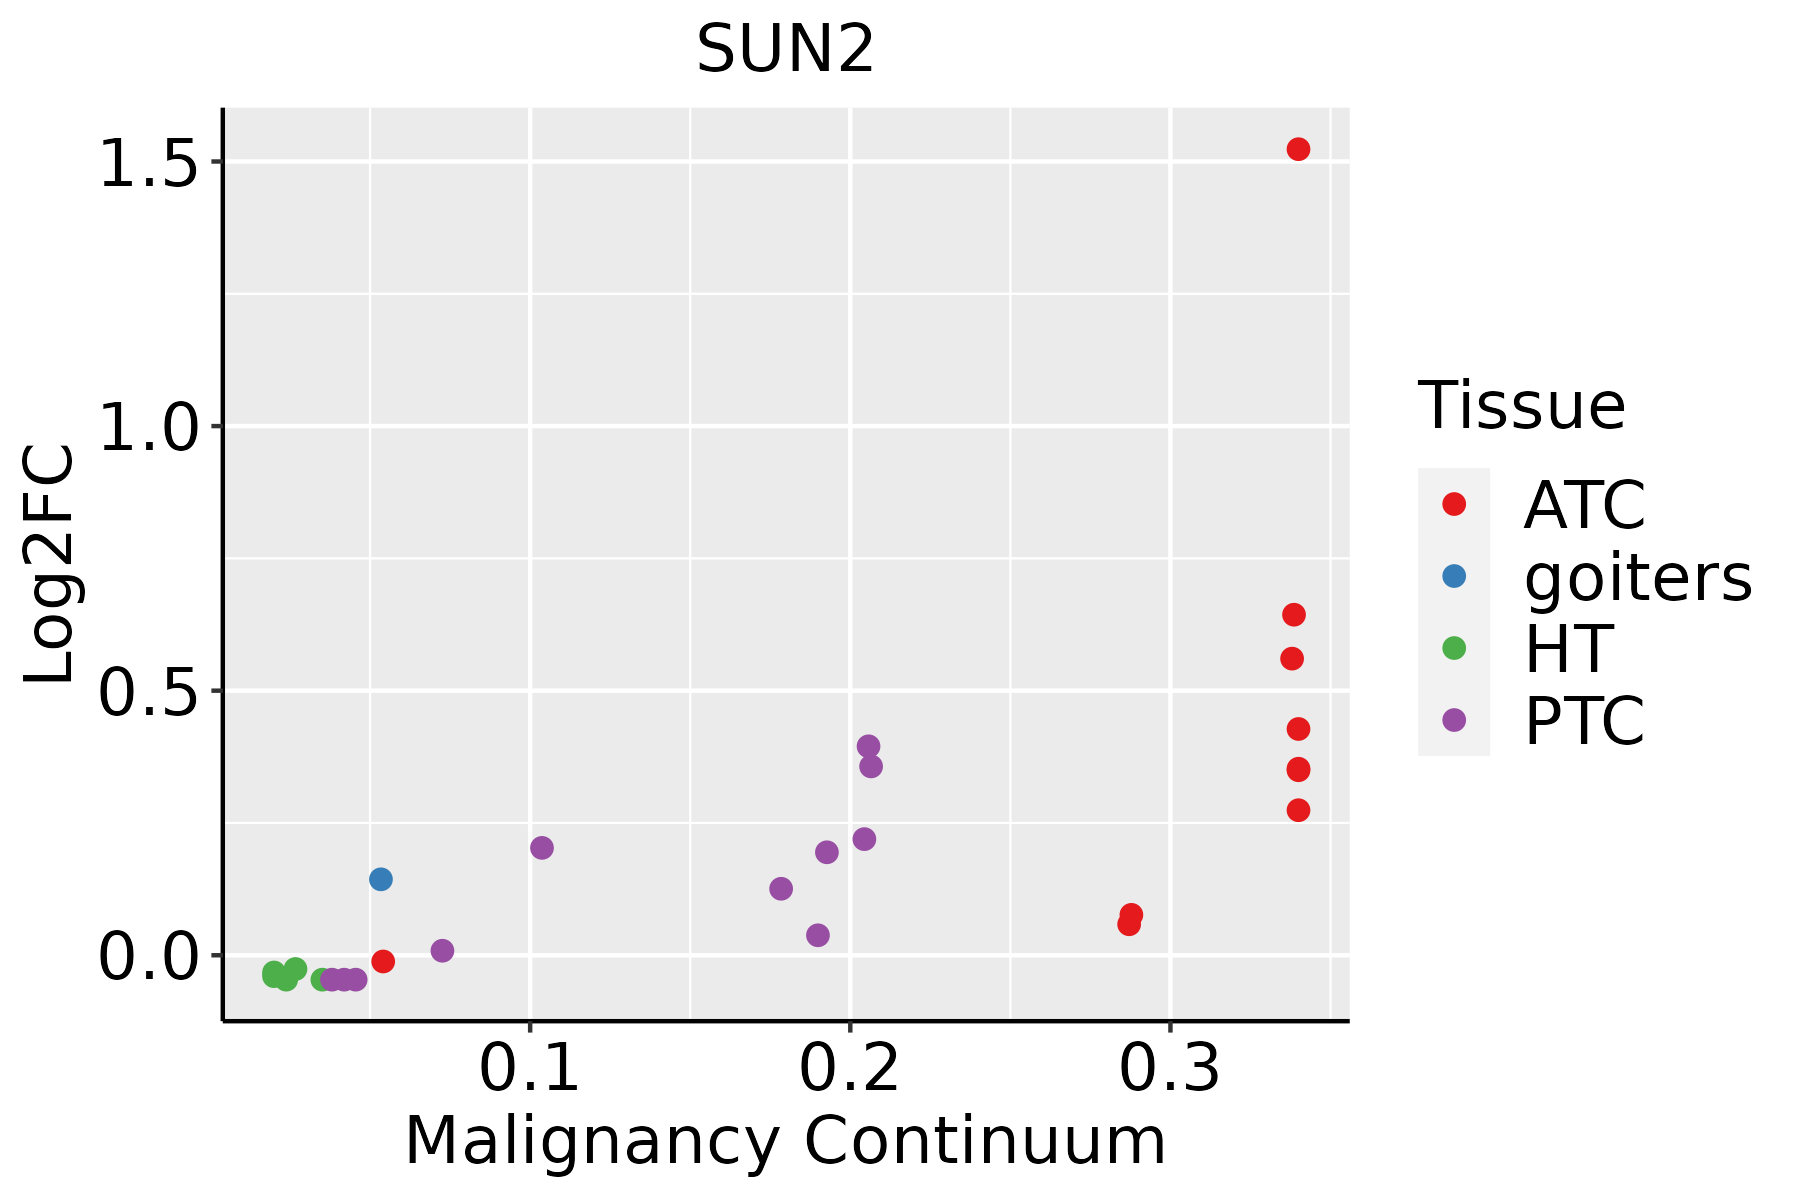 | ATC: Anaplastic thyroid cancer |
| HT: Hashimoto's thyroiditis | ||
| PTC: Papillary thyroid cancer |
| ∗log2FC in expression of this searched gene in stem-like cells from each diseased tissue sample relative to stem-like cells in normal samples in each tissue plotted against the malignancy continuum. Samples are colored based on if they are from different disease stage. |
Top |
Malignant transformation related pathway analysis |
| Find out the enriched GO biological processes and KEGG pathways involved in transition from healthy to precancer to cancer |
| Tissue | Disease Stage | Enriched GO biological Processes |
| Colorectum | AD |  |
| Colorectum | SER |  |
| Colorectum | MSS |  |
| Colorectum | MSI-H |  |
| Colorectum | FAP |  |
| ∗Top 15 enriched GO BP terms are showed in the bar plot of each disease state in each tissue. Each row represents a significant GO biological process which is colored according to the -log10(p.adjust). |
| Page: 1 2 3 4 5 6 7 8 9 |
| GO ID | Tissue | Disease Stage | Description | Gene Ratio | Bg Ratio | pvalue | p.adjust | Count |
| GO:0009895 | Colorectum | AD | negative regulation of catabolic process | 124/3918 | 320/18723 | 1.66e-13 | 3.35e-11 | 124 |
| GO:0031330 | Colorectum | AD | negative regulation of cellular catabolic process | 104/3918 | 262/18723 | 2.66e-12 | 3.96e-10 | 104 |
| GO:0006401 | Colorectum | AD | RNA catabolic process | 102/3918 | 278/18723 | 8.64e-10 | 6.76e-08 | 102 |
| GO:0044270 | Colorectum | AD | cellular nitrogen compound catabolic process | 147/3918 | 451/18723 | 3.35e-09 | 2.23e-07 | 147 |
| GO:0046700 | Colorectum | AD | heterocycle catabolic process | 145/3918 | 445/18723 | 4.37e-09 | 2.84e-07 | 145 |
| GO:0034655 | Colorectum | AD | nucleobase-containing compound catabolic process | 133/3918 | 407/18723 | 1.56e-08 | 9.12e-07 | 133 |
| GO:0019439 | Colorectum | AD | aromatic compound catabolic process | 146/3918 | 467/18723 | 7.48e-08 | 3.84e-06 | 146 |
| GO:1901361 | Colorectum | AD | organic cyclic compound catabolic process | 153/3918 | 495/18723 | 8.23e-08 | 4.18e-06 | 153 |
| GO:0006913 | Colorectum | AD | nucleocytoplasmic transport | 102/3918 | 301/18723 | 1.00e-07 | 4.85e-06 | 102 |
| GO:0051169 | Colorectum | AD | nuclear transport | 102/3918 | 301/18723 | 1.00e-07 | 4.85e-06 | 102 |
| GO:0032386 | Colorectum | AD | regulation of intracellular transport | 109/3918 | 337/18723 | 5.33e-07 | 1.95e-05 | 109 |
| GO:0043487 | Colorectum | AD | regulation of RNA stability | 63/3918 | 170/18723 | 9.17e-07 | 3.12e-05 | 63 |
| GO:0006403 | Colorectum | AD | RNA localization | 71/3918 | 201/18723 | 1.54e-06 | 4.76e-05 | 71 |
| GO:0051236 | Colorectum | AD | establishment of RNA localization | 58/3918 | 166/18723 | 1.95e-05 | 4.01e-04 | 58 |
| GO:0015931 | Colorectum | AD | nucleobase-containing compound transport | 73/3918 | 222/18723 | 2.02e-05 | 4.10e-04 | 73 |
| GO:0046822 | Colorectum | AD | regulation of nucleocytoplasmic transport | 41/3918 | 106/18723 | 2.17e-05 | 4.33e-04 | 41 |
| GO:0050657 | Colorectum | AD | nucleic acid transport | 57/3918 | 163/18723 | 2.22e-05 | 4.39e-04 | 57 |
| GO:0050658 | Colorectum | AD | RNA transport | 57/3918 | 163/18723 | 2.22e-05 | 4.39e-04 | 57 |
| GO:0001701 | Colorectum | AD | in utero embryonic development | 110/3918 | 367/18723 | 2.36e-05 | 4.62e-04 | 110 |
| GO:0051168 | Colorectum | AD | nuclear export | 53/3918 | 154/18723 | 6.89e-05 | 1.11e-03 | 53 |
| Page: 1 2 3 4 5 6 7 8 9 10 11 12 13 14 15 16 17 18 19 20 21 22 23 24 25 26 27 28 29 30 31 32 33 34 35 |
| Pathway ID | Tissue | Disease Stage | Description | Gene Ratio | Bg Ratio | pvalue | p.adjust | qvalue | Count |
| Page: 1 |
Top |
Cell-cell communication analysis |
| Identification of potential cell-cell interactions between two cell types and their ligand-receptor pairs for different disease states |
| Ligand | Receptor | LRpair | Pathway | Tissue | Disease Stage |
| Page: 1 |
Top |
Single-cell gene regulatory network inference analysis |
| Find out the significant the regulons (TFs) and the target genes of each regulon across cell types for different disease states |
| TF | Cell Type | Tissue | Disease Stage | Target Gene | RSS | Regulon Activity |
| ∗The dot plots of a searched regulon are shown for all cell subpopulations in each disease state of each tissue based on the regulon specific score inferred using pySCENIC and by calculating the average expression. |
| Page: 1 |
Top |
Somatic mutation of malignant transformation related genes |
| Annotation of somatic variants for genes involved in malignant transformation |
| Hugo Symbol | Variant Class | Variant Classification | dbSNP RS | HGVSc | HGVSp | HGVSp Short | SWISSPROT | BIOTYPE | SIFT | PolyPhen | Tumor Sample Barcode | Tissue | Histology | Sex | Age | Stage | Therapy Types | Drugs | Outcome |
| SUN2 | SNV | Missense_Mutation | c.1171T>A | p.Ser391Thr | p.S391T | Q9UH99 | protein_coding | tolerated(0.39) | benign(0.014) | TCGA-D8-A1XK-01 | Breast | breast invasive carcinoma | Female | <65 | I/II | Chemotherapy | doxorubicine+cyclophosphamide | SD | |
| SUN2 | SNV | Missense_Mutation | rs142901119 | c.1106N>A | p.Arg369His | p.R369H | Q9UH99 | protein_coding | tolerated(0.15) | benign(0.033) | TCGA-WT-AB44-01 | Breast | breast invasive carcinoma | Female | >=65 | I/II | Hormone Therapy | arimidex | SD |
| SUN2 | SNV | Missense_Mutation | c.2203N>A | p.Glu735Lys | p.E735K | Q9UH99 | protein_coding | deleterious(0) | benign(0.151) | TCGA-C5-A1BQ-01 | Cervix | cervical & endocervical cancer | Female | >=65 | III/IV | Chemotherapy | cisplatin | CR | |
| SUN2 | SNV | Missense_Mutation | c.686N>T | p.Ser229Leu | p.S229L | Q9UH99 | protein_coding | tolerated(0.41) | benign(0.21) | TCGA-IR-A3LI-01 | Cervix | cervical & endocervical cancer | Female | <65 | I/II | Chemotherapy | cisplatin | CR | |
| SUN2 | SNV | Missense_Mutation | rs142753729 | c.277N>A | p.Ala93Thr | p.A93T | Q9UH99 | protein_coding | tolerated(0.73) | benign(0.026) | TCGA-VS-A94Z-01 | Cervix | cervical & endocervical cancer | Female | <65 | I/II | Chemotherapy | cisplatin | CR |
| SUN2 | SNV | Missense_Mutation | c.481C>A | p.Pro161Thr | p.P161T | Q9UH99 | protein_coding | tolerated(0.57) | benign(0.051) | TCGA-WL-A834-01 | Cervix | cervical & endocervical cancer | Female | <65 | I/II | Chemotherapy | paclitaxel | SD | |
| SUN2 | SNV | Missense_Mutation | rs145042745 | c.661N>A | p.Val221Ile | p.V221I | Q9UH99 | protein_coding | deleterious(0.01) | probably_damaging(0.945) | TCGA-5M-AAT6-01 | Colorectum | colon adenocarcinoma | Female | <65 | III/IV | Unknown | Unknown | PD |
| SUN2 | SNV | Missense_Mutation | rs752409009 | c.734N>T | p.Thr245Met | p.T245M | Q9UH99 | protein_coding | deleterious(0.02) | possibly_damaging(0.742) | TCGA-A6-2686-01 | Colorectum | colon adenocarcinoma | Female | >=65 | I/II | Unknown | Unknown | SD |
| SUN2 | SNV | Missense_Mutation | rs752150588 | c.1775N>T | p.Thr592Met | p.T592M | Q9UH99 | protein_coding | deleterious(0) | probably_damaging(0.984) | TCGA-A6-4105-01 | Colorectum | colon adenocarcinoma | Male | >=65 | I/II | Unknown | Unknown | PD |
| SUN2 | SNV | Missense_Mutation | c.2023N>T | p.Asp675Tyr | p.D675Y | Q9UH99 | protein_coding | deleterious(0) | possibly_damaging(0.725) | TCGA-AA-3492-01 | Colorectum | colon adenocarcinoma | Female | >=65 | I/II | Unknown | Unknown | SD |
| Page: 1 2 3 4 5 6 |
Top |
Related drugs of malignant transformation related genes |
| Identification of chemicals and drugs interact with genes involved in malignant transfromation |
| (DGIdb 4.0) |
| Entrez ID | Symbol | Category | Interaction Types | Drug Claim Name | Drug Name | PMIDs |
| Page: 1 |

Copyright 2023-Present -The University of Texas Health Science Center at Houston |