Schematic overview of the cellular and molecular mechanisms involved in the cancer progression, including the proposed cellular and molecular mechanisms in cancer cells trajectory. AT1: alveolar type 1 cells; AT2: alveolar type 2 cells; AAH: atypical adenomatous hyperplasia; AIS: adenocarcinoma in situ; MIA: minimally invasive adenocarcinoma; IA: invasive adenocarcinoma; EMT: epithelial-mesenchymal transition

Home

Download

Statistics

Help

Contact

Center for Computational Systems Medicine
leaf

Gene summary

leaf

Malignant transformation analysis

leaf

Malignant transformation related pathway analysis

leaf

Cell-cell communication analysis

leaf

Single-cell gene regulatory network inference analysis

leaf

Somatic mutation of malignant transformation related genes

leaf

Related drugs of malignant transformation related genes

Gene: SUN1

Gene summary for SUN1

check button Gene summary.

Gene informationSpeciesHuman
Gene symbol

SUN1

Gene ID

23353

Gene nameSad1 and UNC84 domain containing 1
Gene AliasUNC84A
Cytomap7p22.3
Gene Typeprotein-coding
GO ID

GO:0000003

UniProtAcc

O94901


Top

Malignant transformation analysis

check button Identification of the aberrant gene expression in precancerous and cancerous lesions by comparing the gene expression of stem-like cells in diseased tissues with normal stem cells
check button Malignant transformation involving gene list.
Entrez IDSymbolReplicatesSpeciesOrganTissueAdj P-valueLog2FCMalignancy
23353SUN1LZE2THumanEsophagusESCC3.23e-023.87e-010.082
23353SUN1LZE4THumanEsophagusESCC7.23e-182.31e-010.0811
23353SUN1LZE5THumanEsophagusESCC6.04e-043.00e-010.0514
23353SUN1LZE7THumanEsophagusESCC3.79e-043.12e-010.0667
23353SUN1LZE8THumanEsophagusESCC1.89e-061.35e-010.067
23353SUN1LZE22D1HumanEsophagusHGIN9.75e-051.85e-020.0595
23353SUN1LZE22THumanEsophagusESCC1.62e-067.09e-010.068
23353SUN1LZE24THumanEsophagusESCC2.28e-082.43e-010.0596
23353SUN1LZE21THumanEsophagusESCC4.20e-056.21e-010.0655
23353SUN1P1T-EHumanEsophagusESCC1.51e-097.25e-010.0875
23353SUN1P2T-EHumanEsophagusESCC3.82e-233.77e-010.1177
23353SUN1P4T-EHumanEsophagusESCC1.51e-184.43e-010.1323
23353SUN1P5T-EHumanEsophagusESCC2.22e-234.10e-010.1327
23353SUN1P8T-EHumanEsophagusESCC4.09e-296.81e-010.0889
23353SUN1P9T-EHumanEsophagusESCC5.10e-192.95e-010.1131
23353SUN1P10T-EHumanEsophagusESCC1.08e-336.92e-010.116
23353SUN1P11T-EHumanEsophagusESCC1.05e-096.92e-010.1426
23353SUN1P12T-EHumanEsophagusESCC2.66e-367.89e-010.1122
23353SUN1P15T-EHumanEsophagusESCC2.57e-205.22e-010.1149
23353SUN1P16T-EHumanEsophagusESCC1.25e-223.29e-010.1153
Page: 1 2 3 4 5 6 7 

check button Transcriptomic changes along malignancy continuum.
TissueExpression DynamicsAbbreviation
EsophagusThe image shows the transcriptomic changes along malignancy continuum.log2FC in expression of this searched gene in stem-like cells from each diseased tissue sample relative to stem-like cells in normal samples in each tissue plotted against the malignancy continuum. Samples are colored based on if they are from different disease stage.
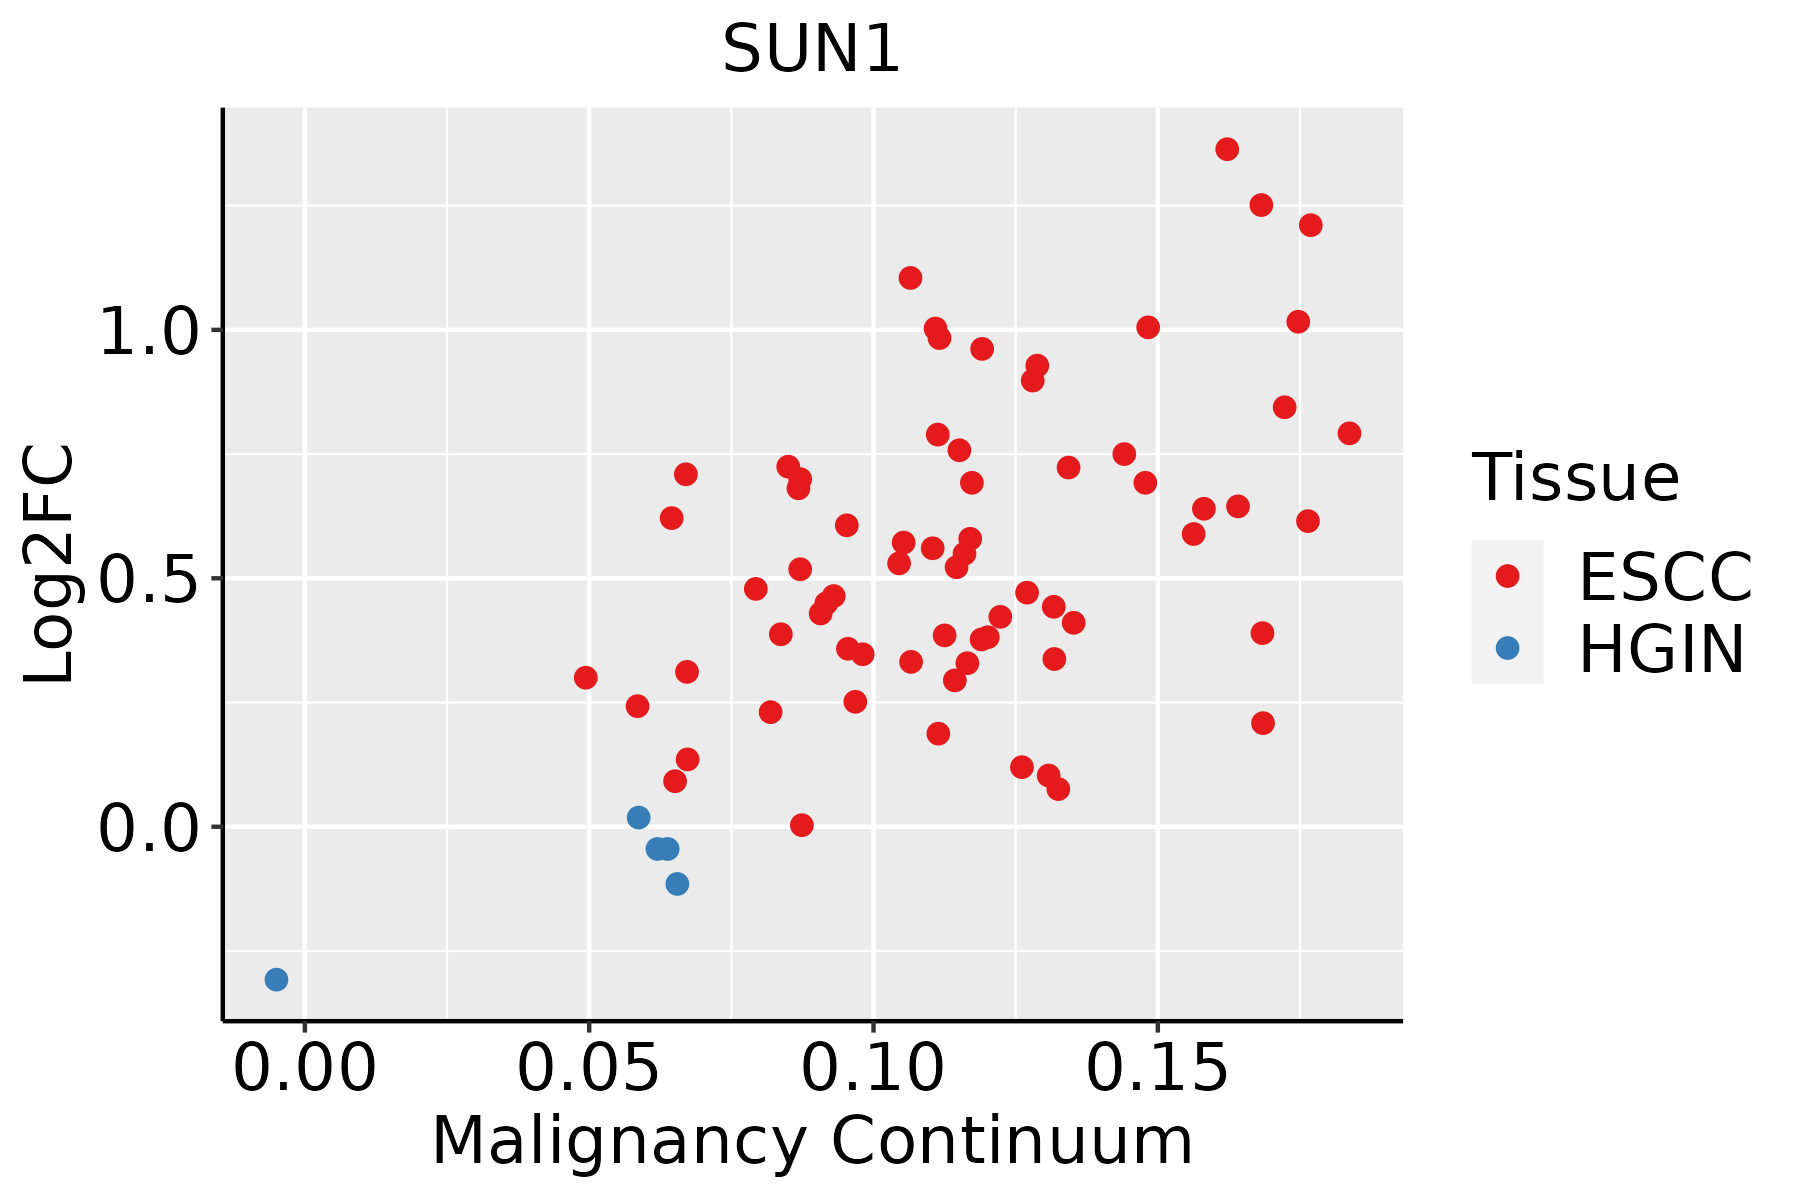
ESCC: Esophageal squamous cell carcinoma
HGIN: High-grade intraepithelial neoplasias
LGIN: Low-grade intraepithelial neoplasias
LiverThe image shows the transcriptomic changes along malignancy continuum.log2FC in expression of this searched gene in stem-like cells from each diseased tissue sample relative to stem-like cells in normal samples in each tissue plotted against the malignancy continuum. Samples are colored based on if they are from different disease stage.
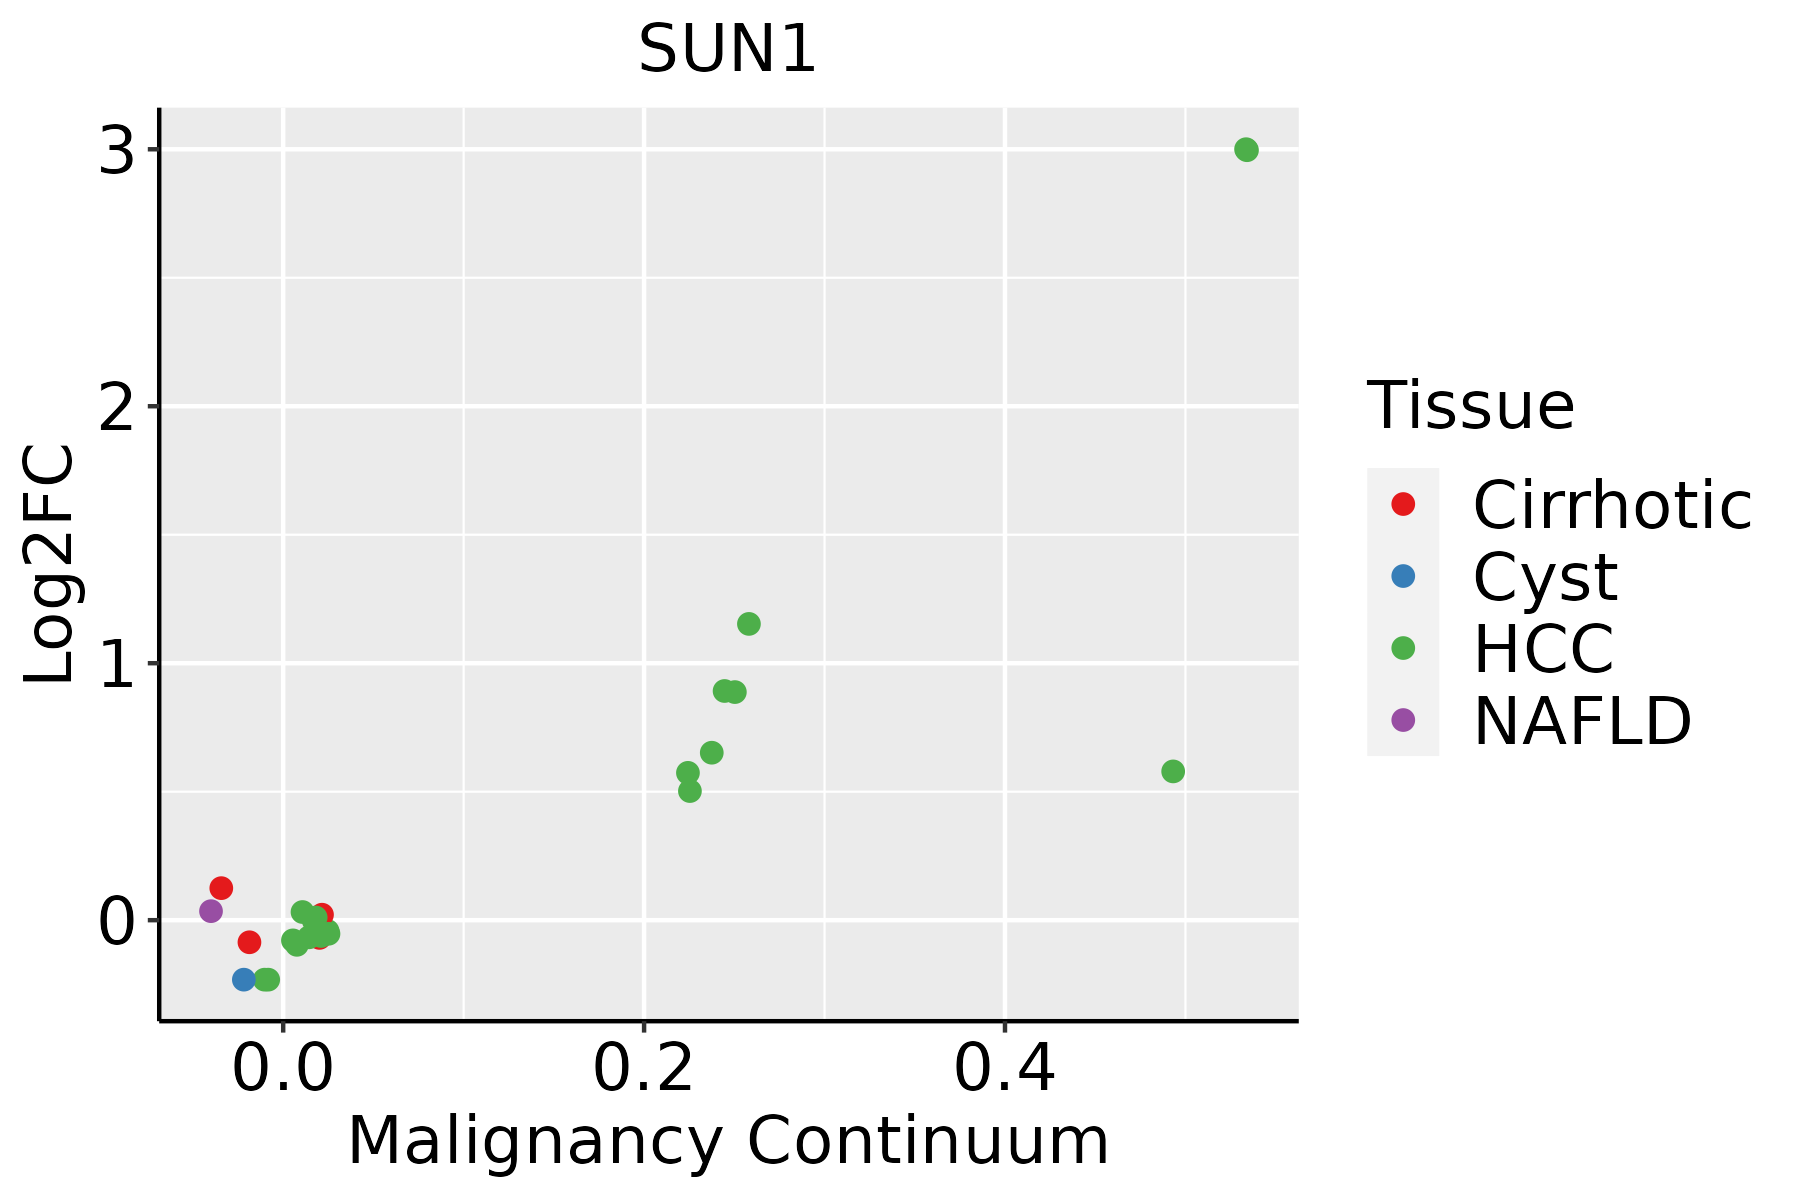
HCC: Hepatocellular carcinoma
NAFLD: Non-alcoholic fatty liver disease
LungThe image shows the transcriptomic changes along malignancy continuum.log2FC in expression of this searched gene in stem-like cells from each diseased tissue sample relative to stem-like cells in normal samples in each tissue plotted against the malignancy continuum. Samples are colored based on if they are from different disease stage.AAH: Atypical adenomatous hyperplasia
AIS: Adenocarcinoma in situ
IAC: Invasive lung adenocarcinoma
MIA: Minimally invasive adenocarcinoma
Oral CavityThe image shows the transcriptomic changes along malignancy continuum.log2FC in expression of this searched gene in stem-like cells from each diseased tissue sample relative to stem-like cells in normal samples in each tissue plotted against the malignancy continuum. Samples are colored based on if they are from different disease stage.EOLP: Erosive Oral lichen planus
LP: leukoplakia
NEOLP: Non-erosive oral lichen planus
OSCC: Oral squamous cell carcinoma
SkinThe image shows the transcriptomic changes along malignancy continuum.log2FC in expression of this searched gene in stem-like cells from each diseased tissue sample relative to stem-like cells in normal samples in each tissue plotted against the malignancy continuum. Samples are colored based on if they are from different disease stage.
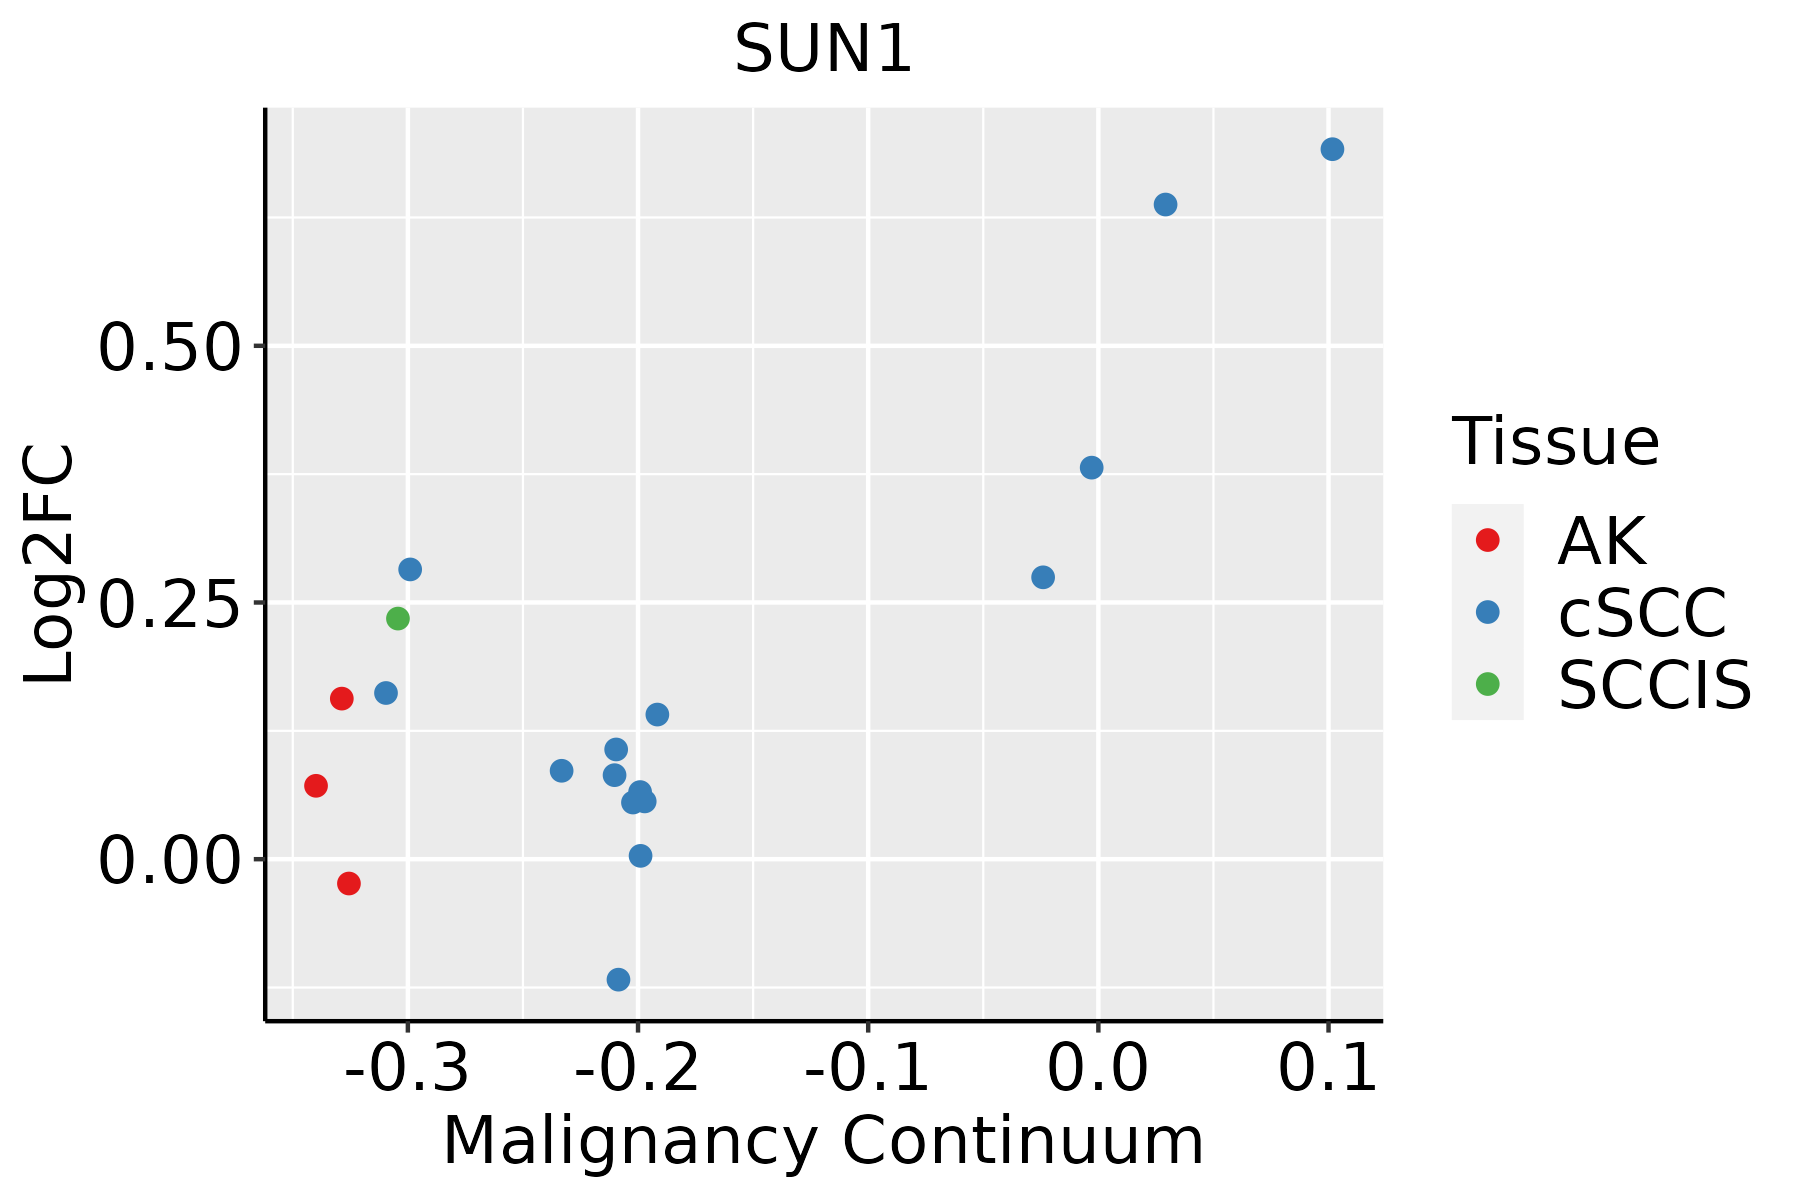
AK: Actinic keratosis
cSCC: Cutaneous squamous cell carcinoma
SCCIS:squamous cell carcinoma in situ
ThyroidThe image shows the transcriptomic changes along malignancy continuum.log2FC in expression of this searched gene in stem-like cells from each diseased tissue sample relative to stem-like cells in normal samples in each tissue plotted against the malignancy continuum. Samples are colored based on if they are from different disease stage.
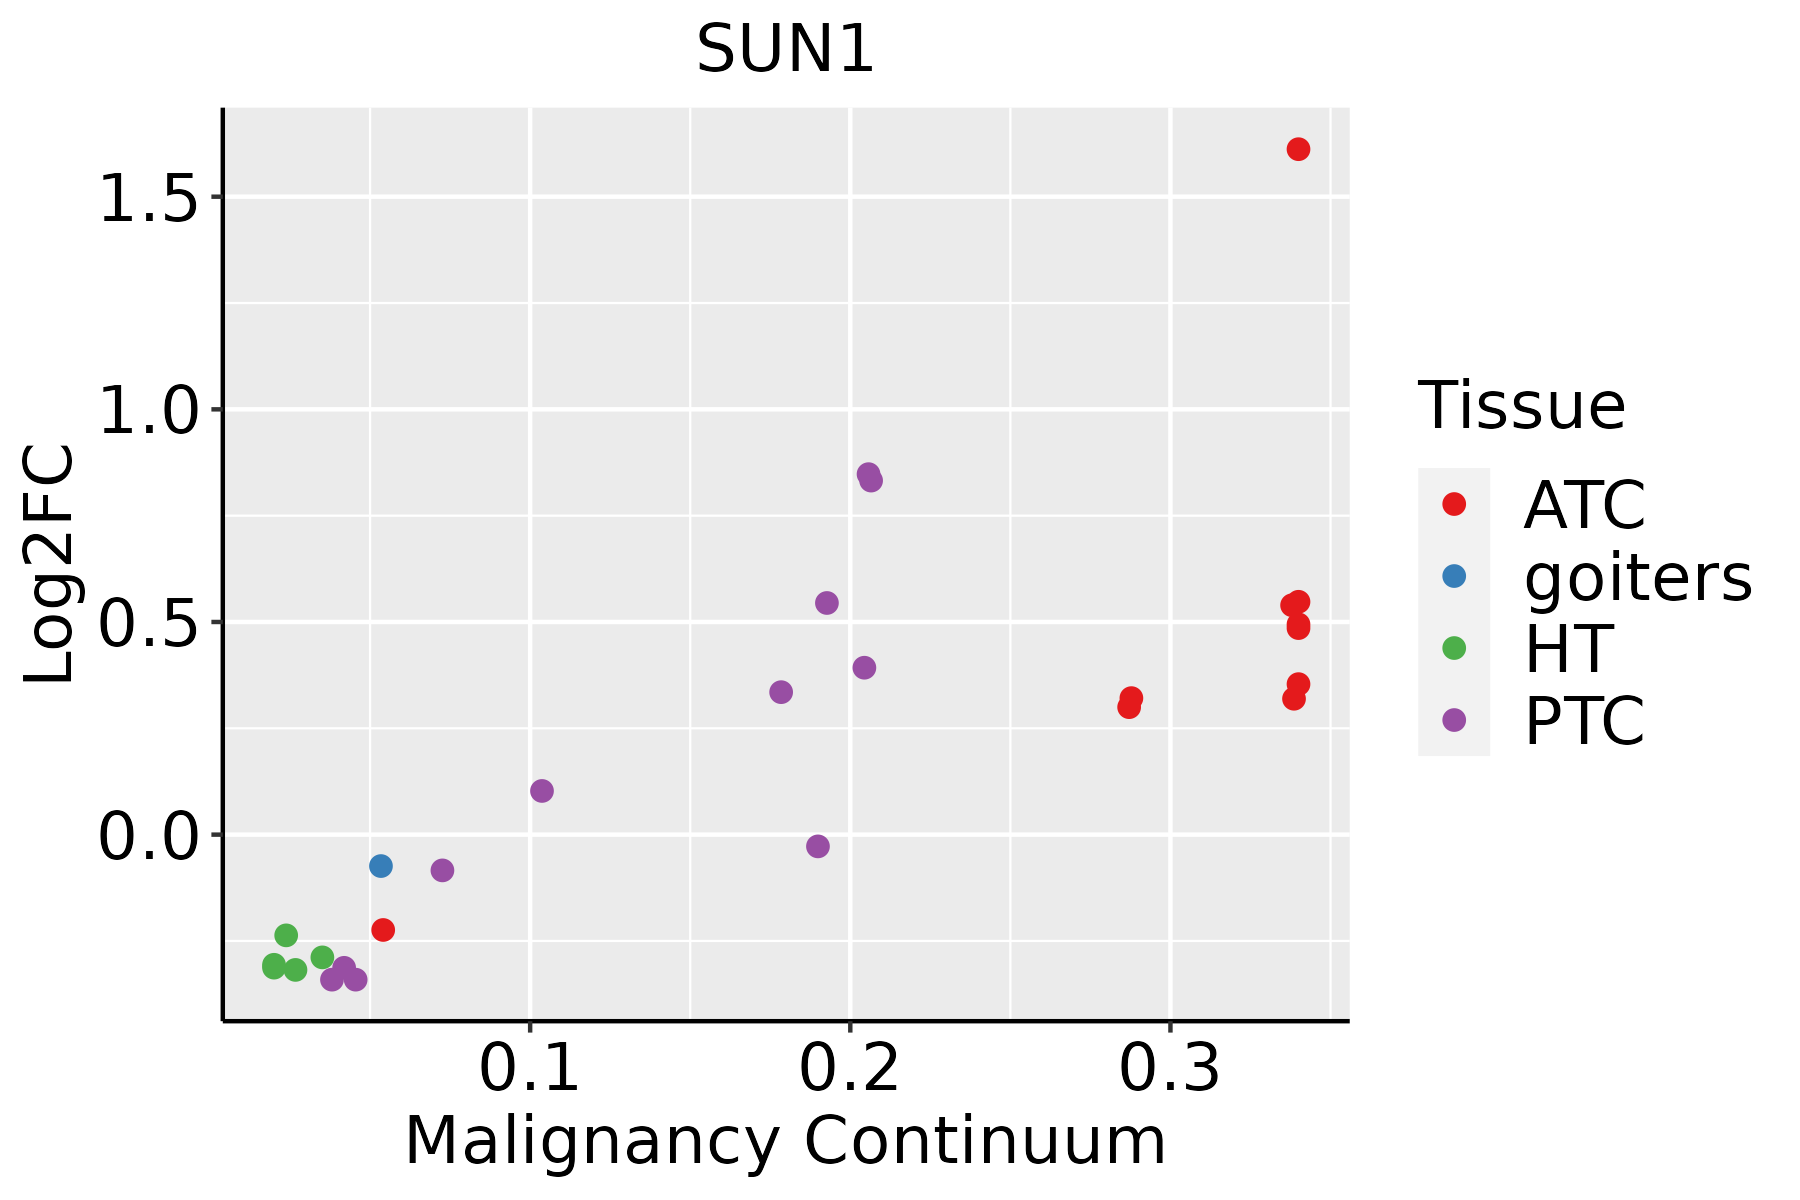
ATC: Anaplastic thyroid cancer
HT: Hashimoto's thyroiditis
PTC: Papillary thyroid cancer
∗log2FC in expression of this searched gene in stem-like cells from each diseased tissue sample relative to stem-like cells in normal samples in each tissue plotted against the malignancy continuum. Samples are colored based on if they are from different disease stage.

Top

Malignant transformation related pathway analysis

check buttonFind out the enriched GO biological processes and KEGG pathways involved in transition from healthy to precancer to cancer
check button Figure of enriched GO biological processes.
TissueDisease StageEnriched GO biological Processes
ColorectumADGO analysis - Figure of enriched GO biological processes: Top 15 enriched GO BP terms are showed in the bar plot of each disease state in each tissue. Each row represents a significant GO biological process which is colored according to the -log10(p.adjust).
ColorectumSERGO analysis - Figure of enriched GO biological processes: Top 15 enriched GO BP terms are showed in the bar plot of each disease state in each tissue. Each row represents a significant GO biological process which is colored according to the -log10(p.adjust).
ColorectumMSSGO analysis - Figure of enriched GO biological processes: Top 15 enriched GO BP terms are showed in the bar plot of each disease state in each tissue. Each row represents a significant GO biological process which is colored according to the -log10(p.adjust).
ColorectumMSI-HGO analysis - Figure of enriched GO biological processes: Top 15 enriched GO BP terms are showed in the bar plot of each disease state in each tissue. Each row represents a significant GO biological process which is colored according to the -log10(p.adjust).
ColorectumFAPGO analysis - Figure of enriched GO biological processes: Top 15 enriched GO BP terms are showed in the bar plot of each disease state in each tissue. Each row represents a significant GO biological process which is colored according to the -log10(p.adjust).
∗Top 15 enriched GO BP terms are showed in the bar plot of each disease state in each tissue. Each row represents a significant GO biological process which is colored according to the -log10(p.adjust).
Page: 1 2 3 4 5 6 7 8 9 

check button Enriched GO biological processes.
GO IDTissueDisease StageDescriptionGene RatioBg Ratiopvaluep.adjustCount
GO:003450417EsophagusHGINprotein localization to nucleus84/2587290/187231.06e-111.24e-0984
GO:005165616EsophagusHGINestablishment of organelle localization90/2587390/187234.27e-071.94e-0590
GO:005165126EsophagusHGINmaintenance of location in cell53/2587214/187231.22e-053.45e-0453
GO:005123520EsophagusHGINmaintenance of location73/2587327/187231.73e-054.71e-0473
GO:004518523EsophagusHGINmaintenance of protein location28/258794/187234.52e-051.09e-0328
GO:00500003EsophagusHGINchromosome localization24/258782/187232.07e-043.82e-0324
GO:00069975EsophagusHGINnucleus organization34/2587133/187232.20e-044.00e-0334
GO:003070517EsophagusHGINcytoskeleton-dependent intracellular transport45/2587195/187233.07e-045.15e-0345
GO:003250719EsophagusHGINmaintenance of protein location in cell20/258765/187233.31e-045.48e-0320
GO:00070593EsophagusHGINchromosome segregation71/2587346/187233.47e-045.62e-0371
GO:00513033EsophagusHGINestablishment of chromosome localization23/258780/187233.71e-045.77e-0323
GO:00514575EsophagusHGINmaintenance of protein location in nucleus10/258723/187235.09e-047.38e-0310
GO:00725959EsophagusHGINmaintenance of protein localization in organelle14/258742/187231.05e-031.31e-0214
GO:00109707EsophagusHGINtransport along microtubule35/2587155/187232.01e-032.12e-0235
GO:00069983EsophagusHGINnuclear envelope organization14/258747/187233.49e-033.23e-0214
GO:000150316EsophagusHGINossification75/2587408/187235.49e-034.49e-0275
GO:005165617EsophagusESCCestablishment of organelle localization273/8552390/187239.13e-231.81e-20273
GO:003450418EsophagusESCCprotein localization to nucleus211/8552290/187234.06e-216.60e-19211
GO:000705911EsophagusESCCchromosome segregation238/8552346/187231.72e-181.82e-16238
GO:00482853EsophagusESCCorganelle fission301/8552488/187234.64e-132.12e-11301
Page: 1 2 3 4 5 6 7 8 9 10 11 12 13 14 

check button Enriched KEGG pathways.
Pathway IDTissueDisease StageDescriptionGene RatioBg Ratiopvaluep.adjustqvalueCount
Page: 1 

Top

Cell-cell communication analysis

check buttonIdentification of potential cell-cell interactions between two cell types and their ligand-receptor pairs for different disease states
LigandReceptorLRpairPathwayTissueDisease Stage
Page: 1 

Top

Single-cell gene regulatory network inference analysis

check buttonFind out the significant the regulons (TFs) and the target genes of each regulon across cell types for different disease states
TFCell TypeTissueDisease StageTarget GeneRSSRegulon Activity
∗The dot plots of a searched regulon are shown for all cell subpopulations in each disease state of each tissue based on the regulon specific score inferred using pySCENIC and by calculating the average expression.
Page: 1 

Top

Somatic mutation of malignant transformation related genes

check buttonAnnotation of somatic variants for genes involved in malignant transformation
Hugo SymbolVariant ClassVariant ClassificationdbSNP RSHGVScHGVSpHGVSp ShortSWISSPROTBIOTYPESIFTPolyPhenTumor Sample BarcodeTissueHistologySexAgeStageTherapy TypesDrugsOutcome
SUN1SNVMissense_Mutationc.499N>Gp.Gln167Glup.Q167EO94901protein_codingtolerated(0.1)probably_damaging(0.994)TCGA-A2-A0EY-01Breastbreast invasive carcinomaFemale<65I/IIChemotherapyadriamycinSD
SUN1SNVMissense_Mutationc.730N>Tp.Ala244Serp.A244SO94901protein_codingtolerated(0.12)benign(0.104)TCGA-E9-A1NC-01Breastbreast invasive carcinomaFemale<65I/IIChemotherapydoxorubicinCR
SUN1SNVMissense_Mutationnovelc.968N>Tp.Trp323Leup.W323LO94901protein_codingdeleterious(0.05)probably_damaging(0.997)TCGA-S3-AA10-01Breastbreast invasive carcinomaFemale>=65I/IIChemotherapycytoxanCR
SUN1insertionNonsense_Mutationnovelc.216_217insAGTTGTGAATTGTCTGAAGCCTTTAGATAAATTCTAAATTTAp.Gly72_Ala73insSerCysGluLeuSerGluAlaPheArgTerIleLeuAsnLeup.G72_A73insSCELSEAFR*ILNLO94901protein_codingTCGA-B6-A0IC-01Breastbreast invasive carcinomaFemale>=65I/IIUnknownUnknownSD
SUN1SNVMissense_Mutationnovelc.841C>Tp.Leu281Phep.L281FO94901protein_codingtolerated(0.11)possibly_damaging(0.677)TCGA-2W-A8YY-01Cervixcervical & endocervical cancerFemale<65I/IIChemotherapycisplatinCR
SUN1SNVMissense_Mutationc.2077N>Gp.Leu693Valp.L693VO94901protein_codingtolerated(0.2)benign(0.06)TCGA-IR-A3LK-01Cervixcervical & endocervical cancerFemale>=65I/IIChemotherapycisplatinPD
SUN1SNVMissense_Mutationrs537139636c.1702G>Ap.Val568Metp.V568MO94901protein_codingdeleterious(0.04)benign(0.07)TCGA-A6-6653-01Colorectumcolon adenocarcinomaMale>=65I/IIUnknownUnknownSD
SUN1SNVMissense_Mutationrs775225289c.149G>Ap.Arg50Glnp.R50QO94901protein_codingdeleterious(0)probably_damaging(0.996)TCGA-AA-3492-01Colorectumcolon adenocarcinomaFemale>=65I/IIUnknownUnknownSD
SUN1SNVMissense_Mutationc.1776N>Tp.Glu592Aspp.E592DO94901protein_codingdeleterious(0)probably_damaging(0.933)TCGA-AA-3663-01Colorectumcolon adenocarcinomaMale<65I/IIUnknownUnknownSD
SUN1SNVMissense_Mutationnovelc.770N>Tp.Ser257Phep.S257FO94901protein_codingdeleterious(0)possibly_damaging(0.654)TCGA-AA-3811-01Colorectumcolon adenocarcinomaFemale>=65III/IVUnknownUnknownPD
Page: 1 2 3 4 5 6 7 8 9 

Top

Related drugs of malignant transformation related genes

check buttonIdentification of chemicals and drugs interact with genes involved in malignant transfromation
(DGIdb 4.0)
Entrez IDSymbolCategoryInteraction TypesDrug Claim NameDrug NamePMIDs
Page: 1